
Middle East And Africa Silk Market
Market Size in USD Million
 USD
504.27 Million
USD
902.50 Million
2024
2032
USD
504.27 Million
USD
902.50 Million
2024
2032
| 2025 - 2032 | |
| USD 504.27 Million | |
| USD 902.50 Million | |
| % | |
|
Silk Market Size
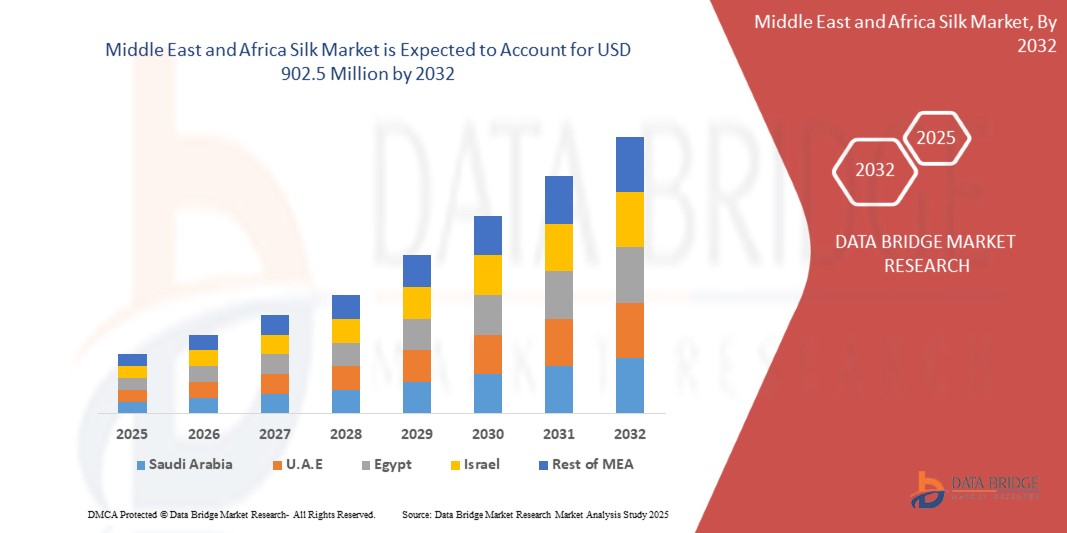
- The Middle East and Africa Silk Market was valued at USD 504.27 million in 2024 and is expected to reach USD 902.5 million by 2032, at a CAGR of 7.7% during the forecast period
- The market growth is largely fueled by the rising consumer preference for sustainable and ethically sourced silk, including peace silk and organic silk
- This growth is driven by factors such as strong government support for domestic silk production, especially in leading producers like South Africa and Egypt. Subsidies, R&D programs, and infrastructure investments are enhancing silk quality and output, which in turn are supporting rising demand from apparel, cosmetics, and medical sectors globally
Silk Market Analysis
- The Middle East and Africa silk market is experiencing steady growth, driven by rising demand for natural, luxurious, and biodegradable textiles amid growing sustainability concerns. Consumers are increasingly opting for silk due to its premium texture, hypoallergenic properties, and biodegradability, especially in apparel, home furnishings, and personal care products. Key markets such as Egypt and South Africa continue to influence Middle East and Africa supply and innovation, while developing countries are expanding production capacity with government support and rural employment programs.
- Silk is widely used across multiple sectors, including fashion, cosmetics, and medical applications. In the apparel industry, it remains a preferred fabric for high-end garments, bridalwear, and formalwear due to its luster and comfort. Beyond textiles, silk fibroin and sericin are being utilized in skincare, wound healing, and biomedical innovations such as sutures and scaffolds. Its adaptability across both traditional and modern applications supports its market relevance in an increasingly diversified and value-driven textile landscape.
- South Africa dominated the global silk market in 2024, primarily due to its well-established sericulture infrastructure, abundant mulberry cultivation, and integrated value chain covering cocoon production to finished silk goods
- South Africa is expected to witness the highest CAGR in the Middle East and Africa silk market, supported by continuous investments in sustainable sericulture practices, technological advancements in silk processing, and rising domestic demand for luxury and eco-friendly textiles
- The Mulberry Silk segment dominated the global silk market in 2024, due to its superior fiber quality, softness, luster, and widespread use in premium textiles. As the most commercially cultivated and processed silk type, its consistent supply and adaptability across fashion, home décor, and cosmetic applications make it the preferred choice globally
Report Scope and Alpha Methyl-styrene Market Segmentation
|
Attributes |
Silk Key Market Insights |
|
Segments Covered |
|
|
Countries Covered |
Middle East and Africa
|
|
Key Market Players |
|
|
Market Opportunities |
|
|
Value Added Data Infosets |
In addition to the insights on market scenarios such as market value, growth rate, segmentation, geographical coverage, and major players, the market reports curated by the Data Bridge Market Research also include import export analysis, production capacity overview, production consumption analysis, price trend analysis, climate change scenario, supply chain analysis, value chain analysis, raw material/consumables overview, vendor selection criteria, PESTLE Analysis, Porter Analysis, and regulatory framework. |
Silk Market Trends
“Strong Government Backing for Domestic Silk Production Sector”
- As robust government backing in leading silk-producing nations such as India and China continue, the global silk market is witnessing significant growth driven by the recognition of sericulture’s socio-economic impact, particularly in rural employment and export contribution
- Strategic interventions like subsidies, R&D programs, technical training, and national silk boards are enhancing production quality, disease management, and market connectivity, leading to a more resilient and efficient silk supply chain
- In April 2025, India’s Silk Samagra-2 scheme supported integrated development through strengthened infrastructure, increased silkworm seed and planting material availability, and technological upgrades such as the installation of 42 Automatic Reeling Machines in Karnataka, boosting competitiveness and market access
- According to Fibre2Fashion in April 2025, mulberry silk remained the leading variety, accounting for over 75% of India’s production with 23,131 tons from April–December 2024, while Tasar (1,079 tons), Eri (6,217 tons), and Muga (187 tons) also contributed to a diversified production base
Silk Market Dynamics
Driver
“Growing Consumer Preference for Sustainable and Eco-Friendly Products”
- As environmentally conscious consumer behavior becomes mainstream, the global silk market is witnessing significant growth driven by a strong preference for sustainable and eco-friendly products, with increasing demand for natural, biodegradable, and ethically sourced materials influencing purchasing decisions worldwide
- This shift reflects a broader transformation in consumer priorities, where product selection is guided not only by quality and aesthetics but also by a holistic evaluation of environmental impact and ethical sourcing, making natural fibers like silk especially attractive to today’s responsible buyers
- In May 2025, Textile South Asia reported that Indian consumers are increasingly favoring biodegradable and natural fibers like silk, citing its lower environmental footprint and natural decomposition as key factors contributing to its growing demand
- A June 2025 article by Green Network Asia emphasized the role of eco-friendly textiles in reducing environmental damage within the fashion industry, implicitly supporting silk as a natural, sustainable option aligned with the goals of waste reduction and responsible sourcing
- In May 2025, Anuprerna highlighted how the demand for sustainable silk is being fueled by ethical concerns and environmental awareness, noting the rise of innovations like “Peace silk” and the increasing adoption of sustainable silk by high-end fashion brands, which is pushing investment and innovation in eco-conscious production methods
Restraint/Challenge
“Competition From Synthetic Fibres”
- A notable restraint in the global Silk (TSP) market is the allergenic nature of soy, which continues to limit consumer acceptance despite TSP's nutritional and functional benefits. Soy ranks among the top eight food allergens globally, and even minimal exposure can lead to allergic reactions, ranging from mild symptoms to severe anaphylaxis, particularly in infants and young children. This risk discourages many consumers and complicates product development for manufacturers aiming for mass-market appeal
- To mitigate these challenges, food producers are increasingly exploring alternative plant-based proteins such as pea, rice, and chickpea, which are generally considered less allergenic. These alternatives are often positioned as “allergen-free” or “clean-label,” appealing to health-conscious and sensitive consumers while allowing brands to tap into a broader, more inclusive market segment
- Strict regulatory frameworks requiring clear allergen labeling, particularly concerning soy, further influence consumer decisions. Although such transparency enhances food safety, it can also dissuade potential buyers from choosing soy-based products like TSP due to heightened awareness of allergen risks. This regulatory landscape places soy-derived ingredients at a relative disadvantage compared to more allergen-neutral options
- Despite its affordability, protein content, and sustainability profile, TSP faces a significant hurdle in gaining widespread market penetration due to concerns surrounding soy allergies. Until scientific advancements succeed in reducing the allergenic properties of soy, this limitation is expected to persist and influence product strategy across the industry
- For example, in November 2024, an article published by Elsevier Inc. highlighted a case of food-dependent exercise-induced anaphylaxis caused by hidden soy ingredients in processed foods, illustrating the difficulties consumers face in detecting allergens. Similarly, in December 2022, the Asthma and Allergy Foundation of America, via Kids with Food Allergies, emphasized the need for complete avoidance of soy in children with allergies, reinforcing the need for alternative ingredients in pediatric nutrition
- Overall, allergen concerns surrounding soy present a considerable restraint to the Silk market, prompting a shift among manufacturers toward hypoallergenic alternatives and driving innovation in allergen-free product development
Silk Market Scope
The market is segmented on the basis of type, product type, weight, ply, country of origin, material, production process, end-user, distribution channel.
- By Type
On the basis of type, the silk market is segmented into Mulberry Silk, Tasar Silk/Wild Silk, Eri Silk, Spider Silk, Muga Silk, Anaphe Silk, Fagara Silk, Coan Silk, Mussel Silk, Sea Silk, Silk Charmeuse (Silk Satin), Chiffon Silk (Crepe Chiffon), Silk Dupioni (Duppioni or Dupion), Silk Gauze, Fuji Silk, Silk Noil, Silk Shantung, Silk Organza, Silk Broadcloth, Silk Crepe, Habutai Silk / Habotai Silk, Silk Pongee, and Others. In 2025, the Mulberry Silk segment is expected to dominate the market with a market share of 46.15% It is expected to reach USD 454,017.41 thousand by 2032, growing with the highest CAGR of 9.0% in the forecast period of 2025 to 2032 due to its superior fiber quality, consistent availability, and widespread use in luxury apparel and textiles. Its compatibility with both traditional weaving and modern manufacturing techniques enhances its appeal across applications.
- By Product Type
On the basis of product type, the silk market is segmented into raw silk, silk yarns, and others. In 2025, the silk fabric segment is expected to dominate the market with a market share of 35.78% It is expected to reach USD 352,719.92 thousand by 2032, growing with the highest CAGR of 9.0% in the forecast period of 2025 to 2032.
By Weight
On the basis of weight, the silk market is segmented into light weight, medium weight, and heavy weight. In 2025, the light weight segment is expected to dominate the market with a market share of 54.26% It is expected to reach USD 497,512.37 thousand by 2032, growing with the highest CAGR of 7.9% in the forecast period of 2025 to 2032.owing to its versatility in garments and upholstery products where a balanced structure and drape are essential.
- By Ply
On the basis of ply, the silk market is segmented into 2 ply, 3 ply, 4 ply, and others. In 2025, 2ply segment is expected to dominate the market with a market share of 47.13% It is expected to reach USD 437,779.02 thousand by 2032, growing with the highest CAGR of 8.1% in the forecast period of 2025 to 2032 as it offers both durability and a refined finish, making it suitable for high-quality fashion products and formal wear.
- By Country of Origin
On the basis of country of origin, the silk market is segmented into Japan silk, Indian silk, Thailand silk, and others. In 2025, the china silk segment is expected to dominate the market with a market share of 61.72% It is expected to reach USD 572,185.62 thousand by 2032, growing with the highest CAGR of 8.1% in the forecast period of 2025 to 2032, supported by its vast variety, strong sericulture base, and extensive government support that enhances its production and export potential.
- By Material
On the basis of material, the silk market is segmented into pure silk, standard silk, and blended silk. The blended silk segment is further segmented into cotton silk, silk wool, and art silk. In 2025, the pure silk segment is expected to dominate the market with a market share of 73.67% It is expected to reach USD 669,619.42 thousand by 2032, growing with the highest CAGR of 7.8% in the forecast period of 2025 to 2032 due to its affordability, enhanced durability, and widespread use in mainstream and fashion applications.
- By Production Process
On the basis of production process, the silk market is segmented into cocoon production, reeling, throwing, weaving, dyeing, and others. In 2025, the cocoon production segment is expected to dominate the market with a market share of 50.20% It is expected to reach USD 471,473.43 thousand by 2032, growing with the highest CAGR of 8.3% in the forecast period of 2025 to 2032, driven by rising demand for high-quality finished textiles and innovations in loom technology that support complex fabric design and texture.
- By End-User
On the basis of end user, the silk market is segmented into textile, cosmetics, medical, and others. In 2025, the textile segment is expected to dominate the market with a market share of 77.63% It is expected to reach USD 706,472.10 thousand by 2032, growing with the highest CAGR of 7.8% in the forecast period of 2025 to 2032 due to rising global demand for luxury apparel, traditional garments, and sustainable fashion products.
- By Distribution Channel
On the basis of distribution channel, the silk market is segmented into offline and online. The offline segment is further categorized into supermarket, hypermarket, branded stores, and others. In 2025, the offline segment is expected to dominate the market with a market share of 68.96% It is expected to reach USD 617,204.23 thousand by 2032, growing with the highest CAGR of 7.5% in the forecast period of 2025 to 2032.due to consumer preference for physically inspecting silk fabrics, particularly for premium purchases in apparel and home textiles.
Silk Market Regional Analysis
- Middle East and Africa contributes the global Silk market with a revenue share of 3.14%in 2024, driven by the region’s deep-rooted sericulture traditions, abundant availability of skilled labor, and favorable climatic conditions for mulberry cultivation across countries such as China, India, Thailand, and Vietnam
- The region’s dominance is further supported by strong government initiatives promoting silk farming, reeling infrastructure, and export-oriented production, particularly in India and China, which together account for over 90% of global silk output. The widespread cultural and ceremonial use of silk fabrics in traditional garments also sustains consistent domestic demand
- Moreover, rising disposable incomes, expanding fashion and home textiles sectors, and increasing consumer preference for natural and sustainable fibers are propelling the adoption of silk across apparel, bedding, and personal care products. Strategic investments in advanced reeling, dyeing, and eco-friendly silk production technologies, coupled with export support policies, continue to strengthen Asia-Pacific’s leadership in the global silk market
Middle East and Africa Silk Market Insight
The Middle East and Africa silk market is expected to witness moderate growth during the forecast period, supported by rising disposable incomes, increasing demand for premium textiles, and a cultural affinity for silk in traditional garments and home décor. Countries such as the UAE, Saudi Arabia, and South Africa are showing growing interest in luxury and eco-conscious fashion, while high-net-worth consumer segments are driving demand for handcrafted and bespoke silk products. Additionally, regional textile manufacturers are exploring sustainable sourcing and silk-blend innovations to align with global fashion trends and diversify product offerings in both domestic and export markets.
- South Africa Silk Market Insight
The South Africa silk market is gradually expanding, driven by a rising appreciation for natural and premium textiles among urban consumers, coupled with a growing local fashion and design industry. The country's interest in artisanal craftsmanship and sustainable fashion is fostering demand for eco-friendly silk in both apparel and interior décor segments. Additionally, niche initiatives focused on indigenous silk production and government efforts to boost rural textile enterprises are laying the groundwork for long-term growth in the silk sector.
- Egypt Silk Market Insight
The Egypt silk market is witnessing renewed interest, supported by a rich historical association with fine textiles and increasing demand for luxury fabrics in traditional garments and modern fashion. Government initiatives to revive local sericulture and promote heritage crafts are contributing to the sector's development. Additionally, growing awareness of sustainable materials and tourism-driven interest in authentic Egyptian textiles are fostering the use of silk in apparel, souvenirs, and home furnishing segments.
The Major Market Leaders Operating in the Market Are:
- ERIS MIDDLE EAST AND AFRICA LLP (India)
Latest Developments in Middle East And Africa Silk Market
- In January 2025, LILYSILK opened its first concept store in New York City, marking a key retail expansion. This move enhances brand visibility and customer engagement through a luxury, sustainable shopping experience. The store also supports eco-friendly initiatives, reinforcing the company’s commitment to sustainability
- In Feburary 2025, Bolt Threads and Goddess Maintenance Co. have announced a USD 4 million annual partnership to integrate Bolt’s b-silk technology into a new biotech-powered beauty line. Launching Spring 2025 across 1,300+ U.S. retail locations via Sally Beauty, this collaboration marks a major milestone for sustainable, science-driven skincare, reinforcing Bolt’s position in the clean beauty market and expanding its reach
- In January 2024, Wensli Group was recognized as a national demonstration base for cultural and technological integration by China's Ministry of Industry and Information Technology and other governmental bodies. This acknowledgment highlighted Wensli's innovative use of Artificial Intelligence (AI) in silk design and production. The company's AI-driven design system, developed in collaboration with Wujie AI, boasts a database of over 500,000 patterns and more than 300 AI imaging algorithms. This system enables the creation of up to 100,000 unique silk scarf designs, facilitating rapid customization and efficient production. Additionally, Wensli has implemented eco-friendly digital machines that eliminate water usage in printing and dyeing processes, addressing environmental concerns in textile manufacturing
- In August 2024, Wensli Group held the "Trendy Olympics: A Century of Silk Scarves" exhibition at Hangzhou Tower Shopping Center. This cultural event celebrated the Olympic spirit through silk artistry, blending modern design with traditional Chinese craftsmanship. It strengthened Wensli’s brand visibility, supported international cultural exchange, and showcased the company's innovation in themed product design, helping expand its global and domestic reach
- In October 2024, Bolt Projects Holdings expands its Vegan Silk Technology Platform with new product launches featuring b-silk, including Freaks of Nature sunscreens and upcoming color cosmetics. The company also teases the debut of xl-silk, its second proprietary ingredient. With more brand partnerships ahead, Bolt positions 2025 as a breakout year for sustainable, high-performance beauty innovation across haircare, skincare, and cosmetics
SKU-

- Interactive Data Analysis Dashboard
- Company Analysis Dashboard for high growth potential opportunities
- Research Analyst Access for customization & queries
- Competitor Analysis with Interactive dashboard
- Latest News, Updates & Trend analysis
- Harness the Power of Benchmark Analysis for Comprehensive Competitor Tracking
Table of Content
1 INTRODUCTION
1.1 OBJECTIVES OF THE STUDY
1.2 MARKET DEFINITION
1.3 OVERVIEW
1.4 LIMITATIONS
1.5 MARKETS COVERED
2 MARKET SEGMENTATION
2.1 MARKETS COVERED
2.2 GEOGRAPHICAL SCOPE
2.3 YEARS CONSIDERED FOR THE STUDY
2.4 CURRENCY AND PRICING
2.5 DBMR TRIPOD DATA VALIDATION MODEL
2.6 MULTIVARIATE MODELING
2.7 PRIMARY INTERVIEWS WITH KEY OPINION LEADERS
2.8 DBMR MARKET POSITION GRID
2.9 DBMR VENDOR SHARE ANALYSIS
2.1 SECONDARY SOURCES
2.11 ASSUMPTIONS
3 EXECUTIVE SUMMARY
4 PREMIUM INSIGHTS
4.1 PORTER’S FIVE FORCES ANALYSIS
4.1.1 THREAT OF NEW ENTRANTS
4.1.2 BARGAINING POWER OF SUPPLIERS
4.1.3 BARGAINING POWER OF BUYERS
4.1.4 THREAT OF SUBSTITUTES
4.1.5 INTERNAL COMPETITION
4.2 CONSUMER BEHAVIOR ANALYSIS OF THE MIDDLE EAST AND AFRICA SILK MARKET
4.3 IMPACT OF THE COVID-19 PANDEMIC ON THE MIDDLE EAST AND AFRICA SILK MARKET
5 REGULATION COVERAGE
6 MARKET OVERVIEW
6.1 DRIVERS
6.1.1 HIGH GOVERNMENT SUPPORT FOR DOMESTIC SILK PRODUCTION INDUSTRY
6.1.2 EXPANSION INTO EMERGING MARKETS & GROWING DISPOSABLE INCOME
6.1.3 TECHNOLOGICAL ADVANCEMENT IN SERICULTURE & PROCESSING
6.1.4 GROWING CONSUMER PREFERENCE FOR SUSTAINABLE AND ECO-FRIENDLY PRODUCTS
6.2 RESTRAINTS
6.2.1 COMPETITION FROM SYNTHETIC FIBRES
6.2.2 TRADE BARRIERS BETWEEN NATIONS
6.3 OPPORTUNITIES
6.3.1 GROWING ADOPTION OF SILK IN NON-TEXTILE APPLICATIONS
6.3.2 ADOPTION OF SILK IN FUNCTIONAL AND SMART TEXTILES
6.3.3 RISING DISPOSABLE INCOME DRIVING DEMAND FOR HOME FURNISHINGS AND DECOR
6.4 CHALLENGES
6.4.1 HIGH PRODUCTION COSTS AND LABOR-INTENSIVE SERICULTURE
6.4.2 VULNERABILITY TO CLIMATIC CONDITIONS AND DISEASE OUTBREAKS IN SILKWORMS
7 MIDDLE EAST AND AFRICA SILK MARKET, BY TYPE
7.1 OVERVIEW
7.2 MULBERRY SILK
7.3 TASAR SILK/WILD SILK
7.4 ERI SILK
7.5 MUGA SILK
7.6 SPIDER SILK
7.7 ANAPHE SILK
7.8 FAGARA SILK
7.9 COAN SILK
7.1 MUSSEL SILK
7.11 SEA SILK
7.12 SILK CHARMEUSE ( SILK SATIN)
7.13 CHIFFON SILK (CREPE CHIFFON)
7.14 SILK DUPIONI ( DUPPIONI OR DUPION)
7.15 SILK GAUZE
7.16 FUJI SILK
7.17 SILK NOIL
7.18 SILK SHANTUNG
7.19 SILK ORGANZA
7.2 SILK BROADCLOTH
7.21 SILK CREPE
7.22 HABUTAI SILK / HABOTAI SILK
7.23 SILK PONGEE
7.24 OTHERS
8 MIDDLE EAST AND AFRICA SILK MARKET, BY PRODUCT TYPE
8.1 OVERVIEW
8.2 SILK FABRIC
8.3 RAW SILK
8.4 SILK YARNS
8.5 SILK WASTE
8.6 SILK BLENDS
8.7 DEGUMMED SILK
8.8 OTHERS
9 MIDDLE EAST AND AFRICA SILK MARKET, BY WEIGHT
9.1 OVERVIEW
9.2 LIGHT WEIGHT
9.3 MEDIUM WEIGHT
9.4 HEAVY WEIGHT
10 MIDDLE EAST AND AFRICA SILK MARKET, BY PLY
10.1 OVERVIEW
10.2 2 PLY
10.3 4 PLY
10.4 3 PLY
10.5 OTHERS
11 MIDDLE EAST AND AFRICA SILK MARKET, BY COUNTRY OF ORIGIN
11.1 OVERVIEW
11.2 CHINA SILK
11.3 INDIAN SILK
11.3.1 INDIAN SILK, BY TYPE
11.3.2 TUSSAH/TUSSAR, BY TYPE
11.4 JAPAN SILK
11.4.1 JAPAN SILK, BY TYPE
11.5 IRAN SILK
11.6 THAILAND SILK
11.6.1 THAILAND SILK, BY TYPE
11.7 OTHERS
12 MIDDLE EAST AND AFRICA SILK MARKET, BY MATERIAL
12.1 OVERVIEW
12.2 PURE SILK
12.3 BLENDED SILK
12.3.1 BLENDED SILK, BY TYPE
12.4 STANDARD SILK
13 MIDDLE EAST AND AFRICA SILK MARKET, BY PRODUCTION PROCESS
13.1 OVERVIEW
13.2 COCOON PRODUCTION
13.3 REELING
13.4 WEAVING
13.5 DYEING
13.6 THROWING
13.7 OTHERS
14 MIDDLE EAST AND AFRICA SILK MARKET, BY END-USER
14.1 OVERVIEW
14.2 TEXTILE
14.2.1 TEXTILE, BY END-USE
14.2.2 CLOTHING, BY TYPE
14.2.3 TEXTILE, BY TYPE
14.3 MEDICAL
14.3.1 MEDICAL, BY TYPE
14.4 OTHERS
14.4.1 OTHERS, BY TYPE
15 MIDDLE EAST AND AFRICA SILK MARKET, BY DISTRIBUTION CHANNEL
15.1 OVERVIEW
15.2 OFFLINE
15.2.1 OFFLINE, BY TYPE
15.3 ONLINE
16 MIDDLE EAST AND AFRICA SILK MARKET, BY REGION
16.1 MIDDLE EAST AND AFRICA
16.1.1 SOUTH AFRICA
16.1.2 EGYPT
16.1.3 SAUDI ARABIA
16.1.4 UAE
16.1.5 ISRAEL
16.1.6 REST OF MIDDLE EAST & AFRICA
17 MIDDLE EAST AND AFRICA SILK MARKET: COMPANY LANDSCAPE
17.1 COMPANY SHARE ANALYSIS: MIDDLE EAST AND AFRICA
18 SWOT ANALYSIS
19 COMPANY PROFILES
19.1 STARLING SILK MILLS PVT. LTD.
19.1.1 COMPANY SNAPSHOT
19.1.2 COMPANY SHARE ANALYSIS
19.1.3 PRODUCT PORTFOLIO
19.1.4 RECENT UPDATES
19.2 WENSLI
19.2.1 COMPANY SNAPSHOT
19.2.2 REVENUE ANALYSIS
19.2.3 COMPANY SHARE ANALYSIS
19.2.4 PRODUCT PORTFOLIO
19.2.5 RECENT DEVELOPMENTS/NEWS
19.3 SHENGKUN SILK MANUFACTURING CO., LTD
19.3.1 COMPANY SNAPSHOT
19.3.2 COMPANY SHARE ANALYSIS
19.3.3 PRODUCT PORTFOLIO
19.3.4 RECENT UPDATES
19.4 BOLT THREADS
19.4.1 COMPANY SNAPSHOT
19.4.2 REVENUE ANALYSIS
19.4.3 COMPANY SHARE ANALYSIS
19.4.4 PRODUCT PORTFOLIO
19.4.5 RECENT DEVELOPMENT
19.5 LILYSILK
19.5.1 COMPANY SNAPSHOT
19.5.2 COMPANY SHARE ANALYSIS
19.5.3 PRODUCT PORTFOLIO
19.5.4 RECENT DEVELOPMENTS/NEWS
19.6 ALASHAN CASHMERE AND SILK
19.6.1 COMPANY SNAPSHOT
19.6.2 PRODUCT PORTFOLIO
19.6.3 RECENT DEVELOPMENTS/NEWS
19.7 AMSILK GMBH
19.7.1 COMPANY SNAPSHOT
19.7.2 PRODUCT PORTFOLIO
19.7.3 RECENT DEVELOPMENT
19.8 ANHUI SILK CO. LTD.
19.8.1 COMPANY SNAPSHOT
19.8.2 PRODUCT PORTFOLIO
19.8.3 RECENT DEVELOPMENT
19.9 ARUN YARNS
19.9.1 COMPANY SNAPSHOT
19.9.2 PRODUCT PORTFOLIO
19.9.3 RECENT DEVELOPMENTS/NEWS
19.1 CHINA NATIONAL SILK GROUP CO., LTD.
19.10.1 COMPANY SNAPSHOT
19.10.2 PRODUCT PORTFOLIO
19.10.3 RECENT UPDATES
19.11 ERIS MIDDLE EAST AND AFRICA LLP
19.11.1 COMPANY SNAPSHOT
19.11.2 PRODUCT PORTFOLIO
19.11.3 RECENT DEVELOPMENTS/NEWS
19.12 FISHERS FINERY
19.12.1 COMPANY SNAPSHOT
19.12.2 PRODUCT PORTFOLIO
19.12.3 RECENT DEVELOPMENTS
19.13 GARIMA SILKS.
19.13.1 COMPANY SNAPSHOT
19.13.2 PRODUCT PORTFOLIO
19.13.3 RECENT DEVELOPMENTS/NEWS
19.14 JINCHENGJIANG XINXING SILK CO., LTD
19.14.1 COMPANY SNAPSHOT
19.14.2 PRODUCT PORTFOLIO
19.14.3 RECENT DEVELOPMENTS/NEWS
19.15 KRAIG BIOCRAFT LABORATORIES, INC.
19.15.1 COMPANY SNAPSHOT
19.15.2 PRODUCT PORTFOLIO
19.15.3 RECENT DEVELOPMENT
19.16 M. JIJU SILK MILLS
19.16.1 COMPANY SNAPSHOT
19.16.2 PRODUCT PORTFOLIO
19.16.3 RECENT DEVELOPMENTS/NEWS
19.17 NISHA SILK EXPORTS.
19.17.1 COMPANY SNAPSHOT
19.17.2 PRODUCT PORTFOLIO
19.17.3 RECENT DEVELOPMENTS/NEWS
19.18 ORIENT GROUP
19.18.1 COMPANY SNAPSHOT
19.18.2 PRODUCT PORTFOLIO
19.18.3 RECENT DEVELOPMENT
19.19 PRATHAM SILKS
19.19.1 COMPANY SNAPSHOT
19.19.2 PRODUCT PORTFOLIO
19.19.3 RECENT DEVELOPMENTS/NEWS
19.2 SICHUAN NANCHONG LIUHE (GROUP) CO., LTD
19.20.1 COMPANY SNAPSHOT
19.20.2 PRODUCT PORTFOLIO
19.20.3 RECENT DEVELOPMENT
19.21 SPIBER TECHNOLOGIES
19.21.1 COMPANY SNAPSHOT
19.21.2 PRODUCT PORTFOLIO
19.21.3 RECENT DEVELOPMENT
19.22 UNNATI SILKS
19.22.1 COMPANY SNAPSHOT
19.22.2 PRODUCT PORTFOLIO
19.22.3 RECENT DEVELOPMENTS/NEWS
19.23 WUJIANG FIRST TEXTILE CO. LTD.
19.23.1 COMPANY SNAPSHOT
19.23.2 PRODUCT PORTFOLIO
19.23.3 RECENT DEVELOPMENT
19.24 ZHEJIANG JIAXIN SILK CORP., LTD.
19.24.1 COMPANY SNAPSHOT
19.24.2 PRODUCT PORTFOLIO
19.24.3 RECENT DEVELOPMENT
20 QUESTIONNAIRE
21 RELATED REPORTS
List of Table
TABLE 1 REGULATORY COVERAGE
TABLE 2 MIDDLE EAST AND AFRICA SILK MARKET, BY TYPE, 2018-2032 (USD THOUSAND)
TABLE 3 MIDDLE EAST AND AFRICA SILK MARKET, BY TYPE, 2018-2032 (THOUSAND METER)
TABLE 4 MIDDLE EAST AND AFRICA MULBERRY SILK IN SILK MARKET, BY REGION, 2018-2032 (USD THOUSAND)
TABLE 5 MIDDLE EAST AND AFRICA TASAR SILK/WILD SILK IN SILK MARKET, BY REGION, 2018-2032 (USD THOUSAND)
TABLE 6 MIDDLE EAST AND AFRICA ERI SILK IN SILK MARKET, BY REGION, 2018-2032 (USD THOUSAND)
TABLE 7 MIDDLE EAST AND AFRICA MUGA SILK IN SILK MARKET, BY REGION, 2018-2032 (USD THOUSAND)
TABLE 8 MIDDLE EAST AND AFRICA SPIDER SILK IN SILK MARKET, BY REGION, 2018-2032 (USD THOUSAND)
TABLE 9 MIDDLE EAST AND AFRICA ANAPHE SILK IN SILK MARKET, BY REGION, 2018-2032 (USD THOUSAND)
TABLE 10 MIDDLE EAST AND AFRICA FAGARA SILK IN SILK MARKET, BY REGION, 2018-2032 (USD THOUSAND)
TABLE 11 MIDDLE EAST AND AFRICA COAN SILK IN SILK MARKET, BY REGION, 2018-2032 (USD THOUSAND)
TABLE 12 MIDDLE EAST AND AFRICA MUSSEL SILK IN SILK MARKET, BY REGION, 2018-2032 (USD THOUSAND)
TABLE 13 MIDDLE EAST AND AFRICA SEA SILK IN SILK MARKET, BY REGION, 2018-2032 (USD THOUSAND)
TABLE 14 MIDDLE EAST AND AFRICA SILK CHARMEUSE (SILK SATIN) IN SILK MARKET, BY REGION, 2018-2032 (USD THOUSAND)
TABLE 15 MIDDLE EAST AND AFRICA CHIFFON SILK (CREPE CHIFFON) IN SILK MARKET, BY REGION, 2018-2032 (USD THOUSAND)
TABLE 16 MIDDLE EAST AND AFRICA SILK DUPIONI ( DUPPIONI OR DUPION) IN SILK MARKET, BY REGION, 2018-2032 (USD THOUSAND)
TABLE 17 MIDDLE EAST AND AFRICA SILK GAUZE IN SILK MARKET, BY REGION, 2018-2032 (USD THOUSAND)
TABLE 18 MIDDLE EAST AND AFRICA FUJI SILK IN SILK MARKET, BY REGION, 2018-2032 (USD THOUSAND)
TABLE 19 MIDDLE EAST AND AFRICA SILK NOIL IN SILK MARKET, BY REGION, 2018-2032 (USD THOUSAND)
TABLE 20 MIDDLE EAST AND AFRICA SILK SHANTUNG IN SILK MARKET, BY REGION, 2018-2032 (USD THOUSAND)
TABLE 21 MIDDLE EAST AND AFRICA SILK ORGANZA IN SILK MARKET, BY REGION, 2018-2032 (USD THOUSAND)
TABLE 22 MIDDLE EAST AND AFRICA SILK BROADCLOTH IN SILK MARKET, BY REGION, 2018-2032 (USD THOUSAND)
TABLE 23 MIDDLE EAST AND AFRICA SILK CREPE IN SILK MARKET, BY REGION, 2018-2032 (USD THOUSAND)
TABLE 24 MIDDLE EAST AND AFRICA HABUTAI SILK / HABOTAI SILK IN SILK MARKET, BY REGION, 2018-2032 (USD THOUSAND)
TABLE 25 MIDDLE EAST AND AFRICA SILK PONGEE IN SILK MARKET, BY REGION, 2018-2032 (USD THOUSAND)
TABLE 26 MIDDLE EAST AND AFRICA OTHERS IN SILK MARKET, BY REGION, 2018-2032 (USD THOUSAND)
TABLE 27 MIDDLE EAST AND AFRICA SILK MARKET, BY PRODUCT TYPE, 2018-2032 (USD THOUSAND)
TABLE 28 MIDDLE EAST AND AFRICA SILK FABRIC IN SILK MARKET, BY REGION, 2018-2032 (USD THOUSAND)
TABLE 29 MIDDLE EAST AND AFRICA RAW SILK IN SILK MARKET, BY REGION, 2018-2032 (USD THOUSAND)
TABLE 30 MIDDLE EAST AND AFRICA SILK YARNS IN SILK MARKET, BY REGION, 2018-2032 (USD THOUSAND)
TABLE 31 MIDDLE EAST AND AFRICA SILK WASTE IN SILK MARKET, BY REGION, 2018-2032 (USD THOUSAND)
TABLE 32 MIDDLE EAST AND AFRICA SILK BLENDS IN SILK MARKET, BY REGION, 2018-2032 (USD THOUSAND)
TABLE 33 MIDDLE EAST AND AFRICA DEGUMMED SILK IN SILK MARKET, BY REGION, 2018-2032 (USD THOUSAND)
TABLE 34 MIDDLE EAST AND AFRICA OTHERS IN SILK MARKET, BY REGION, 2018-2032 (USD THOUSAND)
TABLE 35 MIDDLE EAST AND AFRICA SILK MARKET, BY WEIGHT, 2018-2032 (USD THOUSAND)
TABLE 36 MIDDLE EAST AND AFRICA LIGHT WEIGHT IN SILK MARKET, BY REGION, 2018-2032 (USD THOUSAND)
TABLE 37 MIDDLE EAST AND AFRICA MEDIUM WEIGHT IN SILK MARKET, BY REGION, 2018-2032 (USD THOUSAND)
TABLE 38 MIDDLE EAST AND AFRICA HEAVY WEIGHT IN SILK MARKET, BY REGION, 2018-2032 (USD THOUSAND)
TABLE 39 MIDDLE EAST AND AFRICA SILK MARKET, BY PLY, 2018-2032 (USD THOUSAND)
TABLE 40 MIDDLE EAST AND AFRICA 2 PLY IN SILK MARKET, BY REGION, 2018-2032 (USD)
TABLE 41 MIDDLE EAST AND AFRICA 4 PLY IN SILK MARKET, BY REGION, 2018-2032 (USD)
TABLE 42 MIDDLE EAST AND AFRICA 3 PLY IN SILK MARKET, BY REGION, 2018-2032 (USD)
TABLE 43 MIDDLE EAST AND AFRICA OTHERS IN SILK MARKET, BY REGION, 2018-2032 (USD)
TABLE 44 MIDDLE EAST AND AFRICA SILK MARKET, BY COUNTRY OF ORIGIN, 2018-2032 (USD THOUSAND)
TABLE 45 MIDDLE EAST AND AFRICA CHINA SILK IN SILK MARKET, BY REGION, 2018-2032 (USD THOUSAND)
TABLE 46 MIDDLE EAST AND AFRICA INDIAN SILK IN SILK MARKET, BY REGION, 2018-2032 (USD THOUSAND)
TABLE 47 MIDDLE EAST AND AFRICA INDIAN SILK IN SILK MARKET, BY TYPE, 2018-2032 (USD THOUSAND)
TABLE 48 MIDDLE EAST AND AFRICA TUSSAH/TUSSAR IN SILK MARKET, BY TYPE, 2018-2032 (USD THOUSAND)
TABLE 49 MIDDLE EAST AND AFRICA JAPAN SILK IN SILK MARKET, BY REGION, 2018-2032 (USD THOUSAND)
TABLE 50 MIDDLE EAST AND AFRICA JAPAN SILK IN SILK MARKET, BY TYPE, 2018-2032 (USD THOUSAND)
TABLE 51 MIDDLE EAST AND AFRICA IRAN SILK IN SILK MARKET, BY REGION, 2018-2032 (USD THOUSAND)
TABLE 52 MIDDLE EAST AND AFRICA THAILAND SILK IN SILK MARKET, BY REGION, 2018-2032 (USD THOUSAND)
TABLE 53 MIDDLE EAST AND AFRICA THAILAND SILK IN SILK MARKET, BY TYPE, 2018-2032 (USD THOUSAND)
TABLE 54 MIDDLE EAST AND AFRICA OTHERS IN SILK MARKET, BY REGION, 2018-2032 (USD THOUSAND)
TABLE 55 MIDDLE EAST AND AFRICA SILK MARKET, BY MATERIAL, 2018-2032 (USD THOUSAND)
TABLE 56 MIDDLE EAST AND AFRICA PURE SILK IN SILK MARKET, BY REGION, 2018-2032 (USD THOUSAND)
TABLE 57 MIDDLE EAST AND AFRICA BLENDED SILK IN SILK MARKET, BY REGION, 2018-2032 (USD THOUSAND)
TABLE 58 MIDDLE EAST AND AFRICA BLENDED SILK IN SILK MARKET, BY TYPE, 2018-2032 (USD THOUSAND)
TABLE 59 MIDDLE EAST AND AFRICA STANDARD SILK IN SILK MARKET, BY REGION, 2018-2032 (USD THOUSAND)
TABLE 60 MIDDLE EAST AND AFRICA SILK MARKET BY PRODUCTION PROCESS, 2018-2032 (USD THOUSAND)
TABLE 61 MIDDLE EAST AND AFRICA COCOON PRODUCTION IN SILK MARKET, BY REGION, 2018-2032 (USD THOUSAND)
TABLE 62 MIDDLE EAST AND AFRICA REELING IN SILK MARKET, BY REGION, 2018-2032 (USD THOUSAND)
TABLE 63 MIDDLE EAST AND AFRICA WEAVING IN SILK MARKET, BY REGION, 2018-2032 (USD THOUSAND)
TABLE 64 MIDDLE EAST AND AFRICA DYEING IN SILK MARKET, BY REGION, 2018-2032 (USD THOUSAND)
TABLE 65 MIDDLE EAST AND AFRICA THROWING IN SILK MARKET, BY REGION, 2018-2032 (USD THOUSAND)
TABLE 66 MIDDLE EAST AND AFRICA OTHERS IN SILK MARKET, BY REGION, 2018-2032 (USD THOUSAND)
TABLE 67 MIDDLE EAST AND AFRICA SILK MARKET, BY END-USER, 2018-2032 (USD THOUSAND)
TABLE 68 MIDDLE EAST AND AFRICA TEXTILE IN SILK MARKET, BY REGION, 2018-2032 (USD THOUSAND)
TABLE 69 MIDDLE EAST AND AFRICA TEXTILE IN SILK MARKET, BY TYPE, 2018-2032 (USD THOUSAND)
TABLE 70 MIDDLE EAST AND AFRICA CLOTHING IN SILK MARKET, BY TYPE, 2018-2032 (USD THOUSAND)
TABLE 71 MIDDLE EAST AND AFRICA TEXTILE IN SILK MARKET, BY TYPE, 2018-2032 (USD THOUSAND)
TABLE 72 MIDDLE EAST AND AFRICA TEXTILE IN SILK MARKET, BY REGION, 2018-2032 (USD THOUSAND)
TABLE 73 MIDDLE EAST AND AFRICA MEDICAL IN SILK MARKET, BY TYPE, 2018-2032 (USD THOUSAND)
TABLE 74 MIDDLE EAST AND AFRICA OTHERS IN SILK MARKET, BY REGION, 2018-2032 (USD THOUSAND)
TABLE 75 MIDDLE EAST AND AFRICA OTHERS IN SILK MARKET, BY TYPE, 2018-2032 (USD THOUSAND)
TABLE 76 MIDDLE EAST AND AFRICA SILK MARKET BY DISTRIBUTION CHANNEL, 2018-2032 (USD THOUSAND)
TABLE 77 MIDDLE EAST AND AFRICA OFFLINE IN SILK MARKET, BY REGION, 2018-2032 (USD THOUSAND)
TABLE 78 MIDDLE EAST AND AFRICA OFFLINE IN SILK MARKET, BY TYPE, 2018-2032 (USD THOUSAND)
TABLE 79 MIDDLE EAST AND AFRICA ONLINE IN SILK MARKET, BY REGION, 2018-2032 (USD THOUSAND)
TABLE 80 MIDDLE EAST AND AFRICA SILK MARKET, BY COUNTRY, 2018-2032 (USD THOUSAND)
TABLE 81 MIDDLE EAST AND AFRICA SILK MARKET, BY COUNTRY, 2018-2032 (THOUSAND METER)
TABLE 82 MIDDLE EAST & AFRICA SILK MARKET, BY TYPE, 2018-2032 (USD THOUSAND)
TABLE 83 MIDDLE EAST & AFRICA SILK MARKET, BY TYPE, 2018-2032 (THOUSAND METER)
TABLE 84 MIDDLE EAST & AFRICA SILK MARKET, BY PRODUCT TYPE, 2018-2032 (USD THOUSAND)
TABLE 85 MIDDLE EAST & AFRICA SILK MARKET, BY WEIGHT, 2018-2032 (USD THOUSAND)
TABLE 86 MIDDLE EAST & AFRICA SILK MARKET, BY PLY, 2018-2032 (USD THOUSAND)
TABLE 87 MIDDLE EAST & AFRICA SILK MARKET, BY COUNTRY OF ORIGIN, 2018-2032 (USD THOUSAND)
TABLE 88 MIDDLE EAST & AFRICA INDIAN SILK IN SILK MARKET, BY TYPE, 2018-2032 (USD THOUSAND)
TABLE 89 MIDDLE EAST & AFRICA TUSSAH/TUSSAR IN SILK MARKET BY TYPE, 2018-2032 (USD THOUSAND)
TABLE 90 MIDDLE EAST & AFRICA JAPAN SILK IN SILK MARKET, BY TYPE, 2018-2032 (USD THOUSAND)
TABLE 91 MIDDLE EAST & AFRICA THAILAND SILK IN SILK MARKET, BY TYPE, 2018-2032 (USD THOUSAND)
TABLE 92 MIDDLE EAST & AFRICA SILK MARKET, BY MATERIAL, 2018-2032 (USD THOUSAND)
TABLE 93 MIDDLE EAST & AFRICA BLENDED SILK IN SILK MARKET, BY TYPE, 2018-2032 (USD THOUSAND)
TABLE 94 MIDDLE EAST & AFRICA SILK MARKET, BY PRODUCTION PROCESS, 2018-2032 (USD THOUSAND)
TABLE 95 MIDDLE EAST & AFRICA SILK MARKET, BY END-USER, 2018-2032 (USD THOUSAND)
TABLE 96 MIDDLE EAST & AFRICA TEXTILE IN SILK MARKET, BY END-USER, 2018-2032 (USD THOUSAND)
TABLE 97 MIDDLE EAST & AFRICA CLOTHING IN SILK MARKET, BY TYPE, 2018-2032 (USD THOUSAND)
TABLE 98 MIDDLE EAST & AFRICA TEXTILE IN SILK MARKET, BY TYPE, 2018-2032 (USD THOUSAND)
TABLE 99 MIDDLE EAST & AFRICA MEDICAL IN SILK MARKET, BY TYPE, 2018-2032 (USD THOUSAND)
TABLE 100 MIDDLE EAST & AFRICA OTHERS IN SILK MARKET, BY TYPE, 2018-2032 (USD THOUSAND)
TABLE 101 MIDDLE EAST & AFRICA SILK MARKET, BY DISTRIBUTION CHANNEL, 2018-2032 (USD THOUSAND)
TABLE 102 MIDDLE EAST & AFRICA OFFLINE IN SILK MARKET, BY TYPE, 2018-2032 (USD THOUSAND)
TABLE 103 SOUTH AFRICA SILK MARKET, BY TYPE, 2018-2032 (USD THOUSAND)
TABLE 104 SOUTH AFRICA SILK MARKET, BY TYPE, 2018-2032 (THOUSAND METER)
TABLE 105 SOUTH AFRICA SILK MARKET, BY PRODUCT TYPE, 2018-2032 (USD THOUSAND)
TABLE 106 SOUTH AFRICA SILK MARKET, BY WEIGHT, 2018-2032 (USD THOUSAND)
TABLE 107 SOUTH AFRICA SILK MARKET, BY PLY, 2018-2032 (USD THOUSAND)
TABLE 108 SOUTH AFRICA SILK MARKET, BY COUNTRY OF ORIGIN, 2018-2032 (USD THOUSAND)
TABLE 109 SOUTH AFRICA INDIAN SILK IN SILK MARKET, BY TYPE, 2018-2032 (USD THOUSAND)
TABLE 110 SOUTH AFRICA TUSSAH/TUSSAR IN SILK MARKET BY TYPE, 2018-2032 (USD THOUSAND)
TABLE 111 SOUTH AFRICA JAPAN SILK IN SILK MARKET, BY TYPE, 2018-2032 (USD THOUSAND)
TABLE 112 SOUTH AFRICA THAILAND SILK IN SILK MARKET, BY TYPE, 2018-2032 (USD THOUSAND)
TABLE 113 SOUTH AFRICA SILK MARKET, BY MATERIAL, 2018-2032 (USD THOUSAND)
TABLE 114 SOUTH AFRICA BLENDED SILK IN SILK MARKET, BY TYPE, 2018-2032 (USD THOUSAND)
TABLE 115 SOUTH AFRICA SILK MARKET, BY PRODUCTION PROCESS, 2018-2032 (USD THOUSAND)
TABLE 116 SOUTH AFRICA SILK MARKET, BY END-USER, 2018-2032 (USD THOUSAND)
TABLE 117 SOUTH AFRICA TEXTILE IN SILK MARKET, BY END-USER, 2018-2032 (USD THOUSAND)
TABLE 118 SOUTH AFRICA CLOTHING IN SILK MARKET, BY TYPE, 2018-2032 (USD THOUSAND)
TABLE 119 SOUTH AFRICA TEXTILE IN SILK MARKET, BY TYPE, 2018-2032 (USD THOUSAND)
TABLE 120 SOUTH AFRICA MEDICAL IN SILK MARKET, BY TYPE, 2018-2032 (USD THOUSAND)
TABLE 121 SOUTH AFRICA OTHERS IN SILK MARKET, BY TYPE, 2018-2032 (USD THOUSAND)
TABLE 122 SOUTH AFRICA SILK MARKET, BY DISTRIBUTION CHANNEL, 2018-2032 (USD THOUSAND)
TABLE 123 SOUTH AFRICA OFFLINE IN SILK MARKET, BY TYPE, 2018-2032 (USD THOUSAND)
TABLE 124 EGYPT SILK MARKET, BY TYPE, 2018-2032 (USD THOUSAND)
TABLE 125 EGYPT SILK MARKET, BY TYPE, 2018-2032 (THOUSAND METER)
TABLE 126 EGYPT SILK MARKET, BY PRODUCT TYPE, 2018-2032 (USD THOUSAND)
TABLE 127 EGYPT SILK MARKET, BY WEIGHT, 2018-2032 (USD THOUSAND)
TABLE 128 EGYPT SILK MARKET, BY PLY, 2018-2032 (USD THOUSAND)
TABLE 129 EGYPT SILK MARKET, BY COUNTRY OF ORIGIN, 2018-2032 (USD THOUSAND)
TABLE 130 EGYPT INDIAN SILK IN SILK MARKET, BY TYPE, 2018-2032 (USD THOUSAND)
TABLE 131 EGYPT TUSSAH/TUSSAR IN SILK MARKET BY TYPE, 2018-2032 (USD THOUSAND)
TABLE 132 EGYPT JAPAN SILK IN SILK MARKET, BY TYPE, 2018-2032 (USD THOUSAND)
TABLE 133 EGYPT THAILAND SILK IN SILK MARKET, BY TYPE, 2018-2032 (USD THOUSAND)
TABLE 134 EGYPT SILK MARKET, BY MATERIAL, 2018-2032 (USD THOUSAND)
TABLE 135 EGYPT BLENDED SILK IN SILK MARKET, BY TYPE, 2018-2032 (USD THOUSAND)
TABLE 136 EGYPT SILK MARKET, BY PRODUCTION PROCESS, 2018-2032 (USD THOUSAND)
TABLE 137 EGYPT SILK MARKET, BY END-USER, 2018-2032 (USD THOUSAND)
TABLE 138 EGYPT TEXTILE IN SILK MARKET, BY END-USER, 2018-2032 (USD THOUSAND)
TABLE 139 EGYPT CLOTHING IN SILK MARKET, BY TYPE, 2018-2032 (USD THOUSAND)
TABLE 140 EGYPT TEXTILE IN SILK MARKET, BY TYPE, 2018-2032 (USD THOUSAND)
TABLE 141 EGYPT MEDICAL IN SILK MARKET, BY TYPE, 2018-2032 (USD THOUSAND)
TABLE 142 EGYPT OTHERS IN SILK MARKET, BY TYPE, 2018-2032 (USD THOUSAND)
TABLE 143 EGYPT SILK MARKET, BY DISTRIBUTION CHANNEL, 2018-2032 (USD THOUSAND)
TABLE 144 EGYPT OFFLINE IN SILK MARKET, BY TYPE, 2018-2032 (USD THOUSAND)
TABLE 145 SAUDI ARABIA SILK MARKET, BY TYPE, 2018-2032 (USD THOUSAND)
TABLE 146 SAUDI ARABIA SILK MARKET, BY TYPE, 2018-2032 (THOUSAND METER)
TABLE 147 SAUDI ARABIA SILK MARKET, BY PRODUCT TYPE, 2018-2032 (USD THOUSAND)
TABLE 148 SAUDI ARABIA SILK MARKET, BY WEIGHT, 2018-2032 (USD THOUSAND)
TABLE 149 SAUDI ARABIA SILK MARKET, BY PLY, 2018-2032 (USD THOUSAND)
TABLE 150 SAUDI ARABIA SILK MARKET, BY COUNTRY OF ORIGIN, 2018-2032 (USD THOUSAND)
TABLE 151 SAUDI ARABIA INDIAN SILK IN SILK MARKET, BY TYPE, 2018-2032 (USD THOUSAND)
TABLE 152 SAUDI ARABIA TUSSAH/TUSSAR IN SILK MARKET BY TYPE, 2018-2032 (USD THOUSAND)
TABLE 153 SAUDI ARABIA JAPAN SILK IN SILK MARKET, BY TYPE, 2018-2032 (USD THOUSAND)
TABLE 154 SAUDI ARABIA THAILAND SILK IN SILK MARKET, BY TYPE, 2018-2032 (USD THOUSAND)
TABLE 155 SAUDI ARABIA SILK MARKET, BY MATERIAL, 2018-2032 (USD THOUSAND)
TABLE 156 SAUDI ARABIA BLENDED SILK IN SILK MARKET, BY TYPE, 2018-2032 (USD THOUSAND)
TABLE 157 SAUDI ARABIA SILK MARKET, BY PRODUCTION PROCESS, 2018-2032 (USD THOUSAND)
TABLE 158 SAUDI ARABIA SILK MARKET, BY END-USER, 2018-2032 (USD THOUSAND)
TABLE 159 SAUDI ARABIA TEXTILE IN SILK MARKET, BY END-USER, 2018-2032 (USD THOUSAND)
TABLE 160 SAUDI ARABIA CLOTHING IN SILK MARKET, BY TYPE, 2018-2032 (USD THOUSAND)
TABLE 161 SAUDI ARABIA TEXTILE IN SILK MARKET, BY TYPE, 2018-2032 (USD THOUSAND)
TABLE 162 SAUDI ARABIA MEDICAL IN SILK MARKET, BY TYPE, 2018-2032 (USD THOUSAND)
TABLE 163 SAUDI ARABIA OTHERS IN SILK MARKET, BY TYPE, 2018-2032 (USD THOUSAND)
TABLE 164 SAUDI ARABIA SILK MARKET, BY DISTRIBUTION CHANNEL, 2018-2032 (USD THOUSAND)
TABLE 165 SAUDI ARABIA OFFLINE IN SILK MARKET, BY TYPE, 2018-2032 (USD THOUSAND)
TABLE 166 UAE SILK MARKET, BY TYPE, 2018-2032 (USD THOUSAND)
TABLE 167 UAE SILK MARKET, BY TYPE, 2018-2032 (THOUSAND METER)
TABLE 168 UAE SILK MARKET, BY PRODUCT TYPE, 2018-2032 (USD THOUSAND)
TABLE 169 UAE SILK MARKET, BY WEIGHT, 2018-2032 (USD THOUSAND)
TABLE 170 UAE SILK MARKET, BY PLY, 2018-2032 (USD THOUSAND)
TABLE 171 UAE SILK MARKET, BY COUNTRY OF ORIGIN, 2018-2032 (USD THOUSAND)
TABLE 172 UAE INDIAN SILK IN SILK MARKET, BY TYPE, 2018-2032 (USD THOUSAND)
TABLE 173 UAE TUSSAH/TUSSAR IN SILK MARKET BY TYPE, 2018-2032 (USD THOUSAND)
TABLE 174 UAE JAPAN SILK IN SILK MARKET, BY TYPE, 2018-2032 (USD THOUSAND)
TABLE 175 UAE THAILAND SILK IN SILK MARKET, BY TYPE, 2018-2032 (USD THOUSAND)
TABLE 176 UAE SILK MARKET, BY MATERIAL, 2018-2032 (USD THOUSAND)
TABLE 177 UAE BLENDED SILK IN SILK MARKET, BY TYPE, 2018-2032 (USD THOUSAND)
TABLE 178 UAE SILK MARKET, BY PRODUCTION PROCESS, 2018-2032 (USD THOUSAND)
TABLE 179 UAE SILK MARKET, BY END-USER, 2018-2032 (USD THOUSAND)
TABLE 180 UAE TEXTILE IN SILK MARKET, BY END-USER, 2018-2032 (USD THOUSAND)
TABLE 181 UAE CLOTHING IN SILK MARKET, BY TYPE, 2018-2032 (USD THOUSAND)
TABLE 182 UAE TEXTILE IN SILK MARKET, BY TYPE, 2018-2032 (USD THOUSAND)
TABLE 183 UAE MEDICAL IN SILK MARKET, BY TYPE, 2018-2032 (USD THOUSAND)
TABLE 184 UAE OTHERS IN SILK MARKET, BY TYPE, 2018-2032 (USD THOUSAND)
TABLE 185 UAE SILK MARKET, BY DISTRIBUTION CHANNEL, 2018-2032 (USD THOUSAND)
TABLE 186 UAE OFFLINE IN SILK MARKET, BY TYPE, 2018-2032 (USD THOUSAND)
TABLE 187 ISRAEL SILK MARKET, BY TYPE, 2018-2032 (USD THOUSAND)
TABLE 188 ISRAEL SILK MARKET, BY TYPE, 2018-2032 (THOUSAND METER)
TABLE 189 ISRAEL SILK MARKET, BY PRODUCT TYPE, 2018-2032 (USD THOUSAND)
TABLE 190 ISRAEL SILK MARKET, BY WEIGHT, 2018-2032 (USD THOUSAND)
TABLE 191 ISRAEL SILK MARKET, BY PLY, 2018-2032 (USD THOUSAND)
TABLE 192 ISRAEL SILK MARKET, BY COUNTRY OF ORIGIN, 2018-2032 (USD THOUSAND)
TABLE 193 ISRAEL INDIAN SILK IN SILK MARKET, BY TYPE, 2018-2032 (USD THOUSAND)
TABLE 194 ISRAEL TUSSAH/TUSSAR IN SILK MARKET BY TYPE, 2018-2032 (USD THOUSAND)
TABLE 195 ISRAEL JAPAN SILK IN SILK MARKET, BY TYPE, 2018-2032 (USD THOUSAND)
TABLE 196 ISRAEL THAILAND SILK IN SILK MARKET, BY TYPE, 2018-2032 (USD THOUSAND)
TABLE 197 ISRAEL SILK MARKET, BY MATERIAL, 2018-2032 (USD THOUSAND)
TABLE 198 ISRAEL BLENDED SILK IN SILK MARKET, BY TYPE, 2018-2032 (USD THOUSAND)
TABLE 199 ISRAEL SILK MARKET, BY PRODUCTION PROCESS, 2018-2032 (USD THOUSAND)
TABLE 200 ISRAEL SILK MARKET, BY END-USER, 2018-2032 (USD THOUSAND)
TABLE 201 ISRAEL TEXTILE IN SILK MARKET, BY END-USER, 2018-2032 (USD THOUSAND)
TABLE 202 ISRAEL CLOTHING IN SILK MARKET, BY TYPE, 2018-2032 (USD THOUSAND)
TABLE 203 ISRAEL TEXTILE IN SILK MARKET, BY TYPE, 2018-2032 (USD THOUSAND)
TABLE 204 ISRAEL MEDICAL IN SILK MARKET, BY TYPE, 2018-2032 (USD THOUSAND)
TABLE 205 ISRAEL OTHERS IN SILK MARKET, BY TYPE, 2018-2032 (USD THOUSAND)
TABLE 206 ISRAEL SILK MARKET, BY DISTRIBUTION CHANNEL, 2018-2032 (USD THOUSAND)
TABLE 207 ISRAEL OFFLINE IN SILK MARKET, BY TYPE, 2018-2032 (USD THOUSAND)
TABLE 208 REST OF MIDDLE EAST & AFRICA SILK MARKET, BY TYPE, 2018-2032 (USD THOUSAND)
TABLE 209 REST OF MIDDLE EAST & AFRICA SILK MARKET, BY TYPE, 2018-2032 (THOUSAND METER)
List of Figure
FIGURE 1 MIDDLE EAST AND AFRICA SILK MARKET, BY TYPE, 2018-2032 (USD THOUSAND)SILK MARKET
FIGURE 2 MIDDLE EAST AND AFRICA SILK MARKET, BY TYPE, 2018-2032 (USD THOUSAND)SILK MARKET: DATA TRIANGULATION
FIGURE 3 MIDDLE EAST AND AFRICA SILK MARKET, BY TYPE, 2018-2032 (USD THOUSAND)SILK MARKET: DROC ANALYSIS
FIGURE 4 MIDDLE EAST AND AFRICA SILK MARKET, BY TYPE, 2018-2032 (USD THOUSAND)SILK MARKET: REGIONAL MARKET ANALYSIS
FIGURE 5 MIDDLE EAST AND AFRICA SILK MARKET, BY TYPE, 2018-2032 (USD THOUSAND)SILK MARKET: COMPANY RESEARCH ANALYSIS
FIGURE 6 MIDDLE EAST AND AFRICA SILK MARKET, BY TYPE, 2018-2032 (USD THOUSAND)SILK MARKET: MULTIVARIATE MODELLING
FIGURE 7 MIDDLE EAST AND AFRICA SILK MARKET, BY TYPE, 2018-2032 (USD THOUSAND)SILK MARKET: INTERVIEW DEMOGRAPHICS
FIGURE 8 MIDDLE EAST AND AFRICA SILK MARKET, BY TYPE, 2018-2032 (USD THOUSAND)SILK MARKET: DBMR MARKET POSITION GRID
FIGURE 9 MIDDLE EAST AND AFRICA SILK MARKET, BY TYPE, 2018-2032 (USD THOUSAND)SILK MARKET: VENDOR SHARE ANALYSIS
FIGURE 10 MARKET END-USE COVERAGE GRID
FIGURE 11 MIDDLE EAST AND AFRICA SILK MARKET, BY TYPE, 2018-2032 (USD THOUSAND)SILK MARKET: SEGMENTATION
FIGURE 13 EXECUTIVE SUMMARY
FIGURE 14 TWENTY-THREE SEGMENTS COMPRISE THE MIDDLE EAST & AFRICA SILK MARKET, BY TYPE (2024)
FIGURE 15 STRATEGIC DECISIONS
FIGURE 16 HIGH GOVERNMENT SUPPORT FOR DOMESTIC SILK PRODUCTION INDUSTRY IS EXPECTED TO DRIVE THE MIDDLE EAST & AFRICA SILK MARKET IN THE FORECAST PERIOD (2025-2032)
FIGURE 17 THE MULBERY SILK SEGMENT IS EXPECTED TO ACCOUNT FOR THE LARGEST SHARE OF THE MIDDLE EAST & AFRICA SILK MARKET IN 2025 AND 2032
FIGURE 19 PORTER’S FIVE FORCES ANALYSIS
FIGURE 20 DRIVERS, RESTRAINTS, OPPORTUNITIES, AND CHALLENGES OF THE MIDDLE EAST AND AFRICA SILK MARKET
FIGURE 21 MIDDLE EAST AND AFRICA SILK MARKET: BY TYPE, 2024
FIGURE 22 MIDDLE EAST AND AFRICA SILK MARKET: BY PRODUCT TYPE, 2024
FIGURE 23 MIDDLE EAST AND AFRICA SILK MARKET: BY WEIGHT, 2024
FIGURE 24 MIDDLE EAST AND AFRICA SILK MARKET: BY PLY, 2024
FIGURE 25 MIDDLE EAST AND AFRICA SILK MARKET: BY COUNTRY OF ORIGIN, 2024
FIGURE 26 MIDDLE EAST AND AFRICA SILK MARKET: BY MATERIAL, 2024
FIGURE 27 MIDDLE EAST AND AFRICA SILK MARKET: BY PRODUCTION PROCESS, 2024
FIGURE 28 MIDDLE EAST AND AFRICA SILK MARKET: BY END-USER, 2024
FIGURE 29 MIDDLE EAST AND AFRICA SILK MARKET: BY DISTRIBUTION CHANNEL, 2024
FIGURE 30 MIDDLE EAST AND AFRICA SILK MARKET: SNAPSHOT (2024)
FIGURE 31 MIDDLE EAST AND AFRICA SILK MARKET: COMPANY SHARE 2024 (%)
Middle East And Africa Silk Market, Supply Chain Analysis and Ecosystem Framework
To support market growth and help clients navigate the impact of geopolitical shifts, DBMR has integrated in-depth supply chain analysis into its Middle East And Africa Silk Market research reports. This addition empowers clients to respond effectively to global changes affecting their industries. The supply chain analysis section includes detailed insights such as Middle East And Africa Silk Market consumption and production by country, price trend analysis, the impact of tariffs and geopolitical developments, and import and export trends by country and HSN code. It also highlights major suppliers with data on production capacity and company profiles, as well as key importers and exporters. In addition to research, DBMR offers specialized supply chain consulting services backed by over a decade of experience, providing solutions like supplier discovery, supplier risk assessment, price trend analysis, impact evaluation of inflation and trade route changes, and comprehensive market trend analysis.
Data collection and base year analysis are done using data collection modules with large sample sizes. The stage includes obtaining market information or related data through various sources and strategies. It includes examining and planning all the data acquired from the past in advance. It likewise envelops the examination of information inconsistencies seen across different information sources. The market data is analysed and estimated using market statistical and coherent models. Also, market share analysis and key trend analysis are the major success factors in the market report. To know more, please request an analyst call or drop down your inquiry.
The key research methodology used by DBMR research team is data triangulation which involves data mining, analysis of the impact of data variables on the market and primary (industry expert) validation. Data models include Vendor Positioning Grid, Market Time Line Analysis, Market Overview and Guide, Company Positioning Grid, Patent Analysis, Pricing Analysis, Company Market Share Analysis, Standards of Measurement, Global versus Regional and Vendor Share Analysis. To know more about the research methodology, drop in an inquiry to speak to our industry experts.
Data Bridge Market Research is a leader in advanced formative research. We take pride in servicing our existing and new customers with data and analysis that match and suits their goal. The report can be customized to include price trend analysis of target brands understanding the market for additional countries (ask for the list of countries), clinical trial results data, literature review, refurbished market and product base analysis. Market analysis of target competitors can be analyzed from technology-based analysis to market portfolio strategies. We can add as many competitors that you require data about in the format and data style you are looking for. Our team of analysts can also provide you data in crude raw excel files pivot tables (Fact book) or can assist you in creating presentations from the data sets available in the report.


