
Middle East And Africa Swir Market
Market Size in USD Million
 USD
17.81 Million
USD
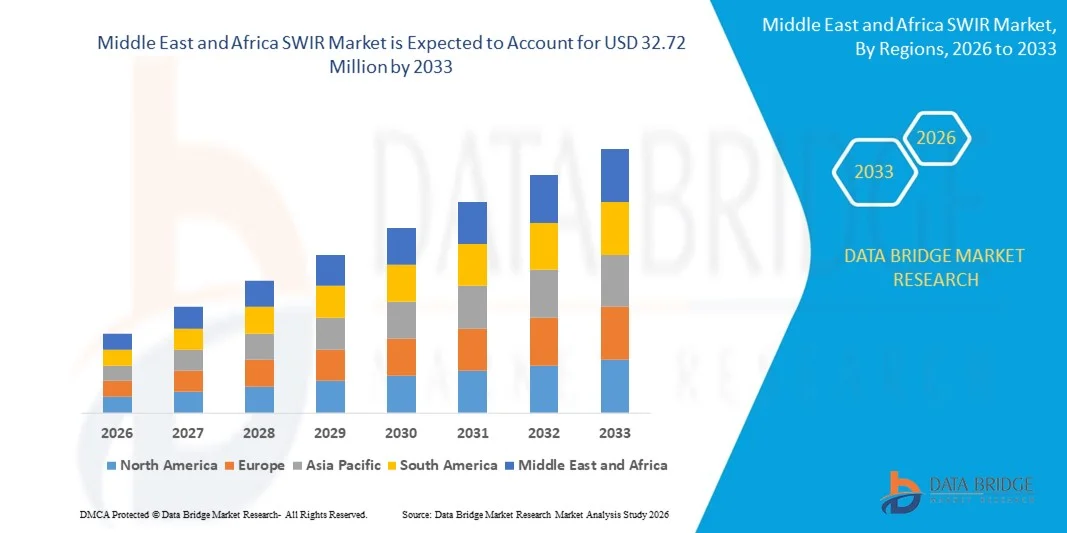
32.72 Million
2025
2033
USD
17.81 Million
USD
32.72 Million
2025
2033
| 2026 - 2033 | |
| USD 17.81 Million | |
| USD 32.72 Million | |
| % | |
|
Middle East and Africa SWIR Market Size
- The Middle East and Africa SWIR market size was valued at USD 17.81 million in 2025 and is expected to reach USD 32.72 million by 2033, at a CAGR of 7.9% during the forecast period
- The market growth is largely fueled by the increasing adoption of advanced imaging solutions across industrial, defense, and research sectors, leading to higher demand for short-wave infrared (SWIR) technology in machine vision, surveillance, and monitoring applications
- Furthermore, rising need for high-precision, non-visible spectrum imaging in quality control, process inspection, and autonomous systems is establishing SWIR cameras and sensors as essential tools in modern industrial and security operations. These converging factors are accelerating the deployment of SWIR technology, thereby significantly boosting the industry’s growth
Middle East and Africa SWIR Market Analysis
- SWIR cameras and sensors, enabling imaging beyond the visible spectrum, are becoming increasingly vital in industrial automation, scientific research, security surveillance, and autonomous applications due to their enhanced detection capabilities, high resolution, and ability to operate under low-light or obscured conditions
- The escalating demand for SWIR technology is primarily fueled by the growing adoption of automated inspection systems, increasing investments in industrial and defense imaging solutions, and a rising preference for precision imaging in applications where standard vision systems are insufficient
- U.A.E. dominated the SWIR market in 2025, due to presence of advanced industrial, defense, and research sectors, growing adoption of SWIR imaging for machine vision and surveillance applications, and increasing demand for high-precision inspection and monitoring solutions
- Saudi Arabia is expected to be the fastest growing country in the SWIR market during the forecast period due to increasing adoption of advanced imaging solutions in industrial, defense, and energy sectors, modernization of monitoring and inspection processes, and government initiatives promoting high-tech innovation
- Line scan segment dominated the market with a market share of 57.5% in 2025, due to its high-resolution imaging capability and suitability for continuous production lines in industrial inspection applications. Line scan SWIR cameras are widely preferred in automated quality control processes due to their ability to capture detailed images of fast-moving objects with minimal distortion
Report Scope and SWIR Market Segmentation
|
Attributes |
SWIR Key Market Insights |
|
Segments Covered |
|
|
Countries Covered |
Middle East and Africa
|
|
Key Market Players |
|
|
Market Opportunities |
|
|
Value Added Data Infosets |
In addition to the insights on market scenarios such as market value, growth rate, segmentation, geographical coverage, and major players, the market reports curated by the Data Bridge Market Research also include in-depth expert analysis, geographically represented company-wise production and capacity, network layouts of distributors and partners, detailed and updated price trend analysis and deficit analysis of supply chain and demand. |
Middle East and Africa SWIR Market Trends
Miniaturization and Cost Reduction of SWIR Sensors
- A key trend in the SWIR market is the ongoing miniaturization and cost reduction of SWIR sensors, driven by the increasing demand for compact, portable, and affordable imaging solutions across defense, industrial, and scientific applications. This trend is enabling broader adoption of SWIR technology in scenarios where conventional infrared sensors were previously too bulky or expensive
- For instance, FLIR Systems has developed smaller and lower-cost SWIR cameras that maintain high sensitivity and resolution for industrial inspection and surveillance applications. These innovations are expanding accessibility for real-time monitoring in constrained spaces and challenging environments
- The growing interest in portable SWIR imaging solutions is enhancing capabilities in remote sensing, quality control, and material inspection, where compact sensors allow integration into drones, handheld devices, and robotic platforms. This is driving the market toward lightweight, energy-efficient, and field-deployable systems
- SWIR sensor integration in automated inspection and process control systems is increasing as industries require fast, accurate detection of material defects, chemical compositions, and thermal anomalies. This trend positions SWIR sensors as critical enablers for industrial efficiency and product quality assurance
- Research institutions and scientific organizations are adopting miniaturized SWIR sensors for applications such as spectroscopy, biomedical imaging, and environmental monitoring. The reduced size and cost are encouraging wider experimentation and deployment in academic and commercial research
- The advancement of semiconductor technologies and photodetector materials is facilitating lower-cost SWIR solutions without compromising performance, enabling competitive alternatives to traditional short-wavelength infrared imaging systems. This is reinforcing the role of SWIR sensors as versatile tools across multiple sectors
Middle East and Africa SWIR Market Dynamics
Driver
Increasing Adoption in Industrial Automation and Quality Control
- The adoption of SWIR sensors in industrial automation is rising due to their ability to detect features invisible in visible light, improving precision and efficiency in manufacturing and quality control processes. Their deployment ensures higher throughput and reduced defects in production environments
- For instance, Sensors Unlimited, a division of Collins Aerospace, supplies SWIR cameras for semiconductor and pharmaceutical inspection, enabling accurate material analysis and process monitoring. This drives operational efficiency and ensures compliance with stringent quality standards
- The integration of SWIR imaging into robotics and automated systems supports enhanced machine vision capabilities, allowing detection of moisture content, contamination, and material inconsistencies that are critical for production optimization
- Industries such as electronics, food processing, and packaging are increasingly relying on SWIR sensors to maintain product consistency and reduce wastage. Their non-invasive imaging capabilities contribute to more reliable and faster inspection routines
- The expansion of industrial IoT and smart factory initiatives is accelerating the need for high-performance SWIR sensors that can be embedded into automated monitoring systems. This growth is fostering innovation in sensor miniaturization, cost reduction, and real-time analytics
Restraint/Challenge
High Cost Compared to Visible Imaging
- The SWIR market faces challenges due to the higher costs of SWIR sensors compared with visible and near-infrared imaging systems, which limits adoption in cost-sensitive applications. These expenses arise from complex semiconductor materials, specialized optics, and precision manufacturing processes
- For instance, Hamamatsu Photonics manufactures high-sensitivity SWIR detectors using advanced InGaAs technology, which entails significant production costs. This cost barrier restricts widespread deployment in consumer and mid-tier industrial markets
- High sensor cost is further compounded by the need for auxiliary electronics, cooling systems, and calibration mechanisms that ensure reliable performance under diverse conditions. This adds to overall system expenses and complicates integration
- The market also experiences constraints in scaling production while maintaining sensor performance and yield, making it difficult to reduce costs rapidly. Manufacturers must balance quality, sensitivity, and economic feasibility to remain competitive
- These financial challenges continue to limit penetration into mainstream applications, requiring ongoing innovation in manufacturing efficiency and material research to make SWIR sensors more affordable without compromising functionality
Middle East and Africa SWIR Market Scope
The market is segmented on the basis of scanning type, detector type, chemical composition, application, component, and industry.
- By Scanning Type
On the basis of scanning type, the SWIR market is segmented into line scan and area scan. The line scan segment dominated the market with the largest revenue share of 57.5% in 2025, driven by its high-resolution imaging capability and suitability for continuous production lines in industrial inspection applications. Line scan SWIR cameras are widely preferred in automated quality control processes due to their ability to capture detailed images of fast-moving objects with minimal distortion. Industries such as electronics manufacturing and food inspection often prioritize line scan systems for their precision and reliability in defect detection.
The area scan segment is anticipated to witness the fastest growth rate from 2026 to 2033, fueled by expanding adoption in machine vision, security surveillance, and research applications. For instance, companies such as Hamamatsu provide area scan SWIR cameras that allow flexible imaging of static and dynamic scenes, making them ideal for laboratory and inspection use. Area scan systems offer ease of integration with software-based image processing tools, enabling more versatile deployment across multiple industries. The growth is also supported by increasing demand for compact, high-performance cameras in emerging applications.
- By Detector Type
On the basis of detector type, the SWIR market is segmented into cooled and uncooled detectors. The cooled detector segment dominated the market with the largest revenue share in 2025, owing to its superior sensitivity, low noise performance, and ability to capture high-quality images in low-light or long-wavelength applications. Cooled SWIR detectors are commonly used in aerospace, defense, and scientific research for precise measurement and thermal detection, where image clarity is critical. The reliability and accuracy of cooled detectors make them a preferred choice for high-end applications requiring stringent performance standards.
The uncooled detector segment is expected to witness the fastest CAGR from 2026 to 2033, driven by their cost-effectiveness, lower maintenance requirements, and suitability for compact commercial and industrial solutions. For instance, Xenics offers uncooled SWIR detectors that are increasingly adopted in industrial monitoring and security systems, where performance-to-cost ratio is a key consideration. Uncooled detectors also benefit from growing miniaturization trends in sensor technologies, enabling broader accessibility and flexible deployment across applications.
- By Chemical Composition
On the basis of chemical composition, the SWIR market is segmented into Indium Gallium Arsenide (InGaAs), Mercury Cadmium Telluride (MCT), Indium Antimonide (InSb), Lead Sulfide Quantum Dots (PbS QDs), and others. The InGaAs segment dominated the market with the largest revenue share in 2025, attributed to its wide wavelength detection range, high quantum efficiency, and robustness for industrial and military applications. InGaAs detectors are widely used in machine vision, surveillance, and spectral imaging due to their stable performance and ability to operate across varying environmental conditions. The established supply chain and availability of matured manufacturing processes further strengthen their market position.
The Lead Sulfide Quantum Dots (PbS QDs) segment is expected to witness the fastest growth from 2026 to 2033, fueled by advances in nanotechnology and demand for low-cost, flexible SWIR detection solutions. For instance, Nanosys develops PbS quantum dot detectors that offer tunable absorption and solution-processable fabrication, making them ideal for integration into compact and portable devices. The growth is further supported by rising interest in wearable imaging systems and portable spectroscopy applications.
- By Application
On the basis of application, the SWIR market is segmented into machine vision, thermal imaging, hyperspectral imaging, security and surveillance, monitoring and inspection, photovoltaics, and others. The machine vision segment dominated the market with the largest revenue share in 2025, driven by high adoption in automated industrial inspection, defect detection, and sorting systems. SWIR-enabled machine vision allows manufacturers to detect features invisible to conventional cameras, improving product quality and reducing waste. Its integration with AI and robotics further strengthens its utility in smart factories and automated production lines.
The security and surveillance segment is expected to witness the fastest growth from 2026 to 2033, driven by increasing global demand for enhanced surveillance in commercial, public, and critical infrastructure spaces. For instance, FLIR Systems provides SWIR surveillance cameras that deliver clear imaging through fog, smoke, and low-light conditions, enhancing safety and situational awareness. The growth is also fueled by rising adoption in border monitoring, perimeter security, and advanced threat detection solutions.
- By Component
On the basis of component, the SWIR market is segmented into hardware, software, and services. The hardware segment dominated the market with the largest revenue share in 2025, owing to the high cost and technological complexity of SWIR cameras, lenses, and detector modules. Hardware investments are critical for achieving superior performance, and end-users often prefer turnkey hardware solutions from established suppliers to ensure reliability and compatibility. The dominance of hardware is reinforced by continued innovation in sensor design and lens optimization for diverse applications.
The software segment is expected to witness the fastest growth from 2026 to 2033, fueled by increasing reliance on advanced image processing, AI-based analytics, and real-time monitoring capabilities. For instance, Cognex offers software platforms that enhance SWIR camera performance in machine vision and inspection applications, enabling predictive analysis and operational efficiency. The growth is supported by rising demand for integrated hardware-software solutions that provide actionable insights rather than just raw imaging data.
- By Industry
On the basis of industry, the SWIR market is segmented into commercial, industrial, medical, military and defense, scientific research, and others. The industrial segment dominated the market with the largest revenue share in 2025, driven by extensive adoption in automated manufacturing, quality control, and material inspection. SWIR technology allows industries to detect product defects, contamination, or inconsistencies invisible to conventional cameras, improving efficiency and reducing operational costs. Industries such as semiconductors, food processing, and electronics are major consumers of SWIR systems due to their stringent quality standards.
The medical segment is expected to witness the fastest growth from 2026 to 2033, driven by increasing use of SWIR imaging for diagnostics, surgical guidance, and non-invasive monitoring. For instance, researchers at Siemens Healthineers are deploying SWIR imaging for enhanced tissue visualization and early disease detection, offering superior contrast and depth perception. The growth is further supported by rising investments in healthcare imaging technologies and adoption of non-ionizing imaging methods for patient safety.
Middle East and Africa SWIR Market Regional Analysis
- U.A.E. dominated the SWIR market with the largest revenue share in 2025, driven by the presence of advanced industrial, defense, and research sectors, growing adoption of SWIR imaging for machine vision and surveillance applications, and increasing demand for high-precision inspection and monitoring solutions
- Widespread deployment of automated industrial inspection systems, expansion of defense and security initiatives, and continuous investment in research and development reinforce sustained demand for SWIR technology across the country
- Strong government support for technological innovation, focus on smart manufacturing frameworks, and integration of SWIR imaging with AI and analytics platforms further strengthen market penetration
Saudi Arabia SWIR Market Insight
Saudi Arabia is projected to register the fastest CAGR in the Middle East and Africa SWIR market during the forecast period, supported by increasing adoption of advanced imaging solutions in industrial, defense, and energy sectors, modernization of monitoring and inspection processes, and government initiatives promoting high-tech innovation. Expansion of industrial automation, security infrastructure, and research programs is accelerating the deployment of SWIR cameras for machine vision, thermal imaging, and hyperspectral analysis. Growing focus on operational efficiency, integration with AI and analytics, and enhanced imaging capabilities is driving rapid market growth. Strong government backing for technology-driven solutions positions Saudi Arabia as the fastest-growing market in the region.
South Africa SWIR Market Insight
South Africa is expected to witness steady growth during the forecast period, driven by gradual adoption of SWIR imaging solutions across industrial inspection, security surveillance, and scientific research applications, and increasing reliance on high-resolution imaging for process monitoring and quality control. Investments in digital transformation, automation, and integration of SWIR systems with analytics platforms support sustained demand for advanced imaging solutions. Regulatory emphasis on industrial safety, operational transparency, and research innovation reinforces South Africa’s steady growth within the Middle East and Africa SWIR market.
Middle East and Africa SWIR Market Share
The SWIR industry is primarily led by well-established companies, including:
- Teledyne Digital Imaging Inc (U.S.)
- Exosens (France)
- Lynred (France)
- Allied Vision Technologies GmbH (Germany)
- Hamamatsu Photonics K.K. (Japan)
- New Imaging Technologies (NIT) (France)
- Photon Etc. (Canada)
- Princeton Infrared Technologies, Inc. (U.S.)
- Raptor Photonics (U.K.)
- IRCameras LLC (U.S.)
- Intevac, Inc. (U.S.)
- Opgal Ltd (Canada)
- InfraTec GmbH (Germany)
- TTP plc. (U.K.)
- Photonic Science and Engineering Limited (U.K.)
- SWIR Vision Systems (Belgium)
- Edmund Optics Inc. (U.S.)
- Silent Sentinel (U.K.)
Latest Developments in Middle East and Africa SWIR Market
- In July 2024, onsemi (Semiconductor Components Industries, LLC) acquired SWIR VISION SYSTEMS, INC., a company recognized for its advanced short-wave infrared (SWIR) technology based on colloidal quantum dots (CQD). This acquisition enables onsemi to integrate SWIR capabilities with its existing CMOS sensor portfolio, allowing sensors to capture images beyond the visible spectrum. The technology enhances imaging performance in critical sectors such as industrial automation, security and surveillance, and autonomous vehicles. By leveraging CQD-based SWIR sensors, onsemi aims to offer cost-effective, high-performance imaging solutions with improved sensitivity, broader wavelength detection, and compact designs, catering to applications that demand both precision and affordability. This strategic move strengthens onsemi’s position in the growing SWIR market and accelerates its roadmap for advanced imaging innovations
- In May 2024, Teledyne FLIR LLC announced a partnership with UE Systems Inc. (U.S.) to provide industrial customers with next-generation predictive maintenance solutions. This collaboration combines Teledyne’s thermal imaging systems with UE Systems’ ultrasonic technology, enabling comprehensive monitoring of equipment health. The integrated solution helps detect faults such as leaks, electrical discharges, and mechanical wear before they escalate into costly failures. Industrial sectors, including manufacturing, energy, and utilities, can benefit from improved operational efficiency, reduced downtime, and enhanced safety. The partnership reflects an increasing trend of converging imaging and sensor technologies to deliver smarter, data-driven maintenance strategies
- In April 2024, New Imaging Technologies (NIT) introduced its latest SWIR imaging advancement: the NSC2101 high-resolution InGaAs sensor. Engineered for the most demanding imaging applications, the sensor features an 8µm pixel pitch and offers a full HD resolution of 1920x1080 pixels (2 MPIX). With an ultra-low noise level of just 25e-, the sensor provides exceptional image clarity, even in low-light and high-speed industrial environments. The NSC2101 enhances imaging for machine vision, quality control, and scientific research, enabling precise detection of defects, material inconsistencies, or spectral signatures. Its combination of high resolution, sensitivity, and robustness positions it as a premium solution for sectors requiring superior SWIR performance
- In September 2023, Leonardo DRS (U.S.) launched the Small Unmanned Aircraft System Tactical Agile Gimbal (STAG)-5 LLD, designed for high-definition day and night imaging in small unmanned aircraft systems (UAS). The lightweight and highly stable gimbal integrates advanced sensors capable of capturing precise imagery under challenging operational conditions. It is specifically optimized for military and defense applications, supporting reconnaissance, surveillance, and target acquisition missions. The STAG-5 LLD gimbal enhances situational awareness, enables real-time intelligence gathering, and provides reliable imaging for both stationary and moving targets, reflecting the growing demand for compact, high-performance SWIR-enabled aerial surveillance systems
- In October 2023, Omron Corporation introduced a new line of SWIR cameras aimed at improving precision inspection across manufacturing processes. These cameras extend vision capabilities beyond the visible spectrum, enabling detection of material defects that standard vision systems cannot identify, including in glass, silicon, and plastics. The SWIR technology ensures higher accuracy in quality control, reduces production waste, and supports process optimization at various manufacturing stages. By integrating advanced SWIR imaging with user-friendly interfaces and industrial automation systems, Omron’s solution addresses growing industrial demand for efficient, high-resolution inspection technologies, particularly in electronics, semiconductor, and high-precision material production
SKU-

- Interactive Data Analysis Dashboard
- Company Analysis Dashboard for high growth potential opportunities
- Research Analyst Access for customization & queries
- Competitor Analysis with Interactive dashboard
- Latest News, Updates & Trend analysis
- Harness the Power of Benchmark Analysis for Comprehensive Competitor Tracking
Middle East And Africa Swir Market, Supply Chain Analysis and Ecosystem Framework
To support market growth and help clients navigate the impact of geopolitical shifts, DBMR has integrated in-depth supply chain analysis into its Middle East And Africa Swir Market research reports. This addition empowers clients to respond effectively to global changes affecting their industries. The supply chain analysis section includes detailed insights such as Middle East And Africa Swir Market consumption and production by country, price trend analysis, the impact of tariffs and geopolitical developments, and import and export trends by country and HSN code. It also highlights major suppliers with data on production capacity and company profiles, as well as key importers and exporters. In addition to research, DBMR offers specialized supply chain consulting services backed by over a decade of experience, providing solutions like supplier discovery, supplier risk assessment, price trend analysis, impact evaluation of inflation and trade route changes, and comprehensive market trend analysis.
Data collection and base year analysis are done using data collection modules with large sample sizes. The stage includes obtaining market information or related data through various sources and strategies. It includes examining and planning all the data acquired from the past in advance. It likewise envelops the examination of information inconsistencies seen across different information sources. The market data is analysed and estimated using market statistical and coherent models. Also, market share analysis and key trend analysis are the major success factors in the market report. To know more, please request an analyst call or drop down your inquiry.
The key research methodology used by DBMR research team is data triangulation which involves data mining, analysis of the impact of data variables on the market and primary (industry expert) validation. Data models include Vendor Positioning Grid, Market Time Line Analysis, Market Overview and Guide, Company Positioning Grid, Patent Analysis, Pricing Analysis, Company Market Share Analysis, Standards of Measurement, Global versus Regional and Vendor Share Analysis. To know more about the research methodology, drop in an inquiry to speak to our industry experts.
Data Bridge Market Research is a leader in advanced formative research. We take pride in servicing our existing and new customers with data and analysis that match and suits their goal. The report can be customized to include price trend analysis of target brands understanding the market for additional countries (ask for the list of countries), clinical trial results data, literature review, refurbished market and product base analysis. Market analysis of target competitors can be analyzed from technology-based analysis to market portfolio strategies. We can add as many competitors that you require data about in the format and data style you are looking for. Our team of analysts can also provide you data in crude raw excel files pivot tables (Fact book) or can assist you in creating presentations from the data sets available in the report.


