
Middle East And Africa Telecom Expense Management Market
Market Size in USD Billion
 USD
127.49 Billion
USD
159.09 Billion
2025
2033
USD
127.49 Billion
USD
159.09 Billion
2025
2033
| 2026 - 2033 | |
| USD 127.49 Billion | |
| USD 159.09 Billion | |
| % | |
|
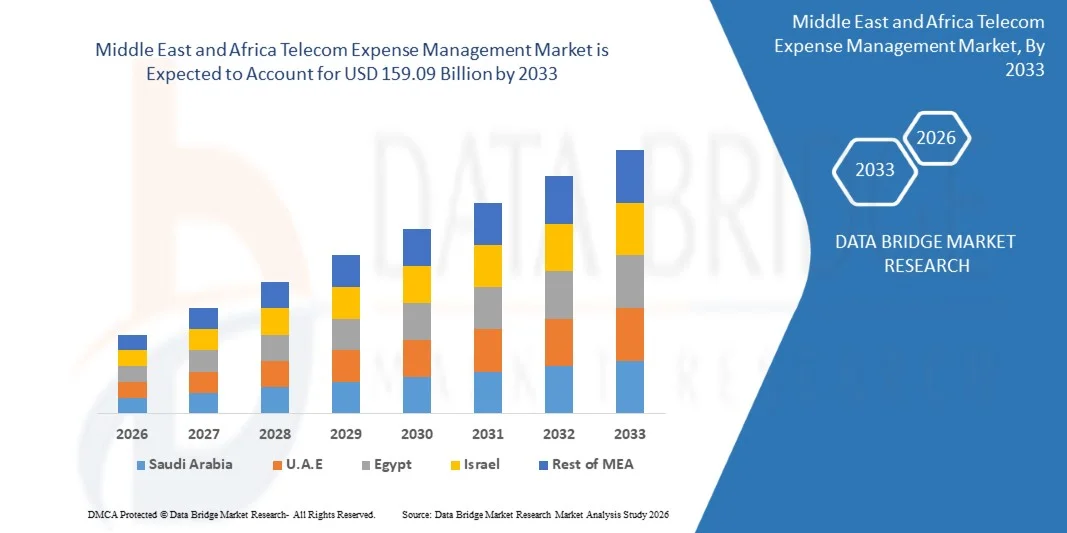
What is the Middle East and Africa Telecom Expense Management Market Size and Growth Rate?
- The Middle East and Africa Telecom Expense Management market size was valued at USD 127.49 billion in 2025 and is expected to reach USD 159.09 billion by 2033, at a CAGR of 4.90% during the forecast period
- The market growth is largely fueled by the increasing complexity of telecom environments, the rising adoption of cloud-based services, and the growing need for cost optimization and visibility into telecom spending across enterprises
- Furthermore, stringent regulatory requirements, the proliferation of mobile devices and data usage, and the demand for efficient management of telecom assets are establishing telecom expense management solutions as a critical tool for businesses, thereby significantly boosting the industry's growth
What are the Major Takeaways of Telecom Expense Management Market?
- Telecom Expense Management solutions, offering businesses the ability to track, manage, and optimize their telecommunication expenses, are increasingly vital components of modern business operations in both large enterprises and SMEs due to their enhanced visibility, cost-saving potential, and ability to streamline complex telecom environments
- The escalating demand for telecom expense management solutions is primarily fueled by the increasing complexity of telecom services (including voice, data, and cloud), growing pressure on organizations to control costs, and a rising need for detailed reporting and analytics on telecom spending
- South Africa dominated the Middle East & Africa Telecom Expense Management market with the largest revenue share of 33.6% in 2025, supported by the strong presence of major telecom operators, increasing enterprise mobility adoption, and growing demand for cost optimization across corporate communication networks
- U.A.E is witnessing the fastest growth rate of 11.52% in the Middle East & Africa region, driven by rapid enterprise digitalization, widespread adoption of cloud communication platforms, and increasing demand for telecom cost optimization across multinational corporations
- Hosted services segment is expected to contribute significantly to the global industry, accounting for 69.5% of the total revenue share in 2025
Report Scope and Telecom Expense Management Market Segmentation
|
Attributes |
Telecom Expense Management Key Market Insights |
|
Segments Covered |
|
|
Countries Covered |
Middle East and Africa
|
|
Key Market Players |
|
|
Market Opportunities |
|
|
Value Added Data Infosets |
In addition to the insights on market scenarios such as market value, growth rate, segmentation, geographical coverage, and major players, the market reports curated by the Data Bridge Market Research also include in-depth expert analysis, pricing analysis, brand share analysis, consumer survey, demography analysis, supply chain analysis, value chain analysis, raw material/consumables overview, vendor selection criteria, PESTLE Analysis, Porter Analysis, and regulatory framework. |
What is the Key Trend in the Telecom Expense Management Market?
“Increasing Focus on Mobile Expense Management”
- The telecom expense management (TEM) market is witnessing a significant and accelerating trend towards a more intensive focus on managing mobile communication expenses. This shift is a direct response to the pervasive adoption of smartphones, tablets, and other mobile devices within the enterprise, coupled with the increasing prevalence of Bring Your Own Device (BYOD) policies
- Organizations are realizing that mobile costs, encompassing voice, data, and messaging services, now constitute a substantial portion of their overall telecom spending and require specialized attention. Traditional TEM solutions, initially designed to handle fixed-line expenses, are evolving to incorporate robust mobile expense management capabilities. This includes features such as real-time usage monitoring, policy enforcement, mobile device management (MDM) integration, and granular visibility into employee mobile spending
- Companies such as Tangoe and WidePoint have been at the forefront of this trend, offering comprehensive mobile TEM solutions that enable businesses to track data consumption, identify cost optimization opportunities for mobile plans, and manage international roaming charges effectively
- Furthermore, the rise of remote work has amplified the importance of mobile TEM, as companies need to ensure that employees working from various locations are equipped with cost-effective mobile communication plans and that usage remains within defined policies
- This trend is expected to continue as mobile technology advances and the mobile workforce expands, making sophisticated mobile expense management a critical component of any comprehensive TEM strategy
What are the Key Drivers of Telecom Expense Management Market?
- A primary driver fueling the growth and evolution of the telecom expense management (TEM) market is the widespread adoption of mobile devices across the business landscape and the increasing implementation of Bring Your Own Device (BYOD) policies. The modern workforce is highly mobile, relying heavily on smartphones and tablets for communication, collaboration, and accessing business applications
- This reliance has led to a significant surge in enterprise mobile telecom expenses, encompassing service plans, data usage, and roaming charges. Simultaneously, many organizations are embracing BYOD policies to reduce hardware costs and enhance employee satisfaction by allowing them to use their preferred devices for work
- BYOD introduces complexities in managing telecom expenses, as companies need to differentiate between personal and business usage and ensure fair reimbursement or allowance structures
- This surge in mobile device adoption and the intricacies of BYOD have created a strong demand for TEM solutions that can provide comprehensive visibility and control over mobile spending
- TEM platforms offer features that allow businesses to track mobile usage patterns, enforce spending policies, manage mobile contracts effectively, and optimize mobile service plans based on actual consumption
- Vendors such as Calero-MDSL and Cass Information Systems provide robust mobile expense management modules within their TEM suites to address this critical driver, helping organizations navigate the complexities of managing a mobile-first workforce while controlling costs
Which Factor is Challenging the Growth of the Telecom Expense Management Market?
- A significant challenge hindering the full potential of the telecom expense management (TEM) market is the scarcity of skilled professionals within organizations who possess the necessary expertise to effectively implement, manage, and optimize TEM solutions. While robust TEM platforms offer powerful tools for cost management and visibility, realizing their full benefits often requires specialized knowledge of telecom billing intricacies, contract negotiation strategies, data analysis techniques, and understanding of regulatory compliance
- Many companies, especially small and medium-sized enterprises, may lack dedicated personnel with this specific skillset. Implementing a TEM solution is not merely about deploying software; it requires a strategic approach to define policies, configure the system correctly, analyze the resulting data, and take proactive steps to optimize telecom spending
- The absence of skilled TEM professionals can lead to underutilization of the platform's capabilities, missed cost-saving opportunities, and potential errors in managing telecom expenses
- To overcome this challenge, organizations can either invest in training their existing IT or finance staff, hire experienced TEM professionals, or opt for managed TEM services where external experts take over the responsibility of managing their telecom expenses. TEM vendors and consulting firms also play a crucial role in providing training and support to help organizations build the necessary expertise internally
- Addressing this skills gap is vital for ensuring that investments in TEM solutions translate into tangible and sustainable cost savings and improved efficiency in telecom management
How is the Telecom Expense Management Market Segmented?
The market is segmented on the basis of application, product type, technology, magnification type, end user, and distribution channel.
- By Offering
The market for telecom expense management (TEM) is divided into solutions and services. In 2025, the solutions segment generated the most revenue. This is because companies increasingly need automation, better visibility, and more control over their telecom spending. Many organizations are using TEM solutions to make it easier to check invoices, track usage, and lower costs, especially when they have multiple providers and locations. The extensive features of these platforms continue to make them popular with large businesses.
The services segment is predicted to grow the fastest between 2025 and 2032. This growth is driven by the increasing demand for personalized and expert management of telecom costs. Managed service providers offer ongoing support, data analysis, and help with compliance, which reduces the workload for internal IT departments. More mid-sized businesses are choosing to outsource these key tasks, leading to higher demand for services.
- By Service Delivery Mode
The market based on how services are delivered includes managed services, complete outsourcing, and hosted solutions. Hosted services segment is expected to contribute significantly to the global industry, accounting for 69.5% of the total revenue share in 2025. These services help organizations lower their overhead costs and allow their internal teams to focus on more strategic activities. This approach continues to be attractive to companies looking to efficiently manage costs and consolidate their vendors.
The complete outsourcing segment is anticipated to have the highest annual growth rate. More businesses are relying on full-service TEM providers to handle all aspects of their telecom management, from purchasing to contract negotiation and usage optimization. Complete outsourcing is becoming more common for companies with complex telecom setups.
- By Deployment Mode
The market is divided into cloud-based and on-premise deployments. In 2025, the on premise segment had the largest share of the market in 2025. These deployments offer more control over the infrastructure, customization options, and security features, making them suitable for industries with many regulations. Although it's growing at a slower pace, on-premise solutions continue to effectively meet the specific needs of some enterprises.
The cloud segment is expected to experience the fastest growth of 16.45% between 2025 and 2032. This is due to the ease of deployment, the ability to access the system remotely, and the lower initial investment. Cloud-based TEM solutions provide real-time data analysis, quicker updates, and easy integration with other business systems. The flexibility and scalability of the cloud model make it a good fit for organizations undergoing digital transformation.
- By Enterprise Size
The market is segmented based on the size of the company: large enterprises and small & medium enterprises (SMEs). Large enterprises is the dominant segment with the largest market share of 79.91% in 2025. This is because they typically have high telecom spending and complex infrastructures across their global operations. These organizations use advanced TEM platforms to manage contracts across multiple countries, centralize billing, and negotiate with vendors. Being able to see and optimize costs remains a top priority for these large-scale operations.
The SME segment is expected to experience the fastest growth of 15.44% between 2025 and 2032. These businesses are looking for affordable and automated ways to manage their telecom expenses without needing to hire more IT staff. Cloud-based TEM tools and service bundles are becoming increasingly popular with SMEs that are focused on cost. Ease of use, affordability, and the ability to add features as needed are key factors driving growth in this segment.
- By Operating System
The market is segmented by the operating systems used into Windows, MAC, Mobile, LINUX, Chromebook, and Fixed Circuits. The Windows segment had the largest share of the market in 2025. This is because Windows is widely used in businesses for both desktops and servers. Most TEM platforms are designed to work well with Windows, making it easy to install the software and manage it centrally. Its prevalence in corporate IT infrastructure continues to support its integration with TEM systems.
The Mobile segment is anticipated to have the highest annual growth rate from 2025 to 2032. This reflects the increasing trend of businesses adopting mobile-first strategies. With more employees using mobile devices and the rise of Bring Your Own Device (BYOD) policies, companies are implementing TEM solutions that can monitor and control wireless expenses. The growth of the mobile workforce is driving demand for flexible TEM platforms that can be used remotely.
- By End-User
The market is segmented based on the industry of the end-user, including IT & Telecom, BFSI, Automotive, Manufacturing, Healthcare, Transportation & Logistics, Consumer Goods & Retail, Energy & Power, Media & Entertainment, and Others. The IT & Telecom segment held the largest market share of 37.53% in 2025. These industries rely heavily on various communication systems and global connectivity. TEM solutions help them manage complex billing, data usage, and contract terms efficiently. The high volume of telecom activity and the need for central control make this segment a major source of revenue.
The BFSI segment is expected to grow at the fastest annual rate of 14.13% during the forecast period. This surge is driven by the increasing number of individuals utilizing mobile and internet banking services, consequently boosting the demand for managing telecom expenses within the BFSI industry.
Which Region Holds the Largest Share of the Telecom Expense Management Market?
- South Africa dominated the Middle East & Africa Telecom Expense Management market with the largest revenue share of 33.6% in 2025, supported by the strong presence of major telecom operators, increasing enterprise mobility adoption, and growing demand for cost optimization across corporate communication networks. The country has a well-developed telecommunications ecosystem with widespread mobile connectivity, expanding enterprise digital transformation initiatives, and strong adoption of cloud-based telecom management platforms. Large enterprises across industries such as banking, retail, and IT are increasingly adopting Telecom Expense Management solutions to monitor telecom spending, manage mobile assets, and optimize communication costs across distributed workforces in major business hubs such as Johannesburg, Cape Town, and Durban
- In the country, rising deployment of cloud-based telecom expense management platforms, automated invoice auditing systems, and centralized telecom lifecycle management tools is improving cost transparency and operational efficiency for enterprises. The increasing use of mobile devices, unified communications platforms, and corporate data plans is encouraging organizations to implement advanced analytics-driven Telecom Expense Management solutions to control telecom expenditures and improve budget management across large enterprise networks
- In South Africa, the expanding enterprise sector, strong telecommunications infrastructure, and increasing focus on digital cost management strategies further reinforce the country’s leadership position within the Middle East & Africa Telecom Expense Management market
U.A.E Telecom Expense Management Market Insight
U.A.E is witnessing the fastest growth rate of 11.52% in the Middle East & Africa region, driven by rapid enterprise digitalization, widespread adoption of cloud communication platforms, and increasing demand for telecom cost optimization across multinational corporations. The country’s advanced telecom infrastructure, high smartphone penetration, and strong presence of global enterprises are accelerating adoption of Telecom Expense Management platforms. Businesses are increasingly adopting automated telecom invoice management, real-time usage monitoring, and centralized communication cost control solutions, which significantly improve financial transparency and operational efficiency across corporate telecom environments.
Nigeria Telecom Expense Management Market Insight
In Nigeria, the Telecom Expense Management market is expanding steadily, supported by rapid mobile subscriber growth, increasing enterprise mobility adoption, and rising telecom spending across organizations. The country has one of the largest telecommunications subscriber bases in Africa, creating significant demand for solutions that help enterprises monitor telecom usage and control operational costs. Growing digital businesses, expanding fintech ecosystems, and increasing reliance on mobile communication services continue to stimulate demand for Telecom Expense Management solutions across major commercial centers such as Lagos and Abuja.
Which are the Top Companies in Telecom Expense Management Market?
The Telecom Expense Management industry is primarily led by well-established companies, including:
- Vatic Outsourcing (U.S.)
- TeleManagement Technologies, Inc. (U.S.)
- Auditel, Inc. (U.S.)
- Teamnet (Romania)
- SITETRACKER (U.S.)
- brightfin (U.S.)
- Cost Management Group (U.S.)
- Vodafone Group (U.K.)
- Tangoe (U.S.)
- AVOTUS (Canada)
- Calero (U.S.)
- Cass Information Systems, Inc. (U.S.)
- Tellennium (U.S.)
- ASIGNET (Spain)
- Upland Software, Inc. (U.S.)
- Sakon (U.S.)
- VALICOM (U.S.)
- WidePoint Corporation (U.S.)
- CGI Inc. (Canada)
- NTT Communications Corporation (Japan)
What are the Recent Developments in Middle East and Africa Telecom Expense Management Market?
- In May 2024, CGI and Nokia Corporation entered into a partnership to integrate 5G private wireless networking technology with CGI’s business services, aiming to accelerate real-time, data-driven digital solution delivery. This collaboration significantly enhances CGI’s telecom exchange management capabilities, allowing the company to offer more advanced connectivity solutions that improve operational cost efficiency and strengthen market competitiveness. The strategic alliance positions both firms to lead in delivering intelligent telecom infrastructure
- In June 2023, Vodafone and Three agreed to merge their U.K. telecom operations, creating the country's largest mobile network operator with over 27 million subscribers. While the deal is subject to competition authority approval and union feedback, the consolidation is expected to improve network efficiency, optimize operations, and reduce telecom exchange management costs. The merger strengthens Vodafone’s market footprint and operational capabilities
- In September 2023, Prodapt formed a partnership to support ServiceNow in expanding its telecom, media, and tech (TMT) solutions, empowering Communication Service Providers (CSPs) with enhanced workflow automation. This initiative aims to drive digital transformation through improved operational agility, increased productivity, and better customer experience. The collaboration boosts Prodapt’s role in delivering scalable telecom management solutions
- In November 2022, Renodis, a telecom management firm, acquired 12 Points Consulting, a company specializing in telecom expense management services. This acquisition leverages the strengths of both entities to enhance Renodis’s offerings in telecom and utility management while benefiting employees, partners, and clients. The merger expands Renodis’s service portfolio and operational depth
- In September 2022, Tangoe, a telecom expense and asset management provider, integrated robotic process automation (RPA) into its systems. This advancement minimizes manual effort, lowers errors, and improves processing speed by using intelligent automation and machine learning tools. The RPA integration significantly enhances Tangoe’s data handling and competitive advantage
SKU-

- Interactive Data Analysis Dashboard
- Company Analysis Dashboard for high growth potential opportunities
- Research Analyst Access for customization & queries
- Competitor Analysis with Interactive dashboard
- Latest News, Updates & Trend analysis
- Harness the Power of Benchmark Analysis for Comprehensive Competitor Tracking
Data collection and base year analysis are done using data collection modules with large sample sizes. The stage includes obtaining market information or related data through various sources and strategies. It includes examining and planning all the data acquired from the past in advance. It likewise envelops the examination of information inconsistencies seen across different information sources. The market data is analysed and estimated using market statistical and coherent models. Also, market share analysis and key trend analysis are the major success factors in the market report. To know more, please request an analyst call or drop down your inquiry.
The key research methodology used by DBMR research team is data triangulation which involves data mining, analysis of the impact of data variables on the market and primary (industry expert) validation. Data models include Vendor Positioning Grid, Market Time Line Analysis, Market Overview and Guide, Company Positioning Grid, Patent Analysis, Pricing Analysis, Company Market Share Analysis, Standards of Measurement, Global versus Regional and Vendor Share Analysis. To know more about the research methodology, drop in an inquiry to speak to our industry experts.
Data Bridge Market Research is a leader in advanced formative research. We take pride in servicing our existing and new customers with data and analysis that match and suits their goal. The report can be customized to include price trend analysis of target brands understanding the market for additional countries (ask for the list of countries), clinical trial results data, literature review, refurbished market and product base analysis. Market analysis of target competitors can be analyzed from technology-based analysis to market portfolio strategies. We can add as many competitors that you require data about in the format and data style you are looking for. Our team of analysts can also provide you data in crude raw excel files pivot tables (Fact book) or can assist you in creating presentations from the data sets available in the report.


