
Middle East And Africa Teleradiology Market
Market Size in USD Million
 USD
67.23 Million
USD
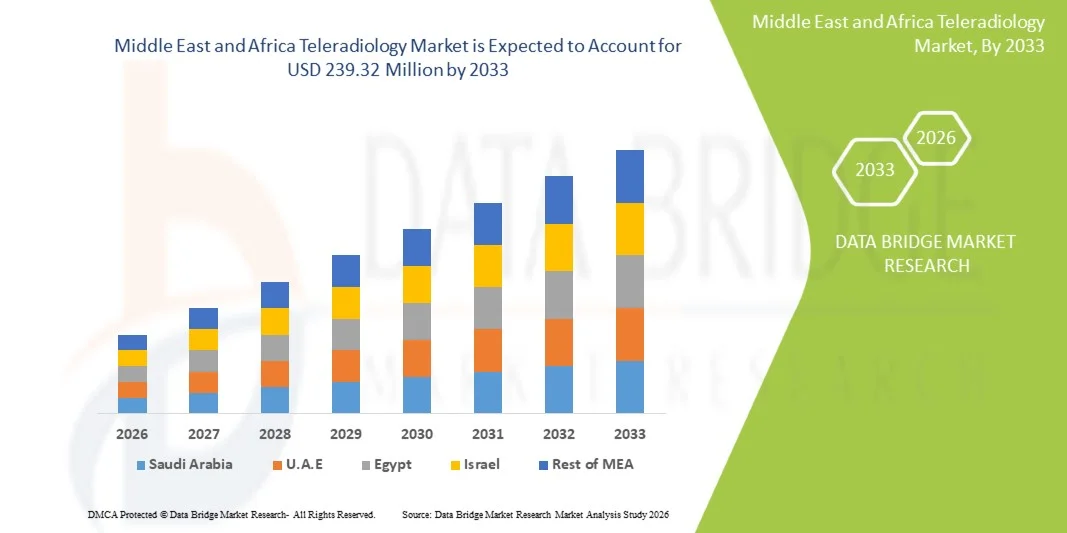
239.32 Million
2025
2033
USD
67.23 Million
USD
239.32 Million
2025
2033
| 2026 - 2033 | |
| USD 67.23 Million | |
| USD 239.32 Million | |
| % | |
|
Middle East and Africa Teleradiology Market Size
- The Middle East and Africa teleradiology market size was valued at USD 67.23 million in 2025 and is expected to reach USD 239.32 million by 2033, at a CAGR of 17.2% during the forecast period
- The market growth is largely fueled by the increasing adoption of digital healthcare infrastructure and telemedicine services, along with ongoing technological advancements in medical imaging and cloud-based diagnostic platforms, leading to improved accessibility of radiology services across remote and underserved regions
- Furthermore, rising demand for timely and cost-effective diagnostic solutions, coupled with a shortage of skilled radiologists and increasing prevalence of chronic diseases requiring advanced imaging, is establishing teleradiology as a critical component of modern healthcare delivery systems in the region, thereby significantly boosting the industry's growth
Middle East and Africa Teleradiology Market Analysis
- Teleradiology, enabling the electronic transmission of radiological images for remote interpretation and diagnosis, is becoming an essential part of modern healthcare delivery in the Middle East and Africa due to its ability to improve access to specialist radiology services and reduce diagnostic turnaround time across urban and underserved healthcare facilities
- The escalating demand for teleradiology is primarily driven by the growing burden of chronic diseases, increasing need for advanced medical imaging, and a shortage of skilled radiologists in several countries, alongside rapid expansion of telemedicine infrastructure and digital health transformation initiatives
- Saudi Arabia dominated the MEA teleradiology market with a market share of 28.6% in 2025, supported by strong healthcare investments, rapid hospital digitalization, and large-scale deployment of AI-enabled imaging and cloud-based diagnostic platforms under national healthcare modernization programs
- Nigeria is expected to be the fastest growing country in the teleradiology market during the forecast period, driven by expanding telemedicine adoption, rising investments in digital health infrastructure, and increasing use of remote diagnostic solutions to address significant radiologist shortages and improve rural healthcare access
- The Cloud Based Delivery Mode segment dominated the market with a share of 57.8% in 2025 due to its scalability, cost-effectiveness, and ability to enable real-time image sharing and collaboration among healthcare providers, making it highly suitable for multi-site hospital networks and diagnostic centers across the country-level healthcare systems
Report Scope and Middle East and Africa Teleradiology Market Segmentation
|
Attributes |
Middle East and Africa Teleradiology Key Market Insights |
|
Segments Covered |
|
|
Countries Covered |
Middle East and Africa
|
|
Key Market Players |
|
|
Market Opportunities |
|
|
Value Added Data Infosets |
In addition to the insights on market scenarios such as market value, growth rate, segmentation, geographical coverage, and major players, the market reports curated by the Data Bridge Market Research also include in-depth expert analysis, patient epidemiology, pipeline analysis, pricing analysis, and regulatory framework |
Middle East and Africa Teleradiology Market Trends
“Expansion of AI-Driven Imaging and Cloud-Based Diagnostic Networks”
- A significant and accelerating trend in the Middle East and Africa teleradiology market is the growing integration of artificial intelligence (AI) and cloud-based platforms into radiology workflows, enabling faster image interpretation, improved diagnostic accuracy, and seamless collaboration between healthcare providers across multiple facilities
- For instance, platforms such as Sectra PACS and Philips IntelliSpace Radiology are increasingly being deployed across hospital networks in the UAE and Saudi Arabia, supporting AI-assisted image analysis and centralized reporting systems
- AI integration in teleradiology enables advanced capabilities such as automated anomaly detection in CT and MRI scans, prioritization of critical cases, and intelligent workflow optimization that reduces reporting turnaround times and improves clinical decision-making efficiency
- The expansion of cloud-based teleradiology systems facilitates real-time image sharing and remote reporting between radiologists and hospitals, allowing healthcare providers to access specialist expertise regardless of geographical limitations, particularly in rural and underserved areas
- This trend towards highly connected, AI-enabled diagnostic ecosystems is fundamentally transforming radiology services, with organizations such as Agfa HealthCare developing cloud-native imaging platforms that support secure data exchange and multi-site collaboration across healthcare institutions
- The demand for AI-integrated and cloud-based teleradiology solutions is growing rapidly across both public and private healthcare sectors in the region, as hospitals increasingly prioritize efficiency, scalability, and improved patient outcomes
- In addition, rising collaborations between healthcare providers and global imaging technology firms are accelerating the deployment of advanced teleradiology ecosystems across both developed and emerging healthcare markets in the region
Middle East and Africa Teleradiology Market Dynamics
Driver
“Rising Demand Driven by Radiologist Shortage and Healthcare Digitalization”
- The increasing shortage of qualified radiologists combined with rapid healthcare digitalization across Middle East and Africa countries is a significant driver for the growing adoption of teleradiology services in hospitals and diagnostic centers
- For instance, in March 2025, Saudi Arabia’s Ministry of Health expanded its national telemedicine initiatives to enhance remote radiology reporting capabilities across major public hospitals, strengthening digital diagnostic infrastructure
- As healthcare systems face growing patient volumes and rising prevalence of chronic diseases, teleradiology offers faster diagnostic turnaround times, enabling timely treatment decisions and improved clinical outcomes
- Furthermore, expanding investments in digital health infrastructure and smart hospital initiatives are making teleradiology an integral part of modern healthcare delivery systems across both urban and semi-urban regions
- The convenience of remote reporting, reduced dependency on on-site radiologists, and improved access to specialist interpretation services are key factors driving adoption in both public and private healthcare institutions
- Additionally, increasing adoption of cross-border radiology reporting services is enabling healthcare providers to access global radiology expertise, further improving diagnostic quality and reducing service bottlenecks
Restraint/Challenge
“Data Security Risks and Uneven Healthcare Infrastructure Development”
- Concerns surrounding data privacy, cybersecurity risks, and regulatory compliance challenges pose a significant barrier to wider adoption of teleradiology solutions across Middle East and Africa healthcare systems
- For instance, reports of increasing cyberattacks on healthcare IT systems in countries such as South Africa have raised concerns regarding the protection of sensitive patient imaging data and the integrity of diagnostic workflows
- Addressing these cybersecurity challenges through advanced encryption, secure cloud architecture, and strict compliance with healthcare data protection regulations is essential to building trust among healthcare providers and patients
- Additionally, uneven healthcare infrastructure development across countries creates disparities in the availability of advanced imaging equipment and reliable internet connectivity, limiting the effectiveness of teleradiology deployment in rural regions
- While leading countries such as the UAE and Saudi Arabia are rapidly advancing in digital radiology adoption, many developing healthcare systems still face cost constraints and limited technological readiness, which slows down large-scale implementation
- Furthermore, lack of standardized regulatory frameworks for cross-border telemedicine and radiology reporting continues to create operational and legal complexities for service providers operating across multiple countries
Middle East and Africa Teleradiology Market Scope
The market is segmented on the basis of type, delivery mode, imaging technique, technology, procedure, application, site, age, mode of purchase, and end user.
- By Type
On the basis of type, the teleradiology market is segmented into hardware, systems, software, telecom, and networking services. The hardware segment dominated the market with the largest market revenue share due to the high dependency on advanced imaging infrastructure such as CT scanners, MRI systems, X-ray machines, and radiology workstations. Hospitals and diagnostic centers across the Middle East & Africa are continuously investing in upgrading imaging equipment to improve diagnostic accuracy and workflow efficiency. Growing healthcare infrastructure development and expansion of tertiary care hospitals further strengthen hardware adoption. In addition, long equipment replacement cycles and high capital expenditure requirements contribute to sustained dominance. The need for high-quality imaging in critical care and emergency diagnosis also supports this segment’s leadership.
The software segment is expected to witness the fastest growth rate during the forecast period due to rapid digital transformation and increasing adoption of AI-based diagnostic platforms. Rising use of PACS (Picture Archiving and Communication Systems), cloud-based imaging software, and workflow management solutions is driving this growth. Software enables remote access to imaging data, real-time collaboration, and faster reporting between radiologists. Integration with hospital information systems and electronic health records is further boosting adoption. The shortage of radiologists in MEA is also pushing demand for automated diagnostic support tools. Continuous innovation in AI-enabled imaging analytics is accelerating segment expansion.
- By Delivery Mode
On the basis of delivery mode, the market is segmented into web-based delivery mode, cloud-based delivery mode, and on-premise delivery mode. The Cloud Based Delivery Mode segment dominated the market with a share of 57.8% in 2025 due to its strong capability to enable remote access, real-time image sharing, and seamless collaboration among radiologists across different locations. Healthcare providers in the Middle East & Africa are rapidly adopting cloud-based systems to overcome limitations of on-premise infrastructure and improve overall diagnostic efficiency. The increasing volume of medical imaging data such as CT, MRI, and X-ray scans is driving demand for scalable and flexible storage solutions offered by cloud platforms.
The on-premise delivery mode dominated the market due to strong data security requirements and strict regulatory compliance in healthcare institutions across the Middle East & Africa region. Large hospitals and established diagnostic centers prefer on-premise systems as they provide complete control over sensitive patient imaging data and internal IT infrastructure. Many healthcare facilities in the region continue to rely on traditional radiology IT systems, which further strengthens adoption of on-premise solutions.
- By Imaging Technique
On the basis of imaging technique, the market is segmented into small matrix size and large matrix size. The large matrix size segment dominated the market due to its high-resolution imaging capability, which is essential for accurate diagnosis of complex diseases. It is widely used in oncology, neurology, and cardiovascular imaging where detailed anatomical visualization is required. Hospitals and advanced diagnostic centers prefer large matrix imaging for its superior clarity and precision. Increasing prevalence of chronic diseases requiring advanced imaging further supports dominance. High-end imaging systems in tertiary care hospitals predominantly rely on large matrix output.
The small matrix size segment is expected to witness the fastest growth during the forecast period due to faster transmission speed and lower data storage requirements. It is particularly useful in emergency care and remote diagnostics where quick image sharing is critical. Small matrix imaging is increasingly used in portable imaging systems and point-of-care diagnostics. It is well suited for rural areas with limited bandwidth availability. Growing demand for faster diagnostic turnaround time is driving adoption. Compatibility with cloud-based systems further supports rapid growth.
- By Technology
On the basis of technology, the market is segmented into advanced graphics processing, volume rendering, multiplanar reconstructions, and image compression. The volume rendering segment dominated the market due to its advanced 3D visualization capability, which enhances diagnostic accuracy. It is widely used in complex surgical planning and disease evaluation across oncology, neurology, and cardiology. Radiologists prefer volume rendering for better spatial understanding of anatomical structures. Hospitals with advanced imaging infrastructure heavily rely on this technology. Its ability to improve diagnostic precision ensures continued dominance.
The advanced graphics processing segment is expected to witness the fastest growth during the forecast period due to increasing use of AI and GPU-based computing in medical imaging. It enables faster image rendering and real-time analysis, improving workflow efficiency. Cloud-based GPU acceleration is further driving adoption in teleradiology systems. Rising demand for AI-assisted diagnostic interpretation is boosting segment expansion. Healthcare providers are increasingly investing in high-performance computing systems. Continuous technological advancements in imaging analytics are accelerating growth.
- By Procedure
On the basis of procedure, the market is segmented into tele-consultation, tele-diagnosis, and tele-monitoring. The tele-diagnosis segment dominated the market as it is the core function of teleradiology services. It enables remote interpretation of medical images, helping overcome the shortage of radiologists in MEA regions. Hospitals rely heavily on tele-diagnosis for emergency and critical care reporting. It significantly reduces turnaround time for diagnosis, improving patient outcomes. Its widespread adoption across hospitals and diagnostic centers ensures dominance.
The tele-consultation segment is expected to witness the fastest growth during the forecast period due to increasing demand for multidisciplinary collaboration in healthcare. It allows real-time communication between radiologists and physicians for better treatment planning. Growing adoption of telehealth platforms is further supporting this segment. Patients benefit from faster expert opinions without needing physical hospital visits. It improves diagnostic accuracy in complex cases. Digital healthcare expansion across MEA is driving strong growth.
- By Application
On the basis of application, the market is segmented into cardiology, neurology, oncology, musculoskeletal, gastroenterology, pelvic and abdominal, gynecology, urology, mammography, dental, and others. The neurology segment dominated the market due to the high prevalence of neurological disorders such as stroke, epilepsy, and brain trauma. Advanced imaging techniques like MRI and CT scans are widely used in neurological diagnosis. Teleradiology plays a critical role in emergency stroke detection and rapid decision-making. Increasing geriatric population further strengthens demand. Hospitals prioritize neurology due to its high clinical urgency.
The oncology segment is expected to witness the fastest growth during the forecast period due to rising cancer incidence across the region. Early detection and continuous monitoring require frequent imaging support. Government cancer screening programs are expanding across MEA countries. AI-based imaging tools are improving tumor detection accuracy and efficiency. Increasing investment in oncology infrastructure is driving growth. Rising demand for remote cancer diagnostics is further accelerating adoption.
- By Site
On the basis of site, the market is segmented into in-house, offshore, and onshore. The in-house segment dominated the market due to strong preference for data control, security, and integration within hospital systems. Large hospitals maintain internal radiology departments for faster diagnosis and better workflow management. It ensures secure handling of sensitive patient imaging data. In-house systems also support emergency imaging requirements. Hospitals prefer centralized control over radiology operations.
The offshore segment is expected to witness the fastest growth during the forecast period due to increasing outsourcing of radiology services. It helps hospitals address the shortage of radiologists in MEA countries. Offshore reporting provides cost efficiency and access to global expertise. Time-zone differences enable 24/7 diagnostic services. Smaller healthcare facilities are increasingly adopting offshore models. Globalization of healthcare services is driving strong growth.
- By Age
On the basis of age, the market is segmented into pediatric, geriatric, and adults. The adult segment dominated the market due to high prevalence of chronic diseases such as cardiovascular disorders, diabetes complications, and neurological conditions. Adults account for the majority of diagnostic imaging procedures in hospitals and clinics. Lifestyle-related diseases significantly increase imaging demand. Emergency care also heavily involves adult patients. High diagnostic volume ensures dominance.
The geriatric segment is expected to witness the fastest growth during the forecast period due to the rising aging population in MEA countries. Elderly patients require frequent imaging for multiple chronic conditions. Increasing prevalence of neurological and musculoskeletal disorders is driving demand. Teleradiology supports remote monitoring for elderly patients with mobility limitations. Healthcare systems are expanding geriatric care services. This demographic shift is accelerating growth.
- By Mode of Purchase
On the basis of mode of purchase, the market is segmented into group purchase and individual purchase. The group purchase segment dominated the market due to bulk procurement by hospitals, healthcare networks, and government institutions. It helps reduce overall cost through economies of scale. Standardization of imaging systems across facilities also supports this model. Large hospital chains prefer centralized procurement strategies. Government healthcare programs also adopt group purchasing.
The individual purchase segment is expected to witness the fastest growth during the forecast period due to rising number of standalone diagnostic centers and private clinics. Smaller healthcare providers prefer flexible procurement options. It enables faster adoption of teleradiology solutions. Private investment in healthcare infrastructure is increasing across MEA. Digital procurement platforms are simplifying purchase processes. This is driving strong segment growth.
- By End User
On the basis of end user, the market is segmented into hospitals, ambulatory surgical centers, private physician offices, diagnostic imaging centers, and others. The hospitals segment dominated the market due to high patient inflow and strong imaging infrastructure. Hospitals provide emergency, inpatient, and outpatient radiology services. They invest heavily in integrated teleradiology systems. Hospitals also act as referral centers for complex cases. Strong radiology departments ensure dominance.
The diagnostic imaging centers segment is expected to witness the fastest growth during the forecast period, due to increasing demand for outpatient imaging services. These centers offer cost-effective and specialized diagnostic services. Rising awareness of preventive healthcare is increasing patient visits. They are rapidly adopting cloud-based and AI-enabled teleradiology systems. Faster turnaround time and efficiency are driving growth. Expansion of private diagnostic chains is further boosting this segment.
Middle East and Africa Teleradiology Market Regional Analysis
- Saudi Arabia dominated the MEA teleradiology market with a market share of 28.6% in 2025, supported by strong healthcare investments, rapid hospital digitalization, and large-scale deployment of AI-enabled imaging and cloud-based diagnostic platforms under national healthcare modernization programs
- Healthcare providers in the country are increasingly adopting teleradiology solutions to improve diagnostic speed, reduce radiologist workload, and enable 24/7 access to specialist reporting across urban and remote regions
- This widespread adoption is further supported by high penetration of AI-enabled imaging systems, growing demand for early disease detection, and increasing integration of cloud-based healthcare platforms, positioning Saudi Arabia as a key hub for advanced radiology services in the region
The Saudi Arabia Teleradiology Market Insight
The Saudi Arabia teleradiology market captured the largest revenue share in 2025 within the Middle East & Africa region, driven by strong government-led healthcare digitalization initiatives and rapid expansion of advanced hospital infrastructure under national transformation programs. The country is increasingly investing in AI-enabled imaging systems and cloud-based radiology platforms to improve diagnostic efficiency and reduce reporting turnaround time. The growing shortage of specialized radiologists is further accelerating the adoption of teleradiology solutions across public and private healthcare facilities. Additionally, rising demand for early disease detection and real-time diagnostic support is strengthening market growth. The integration of telemedicine platforms with hospital information systems is also significantly contributing to the expansion of teleradiology services in the country.
UAE Teleradiology Market Insight
The UAE teleradiology market is projected to expand at a strong CAGR throughout the forecast period, primarily driven by the country’s highly advanced healthcare infrastructure and early adoption of digital health technologies. Increasing demand for world-class diagnostic services and rapid access to specialist radiologists is fostering strong adoption of teleradiology solutions. The UAE’s focus on smart healthcare initiatives and AI integration in medical imaging is further supporting market growth. Additionally, the presence of leading private hospital networks and medical tourism inflow is enhancing demand for efficient radiology reporting systems. Growing investment in cloud-based healthcare platforms is also accelerating market expansion.
South Africa Teleradiology Market Insight
The South Africa teleradiology market is anticipated to grow at a notable CAGR during the forecast period, driven by rising demand for improved diagnostic access in underserved and rural areas. The shortage of radiology professionals in the country is a key factor boosting reliance on remote diagnostic services. Increasing burden of chronic diseases such as cancer and cardiovascular conditions is further driving imaging demand. Healthcare providers are increasingly adopting digital radiology platforms to improve turnaround time and diagnostic accuracy. Additionally, public-private partnerships and investments in healthcare digitization are supporting the growth of teleradiology services in the region.
Nigeria Teleradiology Market Insight
The Nigeria teleradiology market is expected to witness the fastest growth rate during the forecast period, driven by the severe shortage of radiology professionals and increasing need for accessible diagnostic services across rural and urban areas. The country’s expanding burden of chronic diseases such as cancer, cardiovascular disorders, and infectious conditions is further boosting demand for medical imaging. Healthcare providers are increasingly adopting teleradiology solutions to bridge the gap between limited specialist availability and growing patient needs. Rising investments in digital health infrastructure and telemedicine platforms are also supporting market expansion. Additionally, international collaborations and public-private partnerships are accelerating the deployment of remote diagnostic technologies across healthcare facilities.
Middle East and Africa Teleradiology Market Share
The Middle East and Africa Teleradiology industry is primarily led by well-established companies, including:
- Everlight Radiology (U.K.)
- 4ways Healthcare Limited (U.K.)
- Agfa-Gevaert NV (Belgium)
- Siemens Healthineers AG (Germany)
- Koninklijke Philips N.V. (Netherlands)
- FUJIFILM Europe GmbH (Germany)
- GE Healthcare (U.K.)
- Sectra AB (Sweden)
- Carestream Health Europe (U.K.)
- RamSoft Inc. (U.K.)
- Telemedicine Clinic (Spain)
- Teleradiology Solutions (U.K.)
- Radiology Reporting Online (U.K.)
- Ambra Health (U.K.)
- ONRAD Europe (U.K.)
- StatRad Europe (U.K.)
- Doctor NET (France)
- Medica Group PLC (U.K.)
- InHealth Group (U.K.)
- Alliance Medical Group (U.K.)
What are the Recent Developments in Middle East and Africa Teleradiology Market?
- In October 2025, industry reports on AI-assisted medical imaging in the Middle East & Africa highlighted the rapid scaling of cloud-based and AI-driven teleradiology platforms, particularly across GCC countries such as Saudi Arabia and the UAE. The region is increasingly shifting from pilot projects to large-scale deployment of AI-powered diagnostic imaging solutions to improve radiology efficiency and reduce reporting delays
- In March 2025, KLAS Research highlighted the expansion of advanced PACS and teleradiology integration across Middle East healthcare systems during its Middle East healthcare IT summit, where major hospitals and vendors focused on improving radiology workflow efficiency and interoperability. The initiative emphasized the growing adoption of cloud-based imaging platforms and AI-assisted diagnostic tools across MEA healthcare facilities
- In February 2025, Sheikh Shakhbout Medical City (UAE), one of the largest tertiary hospitals in Abu Dhabi, expanded its AI-powered radiology and teleradiology capabilities to improve remote diagnostic reporting and reduce turnaround time for complex imaging cases. The upgrade included enhanced cloud-based PACS integration and AI-assisted image interpretation tools, enabling faster collaboration between radiologists across multiple locations
- In May 2023, multiple healthcare providers across South Africa increased adoption of cloud-based teleradiology platforms to improve diagnostic access in underserved regions. These systems allowed radiologists to remotely interpret MRI and CT scans from urban centers while supporting rural hospitals with limited specialist availability. The shift was driven by rising demand for faster reporting and improved patient outcomes in both public and private healthcare sectors
- In November 2022, leading global teleradiology service providers expanded remote reporting networks across the Middle East and Africa, enabling 24/7 radiology coverage through offshore radiologist partnerships. These expansions helped hospitals manage increasing imaging volumes and reduce diagnostic delays, particularly in emergency care settings
- In July 2021, early-stage digital health programs in Egypt and Kenya strengthened adoption of teleradiology systems as part of national e-health modernization efforts. These initiatives focused on deploying basic PACS systems and remote diagnostic platforms in public hospitals to improve access to radiology services
SKU-

- Interactive Data Analysis Dashboard
- Company Analysis Dashboard for high growth potential opportunities
- Research Analyst Access for customization & queries
- Competitor Analysis with Interactive dashboard
- Latest News, Updates & Trend analysis
- Harness the Power of Benchmark Analysis for Comprehensive Competitor Tracking
Data collection and base year analysis are done using data collection modules with large sample sizes. The stage includes obtaining market information or related data through various sources and strategies. It includes examining and planning all the data acquired from the past in advance. It likewise envelops the examination of information inconsistencies seen across different information sources. The market data is analysed and estimated using market statistical and coherent models. Also, market share analysis and key trend analysis are the major success factors in the market report. To know more, please request an analyst call or drop down your inquiry.
The key research methodology used by DBMR research team is data triangulation which involves data mining, analysis of the impact of data variables on the market and primary (industry expert) validation. Data models include Vendor Positioning Grid, Market Time Line Analysis, Market Overview and Guide, Company Positioning Grid, Patent Analysis, Pricing Analysis, Company Market Share Analysis, Standards of Measurement, Global versus Regional and Vendor Share Analysis. To know more about the research methodology, drop in an inquiry to speak to our industry experts.
Data Bridge Market Research is a leader in advanced formative research. We take pride in servicing our existing and new customers with data and analysis that match and suits their goal. The report can be customized to include price trend analysis of target brands understanding the market for additional countries (ask for the list of countries), clinical trial results data, literature review, refurbished market and product base analysis. Market analysis of target competitors can be analyzed from technology-based analysis to market portfolio strategies. We can add as many competitors that you require data about in the format and data style you are looking for. Our team of analysts can also provide you data in crude raw excel files pivot tables (Fact book) or can assist you in creating presentations from the data sets available in the report.


