
Middle East And Africa Women Nutrition Market
Market Size in USD Thousand
 USD
915.77 Thousand
USD
1,492.98 Thousand
2025
2033
USD
915.77 Thousand
USD
1,492.98 Thousand
2025
2033
| 2026 - 2033 | |
| USD 915.77 Thousand | |
| USD 1,492.98 Thousand | |
| % | |
|
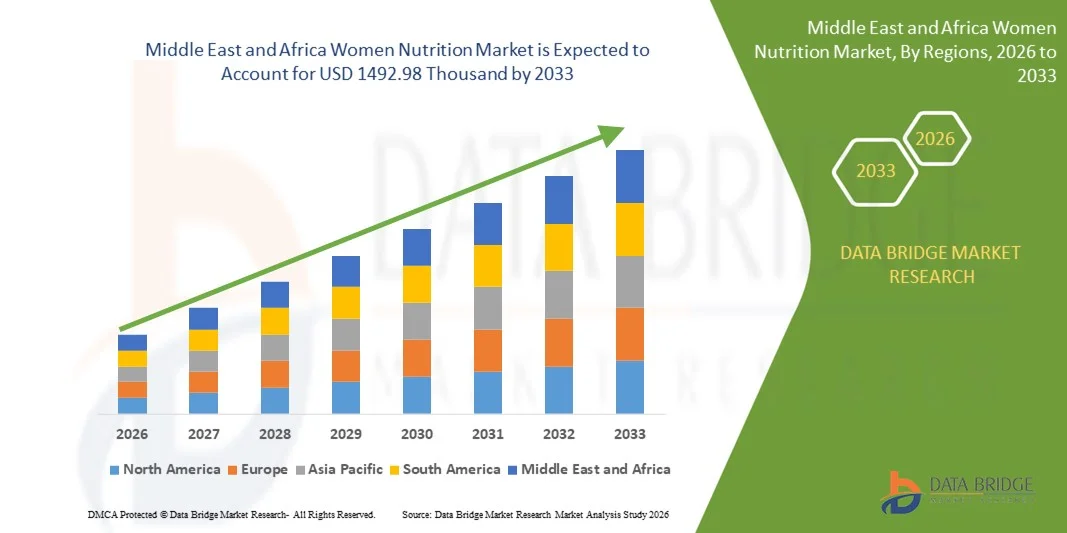
Middle East and Africa Women Nutrition Market Size
- The Middle East and Africa women nutrition market size was valued at USD 915.77 thousand in 2025 and is expected to reach USD 1492.98 thousand by 2033, at a CAGR of 6.3% during the forecast period
- The women nutrition market growth is largely driven by increasing awareness regarding female health needs, hormonal balance, bone strength, and preventive wellness across different life stages. Rising lifestyle-related deficiencies, evolving dietary habits, and growing concern for long-term health outcomes such as osteoporosis, metabolic disorders, and immunity imbalances are strengthening demand for targeted nutritional solutions tailored specifically to women
- Furthermore, the increasing availability of science-backed supplements, clean-label formulations, and condition-specific nutritional products is encouraging higher consumer adoption. These converging factors, supported by greater health education, influencer-led awareness, and clinical recommendations, are accelerating market expansion and reinforcing nutrition as an essential component of women’s everyday health management
Middle East and Africa Women Nutrition Market Analysis
- Women nutrition solutions, including supplements, functional foods, and personalized health formulations, are becoming essential for supporting hormonal health, reproductive wellness, fitness goals, and age-related nutritional needs across diverse population groups. The market continues to gain momentum as women increasingly prioritize proactive wellness, beauty-from-within solutions, and long-term health optimization
- The rising demand for women-focused nutrition is propelled by growing emphasis on preventative healthcare, the shift toward personalized and clean-label ingredients, and increasing adoption of digital wellness platforms that guide purchasing and consumption. These market drivers, along with growing investment from global nutraceutical brands, are contributing to sustained growth and wider accessibility of specialized women nutrition products
- U.A.E. dominated the women nutrition market in 2025, due to strong consumer awareness of wellness, rising demand for hormonal health supplements, and a growing focus on preventive health among women across different age groups. High purchasing power, premium product availability, and increasing adoption of fortified foods and personalized nutrition programs further reinforce the country’s dominance in the regional market
- Saudi Arabia is expected to be the fastest growing country in the women nutrition market during the forecast period due to rising investment in women’s health, increasing awareness of nutrition-based disease prevention, and a growing trend toward weight management and hormonal balance supplements
- Solid segment dominated the market with a market share of 67.8% in 2025, due to high consumer familiarity, longer shelf life, portability, and convenience associated with tablets, capsules, soft gels, powders, and gummies. Solid supplement types are preferred for long-term and preventive nutritional routines including multivitamins, minerals, and hormonal balance supplements which enhances their market share. Large-scale retail presence and brand variety further strengthen the leading position of solid formats in daily supplementation habits
Report Scope and Women Nutrition Market Segmentation
|
Attributes |
Women Nutrition Key Market Insights |
|
Segments Covered |
|
|
Countries Covered |
Middle East and Africa
|
|
Key Market Players |
|
|
Market Opportunities |
|
|
Value Added Data Infosets |
In addition to the insights on market scenarios such as market value, growth rate, segmentation, geographical coverage, and major players, the market reports curated by the Data Bridge Market Research also include in-depth expert analysis, pricing analysis, brand share analysis, consumer survey, demography analysis, supply chain analysis, value chain analysis, raw material/consumables overview, vendor selection criteria, PESTLE Analysis, Porter Analysis, and regulatory framework. |
Middle East and Africa Women Nutrition Market Trends
Rising Adoption of Personalized and Condition-Specific Women’s Nutrition
- The growing shift toward personalized nutrition solutions for women is becoming a major trend due to an increasing emphasis on tailored health needs. Consumers are opting for products based on age, hormonal cycles, genetics, and lifestyle to achieve better results and overall body balance
- For instance, brands such as Ritual are introducing women-specific supplements designed for pregnancy, fertility, PMS support, and menopause to ensure targeted nutrient intake. This trend is accelerating product innovations that address stage-wise nutritional gaps rather than generalized formulas
- Hormonal balance supplements are gaining attention as women increasingly seek support for PCOS, PMS, metabolism, and stress-induced imbalances. The rising demand is driven by a higher awareness of endocrine disorders and how nutrition influences hormonal wellbeing
- Clean-label and plant-based nutrition is expanding as consumers prefer transparent formulas without synthetic additives or allergens. This trend is supported by growing trust in natural ingredients such as probiotics, seed extracts, and adaptogens for long-term health
- Digital health integration is rising as AI-based dietary solutions, trackers, and tele-nutrition platforms enable personalized nutrient planning. This shift supports better adherence to routines and increases the consumer engagement rate for women's nutrition products
- The trend concludes with an ecosystem shift toward individualized nutrition addressing hormonal, reproductive, metabolic, and lifestyle demands of women rather than generic dietary solutions. This evolution is aligning product development with evidence-backed personalization and long-term wellness outcomes
Middle East and Africa Women Nutrition Market Dynamics
Driver
Increasing Focus on Preventive Health and Hormonal Wellness
- The driver emerges from a rising focus on prevention-oriented health routines as women aim to avoid chronic illnesses and long-term deficiencies. Consumers are willing to invest in nutrition solutions that strengthen immunity, bone health, and metabolic performance before symptoms arise
- For instance, companies such as Garden of Life are offering preventive health supplements focusing on vitamins, minerals, probiotics, and hormonal balance to avoid deficiencies and future complications. This supports strong market momentum toward proactive wellbeing solutions rather than corrective treatments
- Awareness around hormonal wellness is increasing due to growing cases of PCOS, thyroid imbalance, PMS sensitivity, and perimenopause symptoms. As women understand the role of micronutrients and nutraceuticals in regulating hormones, demand for preventive formulations continues rising
- Rising digital education and access to health data is strengthening confidence in preventive nutrition as women better understand deficiencies through blood tests and wellness tracking. This drives higher product adoption with measurable outcomes in hormonal and nutritional wellness
- The driver concludes with a market transition toward a proactive lifestyle, where preventive health and hormonal balance support are becoming essential rather than optional. This shift is expected to continue strengthening demand for tailored nutritional solutions designed for long-term support
Restraint/Challenge
Limited Clinical Validation and Safety Transparency for Supplement Claims
- The challenge emerges from limited scientific validation for several women-focused supplements claiming hormonal, reproductive, or metabolic benefits. Lack of large-scale clinical trials creates uncertainty and limits consumer confidence, particularly in new or emerging formulations
- For instance, smaller supplement brands offering hormonal support gummies and adaptogen blends often lack controlled safety studies, ingredient standardization, and verified outcomes. This leads to skepticism among healthcare professionals and women seeking medically verified solutions
- Varying regulatory frameworks across countries create inconsistencies in safety assurance, labeling standards, and dosage transparency. This situation results in confusion for consumers regarding efficacy, purity grades, and potential long-term effects
- Increasing consumer awareness around supplement risks pushes demand for scientific proof and regulatory clarity, which many brands still fail to provide. Limited clinical backing reduces credibility, slows mass adoption, and restricts recommendations by medical practitioners
- The challenge concludes with the need for stronger research, standardized testing, and transparent communication to build trust and ensure validated outcomes. Addressing these gaps will be critical for supporting category reliability, safety acceptance, and long-term growth
Middle East and Africa Women Nutrition Market Scope
The market is segmented on the basis of type, product, dosage form, population type, mode of prescription, application, and distribution channel.
- By Type
On the basis of type, the women nutrition market is segmented into sports nutrition, dietary supplements, personalized nutrition, and others. The dietary supplements segment dominated the market in 2025, supported by increasing awareness of nutrient deficiencies among women driven by changing dietary patterns, hormonal fluctuations, and lifestyle stress. Women between reproductive and aging stages require enhanced nutrient intake for bone density, reproductive health, immunity, and cognitive performance which strengthens market leadership for supplements. In addition, the availability of supplement formats such as capsules, powders, and gummies supports wider consumer acceptance across age groups. Emotional wellbeing, stress reduction, and metabolism support categories continue expanding under this segment as women prioritize holistic health over symptomatic solutions. The rising influence of health education campaigns and wellness programs ensures that dietary supplements remain a top choice for preventive and supportive nutrition.
The personalized nutrition segment is expected to record the fastest growth rate from 2026 to 2033 due to rising demand for tailored health interventions based on genetics, lifestyle conditions, and biomarker analysis. Women are increasingly seeking nutrition plans aligned with menstrual cycle support, hormonal balance, weight management, and fertility, which personalized platforms provide through data-driven insights. In addition, AI-driven apps and subscription-based nutrition services are enabling customized meal planning and supplement delivery, making adoption more convenient. Growing acceptance of DNA testing kits and wearable health monitoring devices further accelerates segment expansion by offering real-time nutritional recommendations. The shift toward precision health, convenience-based consumption, and subscription ecosystems continues to redefine this category and drive its rapid expansion.
- By Product
On the basis of product, the market is segmented into vitamins, proteins, minerals, fluids, probiotics, omega 3, and others. The vitamins segment dominated the market in 2025 due to the widespread prevalence of micronutrient deficiencies in women across various age brackets including iron, folate, vitamin D, and B-complex groups. Women rely heavily on vitamin supplements to support immunity, energy metabolism, bone strength, reproductive health, and cognitive function which sustains demand momentum. The ease of availability, affordability, and strong clinical research backing vitamins as preventive healthcare solutions reinforce their leading position. In addition, government-led nutritional guidelines and fortified product innovations continue to support high-volume consumption within this category.
The probiotics segment is projected to register the fastest growth from 2026 to 2033 driven by increasing awareness of the gut microbiome’s role in immunity, hormonal stability, skin health, and digestive wellness among women. Probiotics are gaining preference due to their proven benefits in areas such as PCOS management, pregnancy wellness, urinary tract health, and gut flora restoration after antibiotic use. The segment’s momentum is accelerated by innovations such as strain-specific blends, functional beverages, chewables, and synbiotic formulations improving both accessibility and convenience. Rising healthcare professional recommendations, clinical evidence, and consumer demand for natural solutions reinforce the fast-paced growth outlook.
- By Dosage Form
On the basis of dosage form, the women nutrition market is segmented into solid and liquid. The solid dosage form dominated the market with the largest share of 67.8% in 2025 supported by high consumer familiarity, longer shelf life, portability, and convenience associated with tablets, capsules, soft gels, powders, and gummies. Solid supplement types are preferred for long-term and preventive nutritional routines including multivitamins, minerals, and hormonal balance supplements which enhances their market share. Large-scale retail presence and brand variety further strengthen the leading position of solid formats in daily supplementation habits.
The liquid dosage form is anticipated to grow at the fastest rate from 2026 to 2033 due to increasing preference for rapid absorption, easy consumption, and suitability for women with swallowing difficulties or digestive sensitivity. Liquid nutrition formats are especially popular in sports nutrition, protein shakes, gut health beverages, and functional ready-to-drink formulations. Innovations in taste enhancement, shelf-stable formulations, and personalized nutrient concentrates further boost appeal. The rising adoption of on-the-go lifestyles among urban women supports segment acceleration during the forecast period.
- By Population Type
On the basis of population type, the market is segmented into adults and pregnant women. The adult women segment dominated the market in 2025 driven by rising focus on fitness, immunity, hormonal wellbeing, beauty-from-within supplements, and weight management nutrition. Increasing workforce participation, urbanization, and chronic lifestyle health concerns support consistent consumption across vitamins, proteins, minerals, and probiotic categories. The influence of social media, wellness influencers, and preventive health programs contributes significantly to segment leadership among adult consumers.
The pregnant women segment is expected to record the fastest growth rate from 2026 to 2033 due to increasing importance placed on prenatal and postnatal nutrition covering folate, omega-3, iron, calcium, and immunity support formulations. The adoption is expanding as healthcare systems emphasize maternal nutrition screening and supplement compliance to avoid complications such as anemia, low birth weight, and postpartum deficiencies. Higher recommendations from gynecologists, digital maternity care programs, and subscription-based maternity nutrition kits accelerate growth.
- By Mode of Prescription
On the basis of mode of prescription, the market is segmented into prescription and over the counter (OTC). The over-the-counter segment dominated the market in 2025 owing to the accessibility, availability, affordability, and purchasing flexibility that OTC nutrition products provide across retail and online channels. Women increasingly prefer OTC products for daily wellness, lifestyle enhancements, and preventive healthcare without requiring clinical consultations. The growth of self-medication trends and digitally informed consumers further supports dominance of this category.
The prescription segment is projected to grow at the fastest rate from 2026 to 2033 driven by increasing diagnosis of nutrient deficiencies, high-risk pregnancies, thyroid disorders, PCOS, and chronic conditions requiring medical-grade nutrition. Prescription-based omega-3, iron complexes, therapeutic vitamins, and gut health formulations are gaining traction under clinician guidance. Growing trust in regulated prescription products due to efficacy, standardization, and medical oversight contributes significantly to increasing adoption.
- By Application
The women nutrition market is segmented into energy and weight management, bone and joint health, immunity, cardiac health, diabetes, gastrointestinal health, ophthalmic disorders, neurological diseases, and others. The energy and weight management segment dominated the market in 2025 due to rising obesity prevalence, metabolic disorders, and increasing participation in fitness and athletic activities among women. Demand is supported by proteins, sports nutrition blends, metabolism boosters, and appetite regulation supplements widely marketed through retail and online channels. Women are increasingly focused on maintaining strength, energy balance, and muscle preservation, reinforcing segment leadership.
The gastrointestinal health segment is expected to witness the fastest growth during 2026–2033 driven by increased awareness of gut microbiome balance influenced by diet, stress, hormonal cycles, and medication use. Products such as probiotics, digestive enzymes, prebiotics, and synbiotics are seeing accelerated adoption due to improved clinical recognition of gut health in managing immunity, hormonal regulation, mental health, and metabolic function.
- By Distribution Channel
On the basis of distribution channel, the women nutrition market is segmented into hypermarkets/supermarkets, pharmacies/drugstores, specialty stores, online, and others. The pharmacies/drugstores segment dominated the market in 2025 due to trust, product authenticity, medical guidance availability, and easy access to both prescription and OTC products. Women rely on pharmacy-based purchases particularly for condition-specific supplements, prenatal formulations, and therapeutic vitamins which continue to reinforce strong demand.
The online segment is projected to grow fastest from 2026 to 2033 driven by convenience, subscription models, broader product variety, and targeted digital marketing strategies. Mobile-based wellness platforms, health tracking apps, and e-commerce health marketplaces are accelerating adoption among tech-driven and wellness-conscious consumers.
Middle East and Africa Women Nutrition Market Regional Analysis
- U.A.E. dominated the women nutrition market with the largest revenue share in 2025, driven by strong consumer awareness of wellness, rising demand for hormonal health supplements, and a growing focus on preventive health among women across different age groups. High purchasing power, premium product availability, and increasing adoption of fortified foods and personalized nutrition programs further reinforce the country’s dominance in the regional market
- The rapid expansion of digital health platforms, pharmacy-led nutrition retail, and collaborations between international supplement brands and regional distributors continue to strengthen accessibility and product diversity. Rising demand for pregnancy care supplements, beauty-from-within nutrition, and menopause-focused products aligns with evolving consumer priorities, helping U.A.E. maintain its leading position
- Government-supported health education, growing influence of fitness culture, and increasing adoption of clinically validated supplements contribute to a strong long-term market outlook. The nation’s focus on high-quality nutrition, innovation, and lifestyle-driven wellness continues to support its dominance across the forecast timeline
Saudi Arabia Women Nutrition Market Insight
Saudi Arabia is projected to register the fastest CAGR in the Middle East and Africa women nutrition market from 2026 to 2033, fueled by rising investment in women’s health, increasing awareness of nutrition-based disease prevention, and a growing trend toward weight management and hormonal balance supplements. Expanding retail channels, government-led wellness initiatives, and growing consumption of vitamins, probiotics, and maternal health supplements reflect the accelerating market demand. Increasing participation of women in fitness, rising disposable income, and greater acceptance of supplement-based health support position Saudi Arabia as the fastest-growing market in the region.
South Africa Women Nutrition Market Insight
South Africa is expected to experience strong growth between 2026 and 2033, driven by increasing adoption of supplements for immune health, reproductive wellness, and micronutrient deficiency management among women. Expanding availability of affordable nutrition products, growing influence of healthcare professionals, and rising awareness of healthy aging and bone strength solutions are contributing to higher consumption. Strengthening e-commerce penetration, health education programs, and the presence of regional and international brands targeting localized nutrition gaps support steady market development. South Africa’s growing interest in accessible, science-backed women wellness solutions underpins its rising position within the regional market.
Middle East and Africa Women Nutrition Market Share
The women nutrition industry is primarily led by well-established companies, including:
- Abbott (U.S.)
- Optimum Nutrition, Inc. (U.S.)
- GNC Holdings, LLC (U.S.)
- Amway (U.S.)
- ADM (U.S.)
- Hamilton Thorne Health Solutions (U.S.)
- Bayer AG (U.S.)
- DANONE (France)
- BHI Biohealth International GmbH (Austria)
- NOW Foods: (U.S.)
- Swisse Wellness PTY LTD (Australia)
- Gaia Herbs (U.S.)
- Unilever (U.K.)
- Nestlé (Switzerland)
- La Nature's (India)
- Herbalife International of America, Inc. (U.S.)
- GSK plc (U.K.)
- General Mills Inc. (U.S.)
- Kellogg Co. (U.S.)
Latest Developments in Middle East and Africa Women Nutrition Market
- In April 2025, Tranont unveiled a new series of women’s health supplements focused on enhancing muscle strength, energy, and hormonal balance. The product line includes a menopause-supporting formula containing EstroG-100 and ashwagandha, a digestion-friendly clear whey protein, and a creatine supplement tailored for women over 30 experiencing age-related muscle decline. This strategic launch demonstrates Tranont’s expansion into specialized nutrition, responding to the increasing recognition of age-specific health requirements among women. It also strengthens the brand’s position in premium functional wellness offerings designed for long-term physiological support
- In January 2025, GNC introduced Premier Collagen, a beauty supplement line with two specialized formulas in multiple formats, designed to promote youthful-looking skin and overall beauty from within. This initiative marks GNC’s expansion into the growing beauty-from-within nutraceuticals market where consumers increasingly seek ingestible solutions for skin elasticity, hydration, and cellular repair. The launch aligns with evolving beauty trends prioritizing internal nutrition alongside topical skincare for comprehensive appearance enhancement
- In January 2025, Bayer Consumer Health entered the U.K. menopause market with CanesMeno, offering a comprehensive range of scientifically-supported products along with a digital education resource to assist around 13 million perimenopausal and menopausal women in managing their symptoms effectively. This launch strengthens Bayer’s footprint in the women’s health segment in Europe and reflects the growing demand for menopause-focused solutions driven by rising awareness and unmet therapeutic needs. The introduction of both product and educational support highlights Bayer’s holistic approach to empowering women with trusted health tools during hormonal transition phases
- In September 2024, Otsuka Pharmaceutical Co., Ltd. and Bonafide Health, LLC jointly launched Thermella in the U.S., a plant-based supplement created to support women’s health during menopause, available exclusively through Bonafide Health’s digital platform. This collaboration underscores both companies’ dedication to addressing hormonal health naturally and caters to a growing consumer base seeking non-hormonal, clinically validated solutions to manage menopause symptoms. The digital-only availability highlights the rising importance of e-commerce and telehealth ecosystems in women’s health retail strategies
- In October 2020, Oziva launched HerBones, a 100% plant-based and vegan supplement formulated to support stronger bones, healthy joints, and balanced female hormones. Designed for women aged 25 and above, particularly those with calcium deficiency, this product reinforced Oziva’s focus on preventive women’s health solutions. The launch contributed to rising demand for clean-label, plant-based supplements driven by consumers seeking safer alternatives free from synthetic additives and animal-derived ingredients
SKU-

- Interactive Data Analysis Dashboard
- Company Analysis Dashboard for high growth potential opportunities
- Research Analyst Access for customization & queries
- Competitor Analysis with Interactive dashboard
- Latest News, Updates & Trend analysis
- Harness the Power of Benchmark Analysis for Comprehensive Competitor Tracking
Middle East And Africa Women Nutrition Market, Supply Chain Analysis and Ecosystem Framework
To support market growth and help clients navigate the impact of geopolitical shifts, DBMR has integrated in-depth supply chain analysis into its Middle East And Africa Women Nutrition Market research reports. This addition empowers clients to respond effectively to global changes affecting their industries. The supply chain analysis section includes detailed insights such as Middle East And Africa Women Nutrition Market consumption and production by country, price trend analysis, the impact of tariffs and geopolitical developments, and import and export trends by country and HSN code. It also highlights major suppliers with data on production capacity and company profiles, as well as key importers and exporters. In addition to research, DBMR offers specialized supply chain consulting services backed by over a decade of experience, providing solutions like supplier discovery, supplier risk assessment, price trend analysis, impact evaluation of inflation and trade route changes, and comprehensive market trend analysis.
Data collection and base year analysis are done using data collection modules with large sample sizes. The stage includes obtaining market information or related data through various sources and strategies. It includes examining and planning all the data acquired from the past in advance. It likewise envelops the examination of information inconsistencies seen across different information sources. The market data is analysed and estimated using market statistical and coherent models. Also, market share analysis and key trend analysis are the major success factors in the market report. To know more, please request an analyst call or drop down your inquiry.
The key research methodology used by DBMR research team is data triangulation which involves data mining, analysis of the impact of data variables on the market and primary (industry expert) validation. Data models include Vendor Positioning Grid, Market Time Line Analysis, Market Overview and Guide, Company Positioning Grid, Patent Analysis, Pricing Analysis, Company Market Share Analysis, Standards of Measurement, Global versus Regional and Vendor Share Analysis. To know more about the research methodology, drop in an inquiry to speak to our industry experts.
Data Bridge Market Research is a leader in advanced formative research. We take pride in servicing our existing and new customers with data and analysis that match and suits their goal. The report can be customized to include price trend analysis of target brands understanding the market for additional countries (ask for the list of countries), clinical trial results data, literature review, refurbished market and product base analysis. Market analysis of target competitors can be analyzed from technology-based analysis to market portfolio strategies. We can add as many competitors that you require data about in the format and data style you are looking for. Our team of analysts can also provide you data in crude raw excel files pivot tables (Fact book) or can assist you in creating presentations from the data sets available in the report.


