
Middle East And North Africa Effervescent Tablet Market
Market Size in USD Billion
 USD
294.87 Billion
USD
503.96 Billion
2024
2032
USD
294.87 Billion
USD
503.96 Billion
2024
2032
| 2025 - 2032 | |
| USD 294.87 Billion | |
| USD 503.96 Billion | |
| % | |
|
Middle East and North Africa Effervescent Tablet Market Size
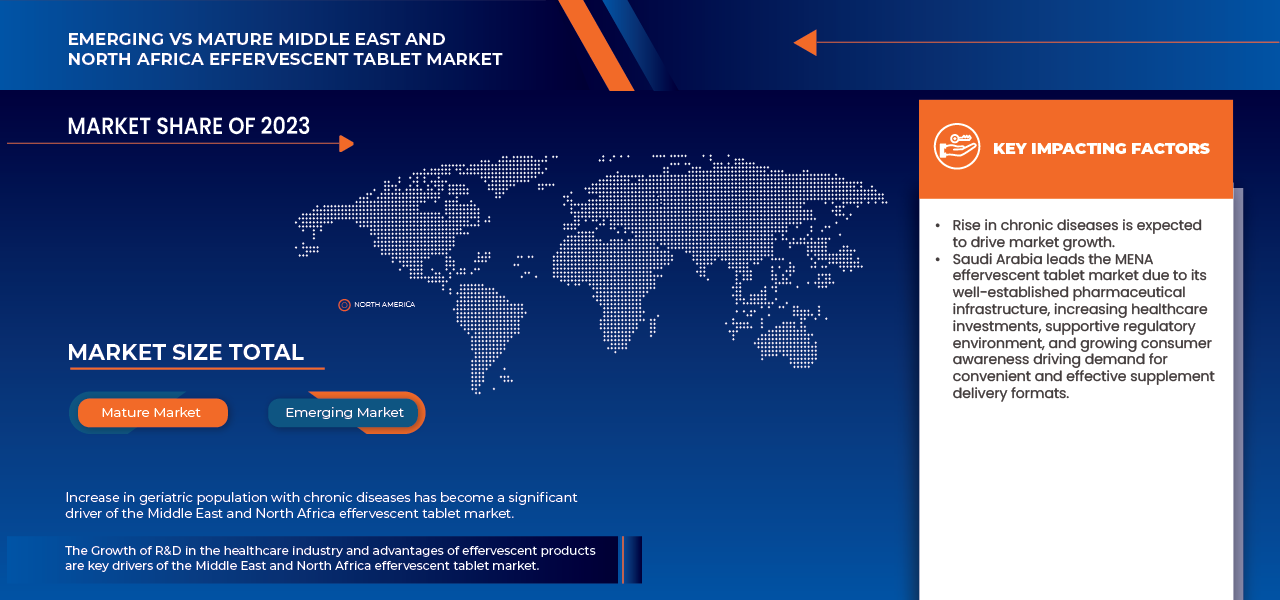
- The Middle East and North Africa Effervescent Tablet Market size was valued at USD 294.87 million in 2024 and is expected to reach USD 503.96 million by 2032, at a CAGR of 6.9% during the forecast period
- The market growth is largely fueled by the increasing prevalence of chronic diseases, such as cardiovascular disorders, digestive issues, and nutrient deficiencies, which drive consistent demand for convenient and rapid-dissolving oral supplements.
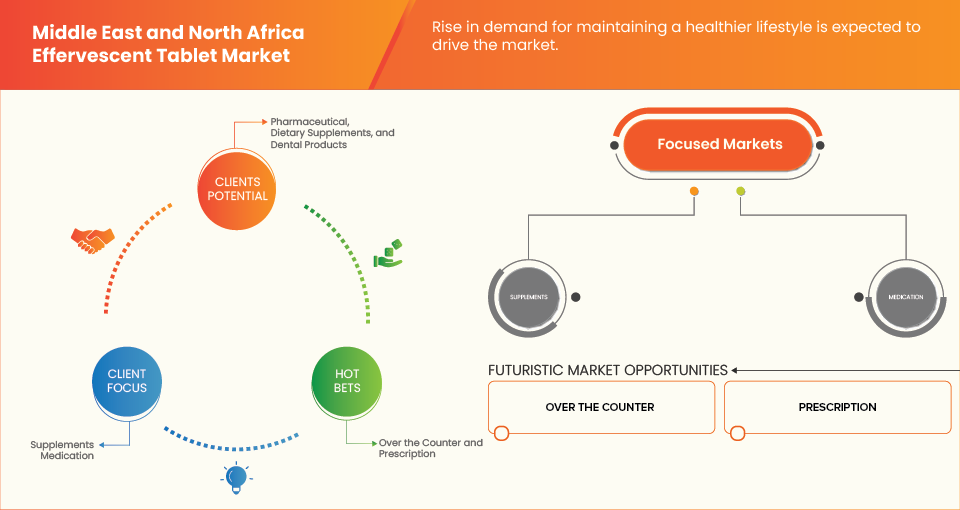
- Furthermore, rising health awareness and consumer preference for convenient dosage forms, coupled with the growing adoption of effervescent formulations in vitamins, minerals, and OTC medications, is positioning effervescent tablets as a preferred choice for faster absorption and improved compliance.
- Additionally, advancements in formulation technology enhancing taste, solubility, and stability are expanding the product range and accessibility, thereby accelerating the uptake of effervescent tablet solutions and significantly boosting the industry’s growth.
Middle East and North Africa Effervescent Tablet Market Analysis
- Effervescent tablet, designed for effective post-operative wound management and fluid evacuation, is becoming an essential component of home-based healthcare in the MENA region due to its role in preventing infections, promoting faster healing, and reducing hospital readmissions.
- The increasing demand for effervescent tablet in MENA is primarily driven by the rising prevalence of chronic diseases, the growing number of surgical procedures, and a patient preference for convenient, cost-effective home recovery solutions, supported by ongoing advancements in medical devices and technology.
- South Africa dominated the Middle East and North Africa Effervescent Tablet Market with the largest market share of 19.59% in 2025, owing to its well-established healthcare system, increasing consumer preference for convenient and fast-dissolving medication formats, and rising awareness of preventive healthcare. Strong retail penetration and growing adoption of vitamin and electrolyte supplements further support market growth
- South Africa is expected to be the fastest-growing country in the Middle East and North Africa Effervescent Tablet Market during the forecast period, registering a CAGR of 8.3% driven by driven by improving healthcare access, increasing awareness of infection control, and expanding investments in home healthcare facilities
- The supplements segment is expected to dominate the market, accounting for 57.31% market share in 2025, owing to the rising consumer preference for convenient, fast-dissolving nutritional products and the growing use of effervescent vitamins, minerals, and wellness supplements for daily health maintenance.
Report Scope and Middle East and North Africa Effervescent Tablet Market Segmentation
|
Attributes |
Effervescent Tablet Key Market Insights |
|
Segments Covered |
|
|
Countries Covered |
Middle East & North Africa
|
|
Key Market Players |
|
|
Market Opportunities |
|
|
Value Added Data Infosets |
In addition to the insights on market scenarios such as market value, growth rate, segmentation, geographical coverage, and major players, the market reports curated by the Data Bridge Market Research also include depth expert analysis, patient epidemiology, pipeline analysis, pricing analysis, and regulatory framework. |
Middle East and North Africa Effervescent Tablet Market Trends
“Rise in Disposable Incomes”
- While cost sensitivity remains a challenge in some segments, rising disposable incomes across much of the MENA region are a primary driver for the effervescent nutraceutical and pharmaceutical market. This economic shift is transforming consumer behavior, enabling a move from essential, curative healthcare to proactive, premium wellness spending, thereby creating a fertile ground for value-added formats like effervescent tablets.
- This growing affluence allows consumers to prioritize convenience, user experience, and perceived efficacy over price. For instance, in 2023, The Dubai Health Authority's "Health and Wellness Report 2023" noted that 65% of residents who regularly use supplements prefer formats that integrate easily into their lifestyle, with effervescent tablets cited for their ease of use and pleasant consumption experience
- The rise in disposable incomes is a critical opportunity factor, empowering consumers to trade up to more expensive, convenient, and pleasant dosage forms. This trend not only drives current market growth but also encourages continued investment in product innovation, sophisticated marketing, and robust distribution networks tailored to the preferences of an increasingly affluent MENA population
Middle East and North Africa Effervescent Tablet Market Dynamics
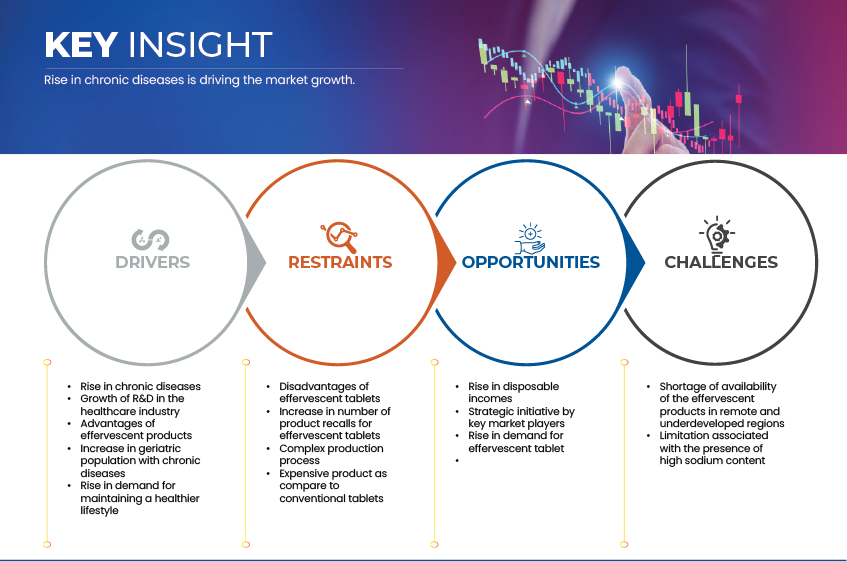
Driver
“Growth of R&D in the Healthcare Industry”
- The Middle East and North Africa (MENA) region has witnessed remarkable growth in healthcare Research and Development (R&D) over the past decade, driven by government-led innovation agendas, public–private partnerships, and increased investment in local pharmaceutical manufacturing. This growing emphasis on R&D is transforming the region from a traditional importer of pharmaceuticals into an emerging hub for biotech innovation and advanced formulation development, including effervescent tablets.
- The Gulf Cooperation Council (GCC) countries—particularly Saudi Arabia, the United Arab Emirates, and Qatar—have made healthcare innovation a core pillar of their national development strategies. Governments are encouraging local and international companies to establish research centers, formulation labs, and manufacturing facilities to strengthen self-sufficiency and diversify economic growth.
- For instance, In October 2024, According to Saudi Arabia’s Vision 2030 Health Sector Transformation Program, the government aims to localize 40% of pharmaceutical manufacturing by 2030, supported by partnerships with global companies such as Sanofi, Pfizer, and GlaxoSmithKline (GSK). In 2023, Saudi’s King Abdullah International Medical Research Center (KAIMRC) allocated over USD 200 million to clinical research and pharmaceutical innovation projects.
- Overall, the expansion of healthcare R&D infrastructure in the Middle East and North Africa is not only enhancing local innovation but also reducing dependency on imports and enabling the production of advanced drug delivery systems. This evolving ecosystem positions the region as a promising growth center for the Middle East and North Africa Effervescent Tablet Market in the coming decade
Opportunity
“Strategic Initiative by Key Market Players”
- Proactive strategic initiatives by leading pharmaceutical and nutraceutical companies represent a major growth opportunity for the Middle East and North Africa Effervescent Tablet Market. These companies are not only expanding their product portfolios but also building localized ecosystems—including manufacturing, packaging, and retail partnerships—to improve access, affordability, and consumer trust. Their actions are directly addressing long-standing regional challenges such as import dependency, climate sensitivity, and limited consumer awareness.
- A key opportunity arises from localized production and packaging investments, which are reducing supply chain vulnerability and improving cost competitiveness
- For example, In September 2024, Sanofi Consumer Healthcare launched a co-branded marketing campaign with Nahdi Medical Company across Saudi Arabia to promote Doliprane Effervescent, leveraging Nahdi's extensive customer loyalty program.
- Overall, these strategic initiatives—spanning localization, retail integration, and digital engagement—are not only expanding product reach but also shaping consumer behavior. They position the MENA Middle East and North Africa Effervescent Tablet Market for sustained growth, fostering innovation, regional resilience, and stronger brand-consumer relationships
Restraint/Challenge
“Disadvantages of Effervescent Tablets”
- While effervescent tablets offer several advantages such as faster absorption and improved compliance, their adoption in the Middle East and North Africa (MENA) region is limited by certain formulation, cost, and health-related challenges. These disadvantages affect both manufacturers (in terms of production and logistics) and consumers (in terms of affordability and suitability), posing a restraint to market expansion.
- Effervescent tablets require specialized manufacturing facilities, moisture-controlled environments, and complex packaging materials such as aluminum blisters or moisture-proof tubes. The MENA region’s hot and humid climate, particularly in the Gulf countries, further complicates storage and transportation, leading to increased operational costs and reduced shelf life. Small- and medium-sized pharmaceutical companies in countries like Egypt, Jordan, and Morocco often face barriers to adopting such technologies due to high capital investment and lack of technical expertise
- Additionally, high production and packaging costs make effervescent tablets more expensive than traditional solid dosage forms. In markets like Morocco and Tunisia, where out-of-pocket healthcare spending remains high, the price-sensitive population tends to prefer cheaper alternatives such as conventional tablets or capsules. This pricing gap limits mass adoption outside premium urban markets.
- Furthermore, the lack of localized R&D and formulation expertise in many North African and Levant markets restricts the ability to develop regionally optimized effervescent products, resulting in continued dependence on imports from Europe and Asia
Middle East and North Africa Effervescent Tablet Market Scope
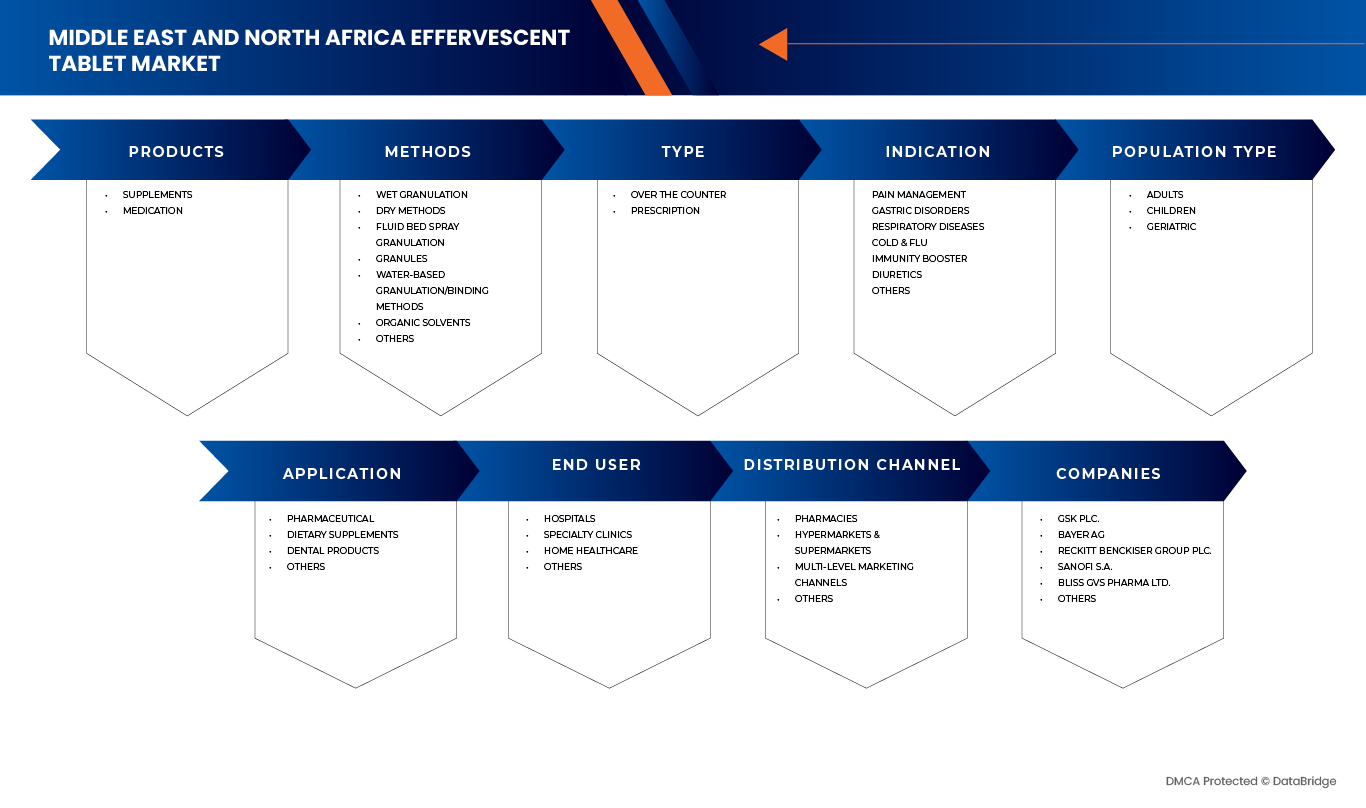
The market is segmented on the basis of products, methods, type, indication, population type, application, end user, distribution channel.
• By Product
On the basis of product, the Middle East and North Africa Effervescent Tablet Market is segmented into supplements and medication. The supplements segment IS dominated the global market, accounting for 57.31% in 2025, owing to the high adoption of effervescent tablets for post-operative hydration, electrolyte replenishment, and general wellness in home-based recovery. Patients and caregivers prefer supplements due to ease of use, fast absorption, and minimal side effects compared to conventional medications, making this segment the primary revenue contributor.
The medication segment is expected to witness the fastest CAGR of 7.1% from 2025 to 2032, driven by increasing demand for effervescent tablets as a delivery form for prescription post-operative medications, growing awareness of targeted therapeutic formulations, and rising adoption of minimally invasive surgeries across the MENA region. Additionally, innovations in flavored, pre-dosed, and patient-friendly effervescent medication formats are enhancing compliance and accelerating market growth.
• By Methods
On the basis of methods, the Middle East and North Africa Effervescent Tablet Market is segmented into wet granulation, dry methods, fluid bed spray granulation, granules, water‑based granulation/binding methods, organic solvents, others. The wet granulation segment held the dominant market share of 39.00% in 2025, primarily due to its ability to produce effervescent tablets with superior compressibility, uniformity, and faster dissolution rates. This method is widely preferred by manufacturers in the MENA region for high-volume production of patient-friendly effervescent tablets, ensuring consistent quality, stability, and effective post-operative hydration and medication delivery.
The dry methods segment is projected to witness the fastest CAGR of 7.2% between 2025 and 2032, attributed to increasing adoption of solvent-free, cost-effective, and environmentally friendly production techniques. Dry methods are gaining traction due to their suitability for moisture-sensitive active ingredients, reduced processing time, and lower energy consumption, making them ideal for emerging pharmaceutical and supplement manufacturers in the MENA region.
• By Type
On the basis of type, the Middle East and North Africa Effervescent Tablet Market is segmented into over the counter, prescription. The over the counter segment dominated the market in 2025 with a market share of 72.34%, owing to high consumer preference for convenient, easy-to-use effervescent supplements and medications that do not require prescriptions. The popularity of OTC effervescent tablets is driven by growing awareness of post-operative hydration, electrolyte replenishment, and general wellness, as well as ease of availability through pharmacies, retail stores, and online channels.
The over the counter segment is anticipated to record the fastest CAGR of 7.0% from 2025 to 2032, driven by increasing adoption of effervescent formulations for targeted post-operative medications, growing awareness among healthcare providers of their fast absorption and patient-friendly characteristics, and the rise of minimally invasive surgeries across the MENA region. Additionally, innovative prescription effervescent products with improved taste, pre-dosing, and safety features are enhancing patient compliance and accelerating market growth.
• By Indication
On the basis of indication, the Middle East and North Africa Effervescent Tablet Market is segmented into pain management, gastric disorders, respiratory diseases, cold & flu, immunity booster, diuretics, others. The pain management segment dominated the market in 2025 with a market share of 31.90%, owing to high prevalence of post-operative pain, musculoskeletal disorders, and chronic conditions in the region. Effervescent tablets are preferred for pain management because they offer rapid absorption, ease of administration, and reduced gastrointestinal irritation compared to conventional oral tablets, making them highly suitable for home-based recovery and patient convenience.
The gastric disorders segment is anticipated to record the fastest CAGR of 7.3% from 2025 to 2032, driven by increasing incidence of acid reflux, ulcers, and dyspepsia in the MENA region, coupled with growing preference for effervescent formulations that provide fast relief and better tolerance. Additionally, rising awareness of digestive health, easier patient compliance, and availability of flavored, pre-dosed effervescent tablets are accelerating the adoption of these products for gastric disorders.
• By Population Type
On the basis of population type, the Middle East and North Africa Effervescent Tablet Market is segmented into adults, children, geriatric. The adults segment dominated the market in 2025 with a market share of 68.14%, owing to high prevalence of chronic diseases, post-operative recovery needs, and widespread use of dietary supplements and medications among adults. Effervescent tablets are preferred by adults because they offer rapid absorption, convenience, and reduced gastrointestinal discomfort compared to traditional tablets, making them ideal for home-based healthcare and post-surgical management.
The children segment is anticipated to record the fastest CAGR of 7.1% from 2025 to 2032, driven by rising awareness among parents regarding nutritional supplementation, post-operative care, and hydration for children, as well as the increasing availability of flavored, pre-dosed, and easy-to-administer effervescent tablets tailored for pediatric patients. Additionally, school health programs and pediatric healthcare initiatives in the MENA region are boosting market adoption in this segment.
• By Application
On the basis of application, the Middle East and North Africa Effervescent Tablet Market is segmented into pharmaceutical, dietary supplements, dental products, others. The pharmaceutical segment dominated the market in 2025 with a market share of 45.22%, owing to high demand for effervescent formulations for post-operative care, pain management, and targeted drug delivery. Effervescent tablets are preferred in pharmaceuticals because they ensure rapid absorption, precise dosing, improved patient compliance, and reduced gastrointestinal side effects, making them ideal for home-based recovery and hospital-to-home transitions.
The dietary supplements segment is anticipated to record the fastest CAGR of 7.2% from 2025 to 2032, driven by growing health and wellness awareness, increasing adoption of effervescent vitamins and minerals, and preference for convenient, fast-dissolving formulations. Additionally, rising post-operative supplementation, immune support, and hydration needs across all age groups in the MENA region are boosting market adoption of effervescent supplements.
• By End User
On the basis of end user, the Middle East and North Africa Effervescent Tablet Market is segmented into hospitals, specialty clinics, home healthcare, others. The hospitals segment dominated the market in 2025 with a market share of 49.19%, owing to high demand for effervescent tablets in post-operative care, pain management, and rapid drug administration within hospital settings. Hospitals prefer effervescent formulations because they enable precise dosing, faster absorption, improved patient compliance, and reduced risk of gastrointestinal irritation, making them essential for efficient patient management and faster recovery in both surgical and general care units.
The specialty clinics segment is anticipated to record the fastest CAGR of 7.3% from 2025 to 2032, driven by increasing adoption of minimally invasive surgeries, specialized outpatient procedures, and targeted treatments in cardiology, orthopedics, and oncology clinics. Additionally, rising patient preference for home-based care post-discharge and the availability of convenient, ready-to-use effervescent tablets in specialty clinics are accelerating market growth in this segment.
• By Distribution Channel
On the basis of distribution channel, the Middle East and North Africa Effervescent Tablet Market is segmented into pharmacies, hypermarkets & supermarkets, multi‐level marketing channels, others. The pharmacies segment dominated the market in 2025 with a market share of 47.73%, owing to easy accessibility, professional guidance from pharmacists, and high trust among consumers for pharmaceutical-grade effervescent tablets. Pharmacies are preferred because they ensure product authenticity, proper dosing instructions, and immediate availability for both prescription and over-the-counter effervescent formulations, making them a key channel for adult and pediatric consumers seeking safe and effective healthcare solutions.
The hypermarkets & supermarkets segment is anticipated to record the fastest CAGR of 7.2% from 2025 to 2032, driven by growing consumer preference for convenient, one-stop shopping experiences, increasing awareness of health supplements, and expanding retail networks in urban and semi-urban areas. Additionally, promotional activities, in-store visibility, and the availability of flavored and ready-to-use effervescent tablets are further accelerating adoption through this channel.
Middle East and North Africa Effervescent Tablet Market Regional Analysis
- South Africa dominated the Middle East and North Africa Effervescent Tablet Market with the largest market share of 19.59% in 2025, driven by advanced healthcare infrastructure, rising surgical volumes, and increasing patient preference for home-based post-operative recovery.
- The region’s expansion is further supported by favorable insurance coverage, government initiatives promoting home healthcare, and the presence of major medical device and pharmaceutical companies offering patient-friendly effervescent solutions
- In particular, the growing adoption of portable, easy-to-use, and pre-dosed effervescent tablets for hydration and electrolyte management during home recovery is improving patient outcomes, enhancing convenience, and fueling adoption across the region.
Saudi Arabia Middle East and North Africa Effervescent Tablet Market Insight
The Saudi Arabia Middle East and North Africa Effervescent Tablet Market captured the largest market share in 2025 within the MENA region, attributed to a high rate of surgical procedures, increasing preference for home-based post-operative recovery, and the strong presence of regional device and pharmaceutical manufacturers. The growing adoption of pre-dosed, portable effervescent tablets for hydration and electrolyte management is enhancing patient outcomes and driving market growth. Furthermore, continuous innovation in patient-friendly formulations and easy-to-use delivery systems is contributing significantly to the market’s expansion.
United Arab Emirates Middle East and North Africa Effervescent Tablet Market Insight
The United Arab Emirates (UAE) Middle East and North Africa Effervescent Tablet Market is expected to grow steadily during the forecast period, supported by advanced healthcare infrastructure, rising awareness of infection prevention, and increasing adoption of minimally invasive surgeries. Hospitals and homecare providers are encouraging home-based recovery, where effervescent tablets for post-surgical hydration and fluid balance are essential. Additionally, innovations in taste, solubility, and user-friendly packaging are increasing patient acceptance and adherence.
South Africa Middle East and North Africa Effervescent Tablet Market Insight
The South Africa Middle East and North Africa Effervescent Tablet Market is witnessing robust growth, supported by improvements in healthcare infrastructure, increasing surgical rates, and rising awareness about home-based post-operative care. Hospitals and homecare providers are adopting convenient effervescent tablets for post-surgical fluid management and electrolyte replenishment. The availability of affordable, safe, and easy-to-use formulations is enhancing adoption among patients, while regional efforts to improve healthcare access are further fueling market expansion.
Middle East and North Africa Effervescent Tablet Market Insight
The MENA Middle East and North Africa Effervescent Tablet Market is expected to register a CAGR of 6.9% during 2025 to 2032, propelled by rapid improvements in healthcare infrastructure, increasing surgical procedures, and growing awareness of home-based recovery care. GCC countries such as Saudi Arabia and UAE are leading regional demand due to strong government support, insurance coverage, and established homecare services. North African countries such as Egypt are emerging markets benefiting from growing healthcare investments, patient education on home recovery, and increasing adoption of convenient effervescent tablet solutions. Technological advancements in formulation, pre-dosing, and portability are further boosting regional market adoption.
Middle East and North Africa Effervescent Tablet Market Share
The effervescent tablet industry is primarily led by well-established companies, including:
- GSK plc. (U.K.)
- Bayer AG (Germany)
- Reckitt Benckiser Group plc. (U.S.)
- Sanofi S.A. (France)
- Bliss GVS Pharma Ltd. (India)
- Hikma Pharmaceuticals PLC (U.K.)
- Sydler Remedies (India)
- Julphar (Gulf Pharmaceutical Industries) (U.A.E.)
- S. G. Biopharm Pvt. Ltd. (India)
- Jamjoom Pharma (Saudi Arabia)
- EIPICO (Egypt)
- Tabuk Pharmaceuticals (Saudi Arabia)
Latest Developments in Middle East and North Africa Effervescent Tablet Market
- In June 2024, Bayer Consumer Health has introduced Berocca Mind, a new addition to its expert nutritional supplement range. The innovative formula features the extract of Spanish sage, known for supporting memory and mental performance, helping consumers manage daily cognitive demands effectively. Formulated with 12 essential vitamins and minerals, including all eight B vitamins, magnesium, zinc, and iron, the effervescent tablets are designed to reduce fatigue and maintain normal cognitive function. Available in refreshing Berry and Lemon flavours, Berocca Mind is free from sugar, caffeine, and artificial colours or flavours, making it suitable for vegans.
- In 2025, The EIPICO 3 Modular Buildings have been officially handed over, marking a significant milestone in the company’s advanced manufacturing expansion. These facilities were constructed using the Modular Building Concept, under which fully designed and equipped modules were fabricated at Pharmadule’s overseas facilities and subsequently transported to Egypt for installation at the production site.
- In 2025, A cooperation agreement has been signed between the Supreme Council of University Hospitals and EIPICO Pharmaceuticals to advance the quality and organization of healthcare services across Egypt’s university hospitals. This collaboration supports the Council’s mission to elevate healthcare standards and ensure that citizens experience efficient, high-quality medical care. The initiative reinforces the Council’s commitment to building strategic partnerships with national institutions, the private sector, and civil society to enhance the overall performance of the university hospital system. It also highlights EIPICO Pharmaceuticals’ strong sense of social responsibility, demonstrated through its contribution to healthcare provider training and public health awareness programs aimed at improving community well-being.
- In 2025, Hikma Pharmaceuticals PLC has signed a USD 250 million financing agreement with the International Finance Corporation (IFC) to support the company’s ongoing expansion across the Middle East and North Africa. The six-year arrangement strengthens a partnership that has spanned four decades, focusing on advancing local pharmaceutical manufacturing, improving the resilience of medicine supply chains, and broadening patient access to quality healthcare solutions in emerging markets.
- In 2024, Tabuk Pharmaceutical Manufacturing Company has entered into an exclusive licensing partnership with Hanmi, a distinguished South Korean pharmaceutical company. The collaboration aims to introduce a range of innovative, value-added medicines throughout the Kingdom of Saudi Arabia and the Middle East and North Africa (MENA) region, thereby strengthening the regional healthcare landscape and supporting improved patient outcomes. According to the agreement, Hanmi will oversee the development and production of the medicines, while Tabuk Pharmaceuticals will obtain the marketing authorization and handle product registration, importation, and promotional activities within the designated markets.
SKU-

- Interactive Data Analysis Dashboard
- Company Analysis Dashboard for high growth potential opportunities
- Research Analyst Access for customization & queries
- Competitor Analysis with Interactive dashboard
- Latest News, Updates & Trend analysis
- Harness the Power of Benchmark Analysis for Comprehensive Competitor Tracking
Table of Content
1 INTRODUCTION
1.1 OBJECTIVES OF THE STUDY
1.2 MARKET DEFINITION
1.3 OVERVIEW OF MIDDLE EAST AND NORTH AFRICA EFFERVESCENT TABLET MARKET
1.4 LIMITATIONS
1.5 MARKETS COVERED
2 MARKET SEGMENTATION
2.1 MARKETS COVERED
2.2 GEOGRAPHICAL SCOPE
2.3 YEARS CONSIDERED FOR THE STUDY
2.4 CURRENCY AND PRICING
2.5 DBMR TRIPOD DATA VALIDATION MODEL
2.6 MULTIVARIATE MODELLING
2.7 PRIMARY INTERVIEWS WITH KEY OPINION LEADERS
2.8 DBMR MARKET POSITION GRID
2.9 MARKET END USER COVERAGE GRID
2.1 SECONDARY SOURCES
2.11 ASSUMPTIONS
3 EXECUTIVE SUMMARY
4 PREMIUM INSIGHTS
4.1 PESTAL ANALYSIS
4.2 PORTERS FIVE FORCES ANALYSIS
4.3 REGULATORY FRAMEWORK — MENA EFFERVESCENT TABLET MARKET
4.3.1 REGULATORY AUTHORITIES
4.3.2 REGULATORY SUBMISSIONS
4.3.3 INTERNATIONAL HARMONIZATION
4.3.4 COMPLIANCE AND QUALITY MANAGEMENT SYSTEMS
4.3.5 REGULATORY CHALLENGES AND STRATEGIES
4.4 VALUE CHAIN ANALYSIS
4.5 HEALTHCARE ECONOMY
4.5.1 HEALTHCARE EXPENDITURE
4.5.2 CAPITAL EXPENDITURE
4.5.3 CAPEX TRENDS
4.5.4 CAPEX ALLOCATION
4.5.5 FUNDING SOURCES
4.5.6 INDUSTRY BENCHMARKS
4.5.7 GDP RATION IN OVERALL GDP
4.5.8 HEALTHCARE SYSTEM STRUCTURE
4.5.9 GOVERNMENT POLICIES
4.5.10 ECONOMIC DEVELOPMENT
4.6 TECHNOLOGY ROADMAP
4.7 COST ANALYSIS BREAKDOWN
4.8 COST ANALYSIS BREAKDOWN
4.8.1 VALUE CHAIN COST CONCENTRATION
4.8.2 STRATEGIC COST OPTIMIZATION APPROACHES
4.9 INNOVATION TRACKER AND STRATEGIC ANALYSIS
4.9.1 MAJOR DEALS AND STRATEGIC ALLIANCES ANALYSIS
4.9.1.1 JOINT VENTURES
4.9.1.2 MERGERS AND ACQUISITIONS
4.9.1.3 LICENSING AND PARTNERSHIPS
4.9.1.4 TECHNOLOGY COLLABORATIONS
4.9.1.5 STRATEGIC DIVESTMENTS
4.9.2 NUMBER OF PRODUCTS IN DEVELOPMENT
4.9.3 STAGE OF DEVELOPMENT
4.9.4 TIMELINES AND MILESTONES
4.9.5 INNOVATION STRATEGIES AND METHODOLOGIES
4.9.6 RISK ASSESSMENT AND MITIGATION
4.9.7 FUTURE OUTLOOK
5 MARKET OVERVIEW
5.1 DRIVERS
5.1.1 RISE IN CHRONIC DISEASES
5.1.2 GROWTH OF R&D IN THE HEALTHCARE INDUSTRY
5.1.3 ADVANTAGES OF EFFERVESCENT PRODUCTS
5.1.4 INCREASE IN GERIATRIC POPULATION WITH CHRONIC DISEASES
5.2 RESTRAINTS
5.2.1 DISADVANTAGES OF EFFERVESCENT TABLETS
5.2.2 INCREASE IN NUMBER OF PRODUCT RECALLS FOR EFFERVESCENT TABLETS
5.2.3 EXPENSIVE PRODUCT AS COMPARE TO CONVENTIONAL TABLETS
5.3 OPPORTUNITIES
5.3.1 RISE IN DISPOSABLE INCOMES
5.3.2 STRATEGIC INITIATIVE BY KEY MARKET PLAYERS
5.3.3 RISE IN DEMAND FOR EFFERVESCENT TABLET
5.4 CHALLENGES
5.4.1 SHORTAGE OF AVAILABILITY OF THE EFFERVESCENT PRODUCTS IN REMOTE AND UNDERDEVELOPED REGIONS
5.4.2 LIMITATION ASSOCIATED WITH THE PRESENCE OF HIGH SODIUM CONTENT
6 MIDDLE EAST AND NORTH AFRICA EFFERVESCENT TABLET MARKET, BY PRODUCTS
6.1 OVERVIEW
6.2 SUPPLEMENTS
6.2.1 VITAMINS
6.2.2 MINERALS
6.2.3 OTHERS
6.3 MEDICATION
6.3.1 ANALGESICS
6.3.2 ANTACIDS
7 MIDDLE EAST AND NORTH AFRICA EFFERVESCENT TABLET MARKET, BY METHODS
7.1 OVERVIEW
7.2 WET GRANULATION
7.3 DRY METHODS
7.4 FLUID BED SPRAY GRANULATION
7.5 GRANULES
7.6 WATER‑BASED GRANULATION/BINDING METHODS
7.7 ORGANIC SOLVENTS
7.8 OTHERS
8 MIDDLE EAST AND NORTH AFRICA EFFERVESCENT TABLET MARKET, BY TYPE
8.1 OVERVIEW
8.2 OVER THE COUNTER
8.3 PRESCRIPTION
9 MIDDLE EAST AND NORTH AFRICA EFFERVESCENT TABLET MARKET, BY INDICATION
9.1 OVERVIEW
9.2 PAIN MANAGEMENT
9.3 GASTRIC DISORDERS
9.4 RESPIRATORY DISEASES
9.5 COLD & FLU
9.6 IMMUNITY BOOSTER
9.7 DIURETICS
9.8 OTHERS
10 MIDDLE EAST AND NORTH AFRICA EFFERVESCENT TABLET MARKET, BY POPULATION TYPE
10.1 OVERVIEW
10.2 ADULTS
10.3 CHILDREN
10.4 GERIATRIC
11 MIDDLE EAST AND NORTH AFRICA EFFERVESCENT TABLET MARKET, BY APPLICATION
11.1 OVERVIEW
11.2 PHARMACEUTICAL
11.3 DIETARY SUPPLEMENTS
11.4 DENTAL PRODUCTS
11.5 OTHERS
12 MIDDLE EAST AND NORTH AFRICA EFFERVESCENT TABLET MARKET, BY END USER
12.1 OVERVIEW
12.2 HOSPITALS
12.3 SPECIALTY CLINICS
12.4 HOME HEALTHCARE
12.5 OTHERS
13 MIDDLE EAST AND NORTH AFRICA EFFERVESCENT TABLET MARKET, BY DISTRIBUTION CHANNEL
13.1 OVERVIEW
13.2 PHARMACIES
13.3 HYPERMARKETS & SUPERMARKETS
13.4 MULTI‐LEVEL MARKETING CHANNELS
13.5 OTHERS
14 MIDDLE EAST AND NORTH AFRICA EFFERVESCENT TABLET MARKET, BY COUNTRY
14.1 OVERVIEW
14.1.1 SOUTH AFRICA
14.1.2 SAUDI ARABIA
14.1.3 UNITED ARAB EMIRATES
14.1.4 EGYPT
14.1.5 ISRAEL
14.1.6 ALGERIA
14.1.7 MOROCCO
14.1.8 TUNISIA
14.1.9 LIBYA
14.1.10 SUDAN
14.1.11 REST OF MIDDLE EAST & NORTH AFRICA
15 MIDDLE EAST AND NORTH AFRICA EFFERVESCENT TABLET MARKET: COMPANY LANDSCAPE
15.1 COMPANY SHARE ANALYSIS: MIDDLE EAST AND NORTH AFRICA
16 SWOT ANALYSIS
17 COMPANY PROFILES
17.1 GSK PLC
17.1.1 COMPANY SNAPSHOT
17.1.2 REVENUE ANALYSIS
17.1.3 PRODUCT PORTFOLIO
17.1.4 RECENT DEVELOPMENTS
17.2 BAYER AG
17.2.1 COMPANY SNAPSHOT
17.2.2 REVENUE ANALYSIS
17.2.3 PRODUCT PORTFOLIO
17.2.4 RECENT DEVELOPMENT
17.3 RECKITT PHARMA
17.3.1 COMPANY SNAPSHOT
17.3.2 REVENUE ANALYSIS
17.3.3 PRODUCT PORTFOLIO
17.3.4 RECENT DEVELOPMENTS
17.4 SANOFI
17.4.1 COMPANY SNAPSHOT
17.4.2 REVENUE ANALYSIS
17.4.3 PRODUCT PORTFOLIO
17.4.4 RECENT DEVELOPMENT
17.5 BLISS GVS PHARMA LTD.
17.5.1 COMPANY SNAPSHOT
17.5.2 REVENUE ANALYSIS
17.5.3 PRODUCT PORTFOLIO
17.5.4 RECENT DEVELOPMENTS
17.6 EIPICO
17.6.1 COMPANY SNAPSHOT
17.6.2 REVENUE ANALYSIS
17.6.3 PRODUCT PORTFOLIO
17.6.4 RECENT DEVELOPMENT
17.7 HIKMA PHARMACEUTICALS PLC
17.7.1 COMPANY SNAPSHOT
17.7.2 REVENUE ANALYSIS
17.7.3 PRODUCT PORTFOLIO
17.7.4 RECENT DEVELOPMENT
17.8 JAMJOOM PHARMA
17.8.1 COMPANY SNAPSHOT
17.8.2 REVENUE ANALYSIS
17.8.3 RODUCT PORTFOLIO
17.8.4 RECENT DEVELOPMENT
17.9 JULPHAR (GULF PHARMACEUTICAL INDUSTRIES)
17.9.1 COMPANY SNAPSHOT
17.9.2 REVENUE ANALYSIS
17.9.3 PRODUCT PORTFOLIO
17.9.4 RECENT DEVELOPMENT
17.1 S. G. BIOPHARM PVT. LTD.
17.10.1 COMPANY SNAPSHOT
17.10.2 PRODUCT PORTFOLIO
17.10.3 RECENT DEVELOPMENT
17.11 SYDLER REMEDIES
17.11.1 COMPANY SNAPSHOT
17.11.2 PRODUCT PORTFOLIO
17.11.3 RECENT DEVELOPMENT
17.12 TABUK PHARMACEUTICALS
17.12.1 COMPANY SNAPSHOT
17.12.2 PRODUCT PORTFOLIO
17.12.3 RECENT DEVELOPMENT
18 QUESTIONNAIRE
19 RELATED REPORTS
List of Table
TABLE 1 OVERALL COST COMPOSITION (INDICATIVE AVERAGE PER UNIT COST ALLOCATION)
TABLE 2 MIDDLE EAST AND NORTH AFRICA EFFERVESCENT TABLET MARKET, BY PRODUCTS, 2018-2032 (USD THOUSAND)
TABLE 3 TABLE 5 MIDDLE EAST AND NORTH AFRICA SUPPLEMENTS IN EFFERVESCENT TABLET MARKET, BY PRODUCTS, 2018-2032 (USD THOUSAND)
TABLE 4 MIDDLE EAST AND NORTH AFRICA VITAMINS IN EFFERVESCENT TABLET MARKET, BY TYPE, 2018-2032 (USD THOUSAND)
TABLE 5 MIDDLE EAST AND NORTH AFRICA VITAMINS IN EFFERVESCENT TABLET MARKET, BY BRANDS, 2018-2032 (USD THOUSAND)
TABLE 6 MIDDLE EAST AND NORTH AFRICA MINERALS IN EFFERVESCENT TABLET MARKET, BY TYPE, 2018-2032 (USD THOUSAND)
TABLE 7 MIDDLE EAST AND NORTH AFRICA MINERALS IN EFFERVESCENT TABLET MARKET, BY BRANDS, 2018-2032 (USD THOUSAND)
TABLE 8 MIDDLE EAST AND NORTH AFRICA OTHERS IN EFFERVESCENT TABLET MARKET, BY PRODUCTS, 2018-2032 (USD THOUSAND)
TABLE 9 MIDDLE EAST AND NORTH AFRICA MEDICATION IN EFFERVESCENT TABLET MARKET, BY PRODUCTS, 2018-2032 (USD THOUSAND)
TABLE 10 MIDDLE EAST AND NORTH AFRICA ANALGESICS IN EFFERVESCENT TABLET MARKET, BY TYPE, 2018-2032 (USD THOUSAND)
TABLE 11 MIDDLE EAST AND NORTH AFRICA ANALGESICS IN EFFERVESCENT TABLET MARKET, BY BRANDS, 2018-2032 (USD THOUSAND)
TABLE 12 MIDDLE EAST AND NORTH AFRICA ANTACIDS IN EFFERVESCENT TABLET MARKET, BY TYPE, 2018-2032 (USD THOUSAND)
TABLE 13 MIDDLE EAST AND NORTH AFRICA ANTACIDS IN EFFERVESCENT TABLET MARKET, BY BRANDS, 2018-2032 (USD THOUSAND)
TABLE 14 MIDDLE EAST AND NORTH AFRICA EFFERVESCENT TABLET MARKET, BY METHODS, 2018-2032 (USD THOUSAND)
TABLE 15 MIDDLE EAST AND NORTH AFRICA EFFERVESCENT TABLET MARKET, BY TYPE, 2018-2032 (USD THOUSAND)
TABLE 16 MIDDLE EAST AND NORTH AFRICA EFFERVESCENT TABLET MARKET, BY INDICATION, 2018-2032 (USD THOUSAND)
TABLE 17 MIDDLE EAST AND NORTH AFRICA EFFERVESCENT TABLET MARKET, BY POPULATION TYPE, 2018-2032 (USD THOUSAND)
TABLE 18 MIDDLE EAST AND NORTH AFRICA EFFERVESCENT TABLET MARKET, BY APPLICATION, 2018-2032 (USD THOUSAND)
TABLE 19 MIDDLE EAST AND NORTH AFRICA EFFERVESCENT TABLET MARKET, BY END USER, 2018-2032 (USD THOUSAND)
TABLE 20 MIDDLE EAST AND NORTH AFRICA EFFERVESCENT TABLET MARKET, BY DISTRIBUTION CHANNEL, 2018-2032 (USD THOUSAND)
TABLE 21 TABLE 23 MIDDLE EAST AND NORTH AFRICA PHARMACIES IN EFFERVESCENT TABLET MARKET, BY TYPE, 2018-2032 (USD THOUSAND)
TABLE 22 MIDDLE EAST AND NORTH AFRICA EFFERVESCENT TABLET MARKET, BY COUNTRY, 2018-2032 (USD THOUSAND)
TABLE 23 SOUTH AFRICA EFFERVESCENT TABLET MARKET, BY PRODUCTS, 2018-2032 (USD THOUSAND)
TABLE 24 SOUTH AFRICA SUPPLEMENTS IN EFFERVESCENT TABLET MARKET, BY PRODUCTS, 2018-2032 (USD THOUSAND)
TABLE 25 SOUTH AFRICA VITAMINS IN EFFERVESCENT TABLET MARKET, BY TYPE, 2018-2032 (USD THOUSAND)
TABLE 26 SOUTH AFRICA VITAMINS IN EFFERVESCENT TABLET MARKET, BY BRANDS, 2018-2032 (USD THOUSAND)
TABLE 27 SOUTH AFRICA MINERALS IN EFFERVESCENT TABLET MARKET, BY TYPE, 2018-2032 (USD THOUSAND)
TABLE 28 SOUTH AFRICA MINERALS IN EFFERVESCENT TABLET MARKET, BY BRANDS, 2018-2032 (USD THOUSAND)
TABLE 29 SOUTH AFRICA OTHERS IN EFFERVESCENT TABLET MARKET, BY PRODUCTS, 2018-2032 (USD THOUSAND)
TABLE 30 SOUTH AFRICA MEDICATION IN EFFERVESCENT TABLET MARKET, BY PRODUCTS, 2018-2032 (USD THOUSAND)
TABLE 31 SOUTH AFRICA ANALGESICS IN EFFERVESCENT TABLET MARKET, BY TYPE, 2018-2032 (USD THOUSAND)
TABLE 32 SOUTH AFRICA ANALGESICS IN EFFERVESCENT TABLET MARKET, BY BRANDS, 2018-2032 (USD THOUSAND)
TABLE 33 SOUTH AFRICA ANTACIDS IN EFFERVESCENT TABLET MARKET, BY TYPE, 2018-2032 (USD THOUSAND)
TABLE 34 SOUTH AFRICA ANTACIDS IN EFFERVESCENT TABLET MARKET, BY BRANDS, 2018-2032 (USD THOUSAND)
TABLE 35 SOUTH AFRICA EFFERVESCENT TABLET MARKET, BY METHODS, 2018-2032 (USD THOUSAND)
TABLE 36 SOUTH AFRICA EFFERVESCENT TABLET MARKET, BY TYPE, 2018-2032 (USD THOUSAND)
TABLE 37 SOUTH AFRICA EFFERVESCENT TABLET MARKET, BY INDICATION, 2018-2032 (USD THOUSAND)
TABLE 38 SOUTH AFRICA EFFERVESCENT TABLET MARKET, BY POPULATION TYPE, 2018-2032 (USD THOUSAND)
TABLE 39 SOUTH AFRICA EFFERVESCENT TABLET MARKET, BY APPLICATION, 2018-2032 (USD THOUSAND)
TABLE 40 SOUTH AFRICA EFFERVESCENT TABLET MARKET, BY END USER, 2018-2032 (USD THOUSAND)
TABLE 41 SOUTH AFRICA EFFERVESCENT TABLET MARKET, BY DISTRIBUTION CHANNEL, 2018-2032 (USD THOUSAND)
TABLE 42 SOUTH AFRICA EFFERVESCENT TABLET MARKET, BY TYPE, 2018-2032 (USD THOUSAND)
TABLE 43 SAUDI ARABIA EFFERVESCENT TABLET MARKET, BY PRODUCTS, 2018-2032 (USD THOUSAND)
TABLE 44 SAUDI ARABIA SUPPLEMENTS IN EFFERVESCENT TABLET MARKET, BY PRODUCTS, 2018-2032 (USD THOUSAND)
TABLE 45 SAUDI ARABIA VITAMINS IN EFFERVESCENT TABLET MARKET, BY TYPE, 2018-2032 (USD THOUSAND)
TABLE 46 SAUDI ARABIA VITAMINS IN EFFERVESCENT TABLET MARKET, BY BRANDS, 2018-2032 (USD THOUSAND)
TABLE 47 SAUDI ARABIA MINERALS IN EFFERVESCENT TABLET MARKET, BY TYPE, 2018-2032 (USD THOUSAND)
TABLE 48 SAUDI ARABIA MINERALS IN EFFERVESCENT TABLET MARKET, BY BRANDS, 2018-2032 (USD THOUSAND)
TABLE 49 SAUDI ARABIA OTHERS IN EFFERVESCENT TABLET MARKET, BY PRODUCTS, 2018-2032 (USD THOUSAND)
TABLE 50 SAUDI ARABIA MEDICATION IN EFFERVESCENT TABLET MARKET, BY PRODUCTS, 2018-2032 (USD THOUSAND)
TABLE 51 SAUDI ARABIA ANALGESICS IN EFFERVESCENT TABLET MARKET, BY TYPE, 2018-2032 (USD THOUSAND)
TABLE 52 SAUDI ARABIA ANALGESICS IN EFFERVESCENT TABLET MARKET, BY BRANDS, 2018-2032 (USD THOUSAND)
TABLE 53 SAUDI ARABIA ANTACIDS IN EFFERVESCENT TABLET MARKET, BY TYPE, 2018-2032 (USD THOUSAND)
TABLE 54 SAUDI ARABIA ANTACIDS IN EFFERVESCENT TABLET MARKET, BY BRANDS, 2018-2032 (USD THOUSAND)
TABLE 55 SAUDI ARABIA EFFERVESCENT TABLET MARKET, BY METHODS, 2018-2032 (USD THOUSAND)
TABLE 56 SAUDI ARABIA EFFERVESCENT TABLET MARKET, BY TYPE, 2018-2032 (USD THOUSAND)
TABLE 57 SAUDI ARABIA EFFERVESCENT TABLET MARKET, BY INDICATION, 2018-2032 (USD THOUSAND)
TABLE 58 SAUDI ARABIA EFFERVESCENT TABLET MARKET, BY POPULATION TYPE, 2018-2032 (USD THOUSAND)
TABLE 59 SAUDI ARABIA EFFERVESCENT TABLET MARKET, BY APPLICATION, 2018-2032 (USD THOUSAND)
TABLE 60 SAUDI ARABIA EFFERVESCENT TABLET MARKET, BY END USER, 2018-2032 (USD THOUSAND)
TABLE 61 SAUDI ARABIA EFFERVESCENT TABLET MARKET, BY DISTRIBUTION CHANNEL, 2018-2032 (USD THOUSAND)
TABLE 62 SAUDI ARABIA EFFERVESCENT TABLET MARKET, BY TYPE, 2018-2032 (USD THOUSAND)
TABLE 63 UNITED ARAB EMIRATES EFFERVESCENT TABLET MARKET, BY PRODUCTS, 2018-2032 (USD THOUSAND)
TABLE 64 UNITED ARAB EMIRATES SUPPLEMENTS IN EFFERVESCENT TABLET MARKET, BY PRODUCTS, 2018-2032 (USD THOUSAND)
TABLE 65 UNITED ARAB EMIRATES VITAMINS IN EFFERVESCENT TABLET MARKET, BY TYPE, 2018-2032 (USD THOUSAND)
TABLE 66 UNITED ARAB EMIRATES VITAMINS IN EFFERVESCENT TABLET MARKET, BY BRANDS, 2018-2032 (USD THOUSAND)
TABLE 67 UNITED ARAB EMIRATES MINERALS IN EFFERVESCENT TABLET MARKET, BY TYPE, 2018-2032 (USD THOUSAND)
TABLE 68 UNITED ARAB EMIRATES MINERALS IN EFFERVESCENT TABLET MARKET, BY BRANDS, 2018-2032 (USD THOUSAND)
TABLE 69 UNITED ARAB EMIRATES OTHERS IN EFFERVESCENT TABLET MARKET, BY PRODUCTS, 2018-2032 (USD THOUSAND)
TABLE 70 UNITED ARAB EMIRATES MEDICATION IN EFFERVESCENT TABLET MARKET, BY PRODUCTS, 2018-2032 (USD THOUSAND)
TABLE 71 UNITED ARAB EMIRATES ANALGESICS IN EFFERVESCENT TABLET MARKET, BY TYPE, 2018-2032 (USD THOUSAND)
TABLE 72 UNITED ARAB EMIRATES ANALGESICS IN EFFERVESCENT TABLET MARKET, BY BRANDS, 2018-2032 (USD THOUSAND)
TABLE 73 UNITED ARAB EMIRATES ANTACIDS IN EFFERVESCENT TABLET MARKET, BY TYPE, 2018-2032 (USD THOUSAND)
TABLE 74 UNITED ARAB EMIRATES ANTACIDS IN EFFERVESCENT TABLET MARKET, BY BRANDS, 2018-2032 (USD THOUSAND)
TABLE 75 UNITED ARAB EMIRATES EFFERVESCENT TABLET MARKET, BY METHODS, 2018-2032 (USD THOUSAND)
TABLE 76 UNITED ARAB EMIRATES EFFERVESCENT TABLET MARKET, BY TYPE, 2018-2032 (USD THOUSAND)
TABLE 77 UNITED ARAB EMIRATES EFFERVESCENT TABLET MARKET, BY INDICATION, 2018-2032 (USD THOUSAND)
TABLE 78 UNITED ARAB EMIRATES EFFERVESCENT TABLET MARKET, BY POPULATION TYPE, 2018-2032 (USD THOUSAND)
TABLE 79 UNITED ARAB EMIRATES EFFERVESCENT TABLET MARKET, BY APPLICATION, 2018-2032 (USD THOUSAND)
TABLE 80 UNITED ARAB EMIRATES EFFERVESCENT TABLET MARKET, BY END USER, 2018-2032 (USD THOUSAND)
TABLE 81 UNITED ARAB EMIRATES EFFERVESCENT TABLET MARKET, BY DISTRIBUTION CHANNEL, 2018-2032 (USD THOUSAND)
TABLE 82 UNITED ARAB EMIRATES EFFERVESCENT TABLET MARKET, BY TYPE, 2018-2032 (USD THOUSAND)
TABLE 83 EGYPT EFFERVESCENT TABLET MARKET, BY PRODUCTS, 2018-2032 (USD THOUSAND)
TABLE 84 EGYPT SUPPLEMENTS IN EFFERVESCENT TABLET MARKET, BY PRODUCTS, 2018-2032 (USD THOUSAND)
TABLE 85 EGYPT VITAMINS IN EFFERVESCENT TABLET MARKET, BY TYPE, 2018-2032 (USD THOUSAND)
TABLE 86 EGYPT VITAMINS IN EFFERVESCENT TABLET MARKET, BY BRANDS, 2018-2032 (USD THOUSAND)
TABLE 87 EGYPT MINERALS IN EFFERVESCENT TABLET MARKET, BY TYPE, 2018-2032 (USD THOUSAND)
TABLE 88 EGYPT MINERALS IN EFFERVESCENT TABLET MARKET, BY BRANDS, 2018-2032 (USD THOUSAND)
TABLE 89 EGYPT OTHERS IN EFFERVESCENT TABLET MARKET, BY PRODUCTS, 2018-2032 (USD THOUSAND)
TABLE 90 EGYPT MEDICATION IN EFFERVESCENT TABLET MARKET, BY PRODUCTS, 2018-2032 (USD THOUSAND)
TABLE 91 EGYPT ANALGESICS IN EFFERVESCENT TABLET MARKET, BY TYPE, 2018-2032 (USD THOUSAND)
TABLE 92 EGYPT ANALGESICS IN EFFERVESCENT TABLET MARKET, BY BRANDS, 2018-2032 (USD THOUSAND)
TABLE 93 EGYPT ANTACIDS IN EFFERVESCENT TABLET MARKET, BY TYPE, 2018-2032 (USD THOUSAND)
TABLE 94 EGYPT ANTACIDS IN EFFERVESCENT TABLET MARKET, BY BRANDS, 2018-2032 (USD THOUSAND)
TABLE 95 EGYPT EFFERVESCENT TABLET MARKET, BY METHODS, 2018-2032 (USD THOUSAND)
TABLE 96 EGYPT EFFERVESCENT TABLET MARKET, BY TYPE, 2018-2032 (USD THOUSAND)
TABLE 97 EGYPT EFFERVESCENT TABLET MARKET, BY INDICATION, 2018-2032 (USD THOUSAND)
TABLE 98 EGYPT EFFERVESCENT TABLET MARKET, BY POPULATION TYPE, 2018-2032 (USD THOUSAND)
TABLE 99 EGYPT EFFERVESCENT TABLET MARKET, BY APPLICATION, 2018-2032 (USD THOUSAND)
TABLE 100 EGYPT EFFERVESCENT TABLET MARKET, BY END USER, 2018-2032 (USD THOUSAND)
TABLE 101 EGYPT EFFERVESCENT TABLET MARKET, BY DISTRIBUTION CHANNEL, 2018-2032 (USD THOUSAND)
TABLE 102 EGYPT EFFERVESCENT TABLET MARKET, BY TYPE, 2018-2032 (USD THOUSAND)
TABLE 103 ISRAEL EFFERVESCENT TABLET MARKET, BY PRODUCTS, 2018-2032 (USD THOUSAND)
TABLE 104 ISRAEL SUPPLEMENTS IN EFFERVESCENT TABLET MARKET, BY PRODUCTS, 2018-2032 (USD THOUSAND)
TABLE 105 ISRAEL VITAMINS IN EFFERVESCENT TABLET MARKET, BY TYPE, 2018-2032 (USD THOUSAND)
TABLE 106 ISRAEL VITAMINS IN EFFERVESCENT TABLET MARKET, BY BRANDS, 2018-2032 (USD THOUSAND)
TABLE 107 ISRAEL MINERALS IN EFFERVESCENT TABLET MARKET, BY TYPE, 2018-2032 (USD THOUSAND)
TABLE 108 ISRAEL MINERALS IN EFFERVESCENT TABLET MARKET, BY BRANDS, 2018-2032 (USD THOUSAND)
TABLE 109 ISRAEL OTHERS IN EFFERVESCENT TABLET MARKET, BY PRODUCTS, 2018-2032 (USD THOUSAND)
TABLE 110 ISRAEL MEDICATION IN EFFERVESCENT TABLET MARKET, BY PRODUCTS, 2018-2032 (USD THOUSAND)
TABLE 111 ISRAEL ANALGESICS IN EFFERVESCENT TABLET MARKET, BY TYPE, 2018-2032 (USD THOUSAND)
TABLE 112 ISRAEL ANALGESICS IN EFFERVESCENT TABLET MARKET, BY BRANDS, 2018-2032 (USD THOUSAND)
TABLE 113 ISRAEL ANTACIDS IN EFFERVESCENT TABLET MARKET, BY TYPE, 2018-2032 (USD THOUSAND)
TABLE 114 ISRAEL ANTACIDS IN EFFERVESCENT TABLET MARKET, BY BRANDS, 2018-2032 (USD THOUSAND)
TABLE 115 ISRAEL EFFERVESCENT TABLET MARKET, BY METHODS, 2018-2032 (USD THOUSAND)
TABLE 116 ISRAEL EFFERVESCENT TABLET MARKET, BY TYPE, 2018-2032 (USD THOUSAND)
TABLE 117 ISRAEL EFFERVESCENT TABLET MARKET, BY INDICATION, 2018-2032 (USD THOUSAND)
TABLE 118 ISRAEL EFFERVESCENT TABLET MARKET, BY POPULATION TYPE, 2018-2032 (USD THOUSAND)
TABLE 119 ISRAEL EFFERVESCENT TABLET MARKET, BY APPLICATION, 2018-2032 (USD THOUSAND)
TABLE 120 ISRAEL EFFERVESCENT TABLET MARKET, BY END USER, 2018-2032 (USD THOUSAND)
TABLE 121 ISRAEL EFFERVESCENT TABLET MARKET, BY DISTRIBUTION CHANNEL, 2018-2032 (USD THOUSAND)
TABLE 122 ISRAEL EFFERVESCENT TABLET MARKET, BY TYPE, 2018-2032 (USD THOUSAND)
TABLE 123 ALGERIA EFFERVESCENT TABLET MARKET, BY PRODUCTS, 2018-2032 (USD THOUSAND)
TABLE 124 ALGERIA SUPPLEMENTS IN EFFERVESCENT TABLET MARKET, BY PRODUCTS, 2018-2032 (USD THOUSAND)
TABLE 125 ALGERIA VITAMINS IN EFFERVESCENT TABLET MARKET, BY TYPE, 2018-2032 (USD THOUSAND)
TABLE 126 ALGERIA VITAMINS IN EFFERVESCENT TABLET MARKET, BY BRANDS, 2018-2032 (USD THOUSAND)
TABLE 127 ALGERIA MINERALS IN EFFERVESCENT TABLET MARKET, BY TYPE, 2018-2032 (USD THOUSAND)
TABLE 128 ALGERIA MINERALS IN EFFERVESCENT TABLET MARKET, BY BRANDS, 2018-2032 (USD THOUSAND)
TABLE 129 ALGERIA OTHERS IN EFFERVESCENT TABLET MARKET, BY PRODUCTS, 2018-2032 (USD THOUSAND)
TABLE 130 ALGERIA MEDICATION IN EFFERVESCENT TABLET MARKET, BY PRODUCTS, 2018-2032 (USD THOUSAND)
TABLE 131 ALGERIA ANALGESICS IN EFFERVESCENT TABLET MARKET, BY TYPE, 2018-2032 (USD THOUSAND)
TABLE 132 ALGERIA ANALGESICS IN EFFERVESCENT TABLET MARKET, BY BRANDS, 2018-2032 (USD THOUSAND)
TABLE 133 ALGERIA ANTACIDS IN EFFERVESCENT TABLET MARKET, BY TYPE, 2018-2032 (USD THOUSAND)
TABLE 134 ALGERIA ANTACIDS IN EFFERVESCENT TABLET MARKET, BY BRANDS, 2018-2032 (USD THOUSAND)
TABLE 135 ALGERIA EFFERVESCENT TABLET MARKET, BY METHODS, 2018-2032 (USD THOUSAND)
TABLE 136 ALGERIA EFFERVESCENT TABLET MARKET, BY TYPE, 2018-2032 (USD THOUSAND)
TABLE 137 ALGERIA EFFERVESCENT TABLET MARKET, BY INDICATION, 2018-2032 (USD THOUSAND)
TABLE 138 ALGERIA EFFERVESCENT TABLET MARKET, BY POPULATION TYPE, 2018-2032 (USD THOUSAND)
TABLE 139 ALGERIA EFFERVESCENT TABLET MARKET, BY APPLICATION, 2018-2032 (USD THOUSAND)
TABLE 140 ALGERIA EFFERVESCENT TABLET MARKET, BY END USER, 2018-2032 (USD THOUSAND)
TABLE 141 ALGERIA EFFERVESCENT TABLET MARKET, BY DISTRIBUTION CHANNEL, 2018-2032 (USD THOUSAND)
TABLE 142 ALGERIA EFFERVESCENT TABLET MARKET, BY TYPE, 2018-2032 (USD THOUSAND)
TABLE 143 MOROCCO EFFERVESCENT TABLET MARKET, BY PRODUCTS, 2018-2032 (USD THOUSAND)
TABLE 144 MOROCCO SUPPLEMENTS IN EFFERVESCENT TABLET MARKET, BY PRODUCTS, 2018-2032 (USD THOUSAND)
TABLE 145 MOROCCO VITAMINS IN EFFERVESCENT TABLET MARKET, BY TYPE, 2018-2032 (USD THOUSAND)
TABLE 146 MOROCCO VITAMINS IN EFFERVESCENT TABLET MARKET, BY BRANDS, 2018-2032 (USD THOUSAND)
TABLE 147 MOROCCO MINERALS IN EFFERVESCENT TABLET MARKET, BY TYPE, 2018-2032 (USD THOUSAND)
TABLE 148 MOROCCO MINERALS IN EFFERVESCENT TABLET MARKET, BY BRANDS, 2018-2032 (USD THOUSAND)
TABLE 149 MOROCCO OTHERS IN EFFERVESCENT TABLET MARKET, BY PRODUCTS, 2018-2032 (USD THOUSAND)
TABLE 150 MOROCCO MEDICATION IN EFFERVESCENT TABLET MARKET, BY PRODUCTS, 2018-2032 (USD THOUSAND)
TABLE 151 MOROCCO ANALGESICS IN EFFERVESCENT TABLET MARKET, BY TYPE, 2018-2032 (USD THOUSAND)
TABLE 152 MOROCCO ANALGESICS IN EFFERVESCENT TABLET MARKET, BY BRANDS, 2018-2032 (USD THOUSAND)
TABLE 153 MOROCCO ANTACIDS IN EFFERVESCENT TABLET MARKET, BY TYPE, 2018-2032 (USD THOUSAND)
TABLE 154 MOROCCO ANTACIDS IN EFFERVESCENT TABLET MARKET, BY BRANDS, 2018-2032 (USD THOUSAND)
TABLE 155 MOROCCO EFFERVESCENT TABLET MARKET, BY METHODS, 2018-2032 (USD THOUSAND)
TABLE 156 MOROCCO EFFERVESCENT TABLET MARKET, BY TYPE, 2018-2032 (USD THOUSAND)
TABLE 157 MOROCCO EFFERVESCENT TABLET MARKET, BY INDICATION, 2018-2032 (USD THOUSAND)
TABLE 158 MOROCCO EFFERVESCENT TABLET MARKET, BY POPULATION TYPE, 2018-2032 (USD THOUSAND)
TABLE 159 MOROCCO EFFERVESCENT TABLET MARKET, BY APPLICATION, 2018-2032 (USD THOUSAND)
TABLE 160 MOROCCO EFFERVESCENT TABLET MARKET, BY END USER, 2018-2032 (USD THOUSAND)
TABLE 161 MOROCCO EFFERVESCENT TABLET MARKET, BY DISTRIBUTION CHANNEL, 2018-2032 (USD THOUSAND)
TABLE 162 MOROCCO EFFERVESCENT TABLET MARKET, BY TYPE, 2018-2032 (USD THOUSAND)
TABLE 163 TUNISIA EFFERVESCENT TABLET MARKET, BY PRODUCTS, 2018-2032 (USD THOUSAND)
TABLE 164 TUNISIA SUPPLEMENTS IN EFFERVESCENT TABLET MARKET, BY PRODUCTS, 2018-2032 (USD THOUSAND)
TABLE 165 TUNISIA VITAMINS IN EFFERVESCENT TABLET MARKET, BY TYPE, 2018-2032 (USD THOUSAND)
TABLE 166 TUNISIA VITAMINS IN EFFERVESCENT TABLET MARKET, BY BRANDS, 2018-2032 (USD THOUSAND)
TABLE 167 TUNISIA MINERALS IN EFFERVESCENT TABLET MARKET, BY TYPE, 2018-2032 (USD THOUSAND)
TABLE 168 TUNISIA MINERALS IN EFFERVESCENT TABLET MARKET, BY BRANDS, 2018-2032 (USD THOUSAND)
TABLE 169 TUNISIA OTHERS IN EFFERVESCENT TABLET MARKET, BY PRODUCTS, 2018-2032 (USD THOUSAND)
TABLE 170 TUNISIA MEDICATION IN EFFERVESCENT TABLET MARKET, BY PRODUCTS, 2018-2032 (USD THOUSAND)
TABLE 171 TUNISIA ANALGESICS IN EFFERVESCENT TABLET MARKET, BY TYPE, 2018-2032 (USD THOUSAND)
TABLE 172 TUNISIA ANALGESICS IN EFFERVESCENT TABLET MARKET, BY BRANDS, 2018-2032 (USD THOUSAND)
TABLE 173 TUNISIA ANTACIDS IN EFFERVESCENT TABLET MARKET, BY TYPE, 2018-2032 (USD THOUSAND)
TABLE 174 TUNISIA ANTACIDS IN EFFERVESCENT TABLET MARKET, BY BRANDS, 2018-2032 (USD THOUSAND)
TABLE 175 TUNISIA EFFERVESCENT TABLET MARKET, BY METHODS, 2018-2032 (USD THOUSAND)
TABLE 176 TUNISIA EFFERVESCENT TABLET MARKET, BY TYPE, 2018-2032 (USD THOUSAND)
TABLE 177 TUNISIA EFFERVESCENT TABLET MARKET, BY INDICATION, 2018-2032 (USD THOUSAND)
TABLE 178 TUNISIA EFFERVESCENT TABLET MARKET, BY POPULATION TYPE, 2018-2032 (USD THOUSAND)
TABLE 179 TUNISIA EFFERVESCENT TABLET MARKET, BY APPLICATION, 2018-2032 (USD THOUSAND)
TABLE 180 TUNISIA EFFERVESCENT TABLET MARKET, BY END USER, 2018-2032 (USD THOUSAND)
TABLE 181 TUNISIA EFFERVESCENT TABLET MARKET, BY DISTRIBUTION CHANNEL, 2018-2032 (USD THOUSAND)
TABLE 182 TUNISIA EFFERVESCENT TABLET MARKET, BY TYPE, 2018-2032 (USD THOUSAND)
TABLE 183 LIBYA EFFERVESCENT TABLET MARKET, BY PRODUCTS, 2018-2032 (USD THOUSAND)
TABLE 184 LIBYA SUPPLEMENTS IN EFFERVESCENT TABLET MARKET, BY PRODUCTS, 2018-2032 (USD THOUSAND)
TABLE 185 LIBYA VITAMINS IN EFFERVESCENT TABLET MARKET, BY TYPE, 2018-2032 (USD THOUSAND)
TABLE 186 LIBYA VITAMINS IN EFFERVESCENT TABLET MARKET, BY BRANDS, 2018-2032 (USD THOUSAND)
TABLE 187 LIBYA MINERALS IN EFFERVESCENT TABLET MARKET, BY TYPE, 2018-2032 (USD THOUSAND)
TABLE 188 LIBYA MINERALS IN EFFERVESCENT TABLET MARKET, BY BRANDS, 2018-2032 (USD THOUSAND)
TABLE 189 LIBYA OTHERS IN EFFERVESCENT TABLET MARKET, BY PRODUCTS, 2018-2032 (USD THOUSAND)
TABLE 190 LIBYA MEDICATION IN EFFERVESCENT TABLET MARKET, BY PRODUCTS, 2018-2032 (USD THOUSAND)
TABLE 191 LIBYA ANALGESICS IN EFFERVESCENT TABLET MARKET, BY TYPE, 2018-2032 (USD THOUSAND)
TABLE 192 LIBYA ANALGESICS IN EFFERVESCENT TABLET MARKET, BY BRANDS, 2018-2032 (USD THOUSAND)
TABLE 193 LIBYA ANTACIDS IN EFFERVESCENT TABLET MARKET, BY TYPE, 2018-2032 (USD THOUSAND)
TABLE 194 LIBYA ANTACIDS IN EFFERVESCENT TABLET MARKET, BY BRANDS, 2018-2032 (USD THOUSAND)
TABLE 195 LIBYA EFFERVESCENT TABLET MARKET, BY METHODS, 2018-2032 (USD THOUSAND)
TABLE 196 LIBYA EFFERVESCENT TABLET MARKET, BY TYPE, 2018-2032 (USD THOUSAND)
TABLE 197 LIBYA EFFERVESCENT TABLET MARKET, BY INDICATION, 2018-2032 (USD THOUSAND)
TABLE 198 LIBYA EFFERVESCENT TABLET MARKET, BY POPULATION TYPE, 2018-2032 (USD THOUSAND)
TABLE 199 LIBYA EFFERVESCENT TABLET MARKET, BY APPLICATION, 2018-2032 (USD THOUSAND)
TABLE 200 LIBYA EFFERVESCENT TABLET MARKET, BY END USER, 2018-2032 (USD THOUSAND)
TABLE 201 LIBYA EFFERVESCENT TABLET MARKET, BY DISTRIBUTION CHANNEL, 2018-2032 (USD THOUSAND)
TABLE 202 LIBYA EFFERVESCENT TABLET MARKET, BY TYPE, 2018-2032 (USD THOUSAND)
TABLE 203 SUDAN EFFERVESCENT TABLET MARKET, BY PRODUCTS, 2018-2032 (USD THOUSAND)
TABLE 204 SUDAN SUPPLEMENTS IN EFFERVESCENT TABLET MARKET, BY PRODUCTS, 2018-2032 (USD THOUSAND)
TABLE 205 SUDAN VITAMINS IN EFFERVESCENT TABLET MARKET, BY TYPE, 2018-2032 (USD THOUSAND)
TABLE 206 SUDAN VITAMINS IN EFFERVESCENT TABLET MARKET, BY BRANDS, 2018-2032 (USD THOUSAND)
TABLE 207 SUDAN MINERALS IN EFFERVESCENT TABLET MARKET, BY TYPE, 2018-2032 (USD THOUSAND)
TABLE 208 SUDAN MINERALS IN EFFERVESCENT TABLET MARKET, BY BRANDS, 2018-2032 (USD THOUSAND)
TABLE 209 SUDAN OTHERS IN EFFERVESCENT TABLET MARKET, BY PRODUCTS, 2018-2032 (USD THOUSAND)
TABLE 210 SUDAN MEDICATION IN EFFERVESCENT TABLET MARKET, BY PRODUCTS, 2018-2032 (USD THOUSAND)
TABLE 211 SUDAN ANALGESICS IN EFFERVESCENT TABLET MARKET, BY TYPE, 2018-2032 (USD THOUSAND)
TABLE 212 SUDAN ANALGESICS IN EFFERVESCENT TABLET MARKET, BY BRANDS, 2018-2032 (USD THOUSAND)
TABLE 213 SUDAN ANTACIDS IN EFFERVESCENT TABLET MARKET, BY TYPE, 2018-2032 (USD THOUSAND)
TABLE 214 SUDAN ANTACIDS IN EFFERVESCENT TABLET MARKET, BY BRANDS, 2018-2032 (USD THOUSAND)
TABLE 215 SUDAN EFFERVESCENT TABLET MARKET, BY METHODS, 2018-2032 (USD THOUSAND)
TABLE 216 SUDAN EFFERVESCENT TABLET MARKET, BY TYPE, 2018-2032 (USD THOUSAND)
TABLE 217 SUDAN EFFERVESCENT TABLET MARKET, BY INDICATION, 2018-2032 (USD THOUSAND)
TABLE 218 SUDAN EFFERVESCENT TABLET MARKET, BY POPULATION TYPE, 2018-2032 (USD THOUSAND)
TABLE 219 SUDAN EFFERVESCENT TABLET MARKET, BY APPLICATION, 2018-2032 (USD THOUSAND)
TABLE 220 SUDAN EFFERVESCENT TABLET MARKET, BY END USER, 2018-2032 (USD THOUSAND)
TABLE 221 SUDAN EFFERVESCENT TABLET MARKET, BY DISTRIBUTION CHANNEL, 2018-2032 (USD THOUSAND)
TABLE 222 SUDAN EFFERVESCENT TABLET MARKET, BY TYPE, 2018-2032 (USD THOUSAND)
TABLE 223 REST OF MIDDLE EAST AND NORTH AFRICA EFFERVESCENT TABLET MARKET, BY PRODUCTS, 2018-2032 (USD THOUSAND)
List of Figure
FIGURE 1 MIDDLE EAST AND NORTH AFRICA EFFERVESCENT TABLET MARKET: SEGMENTATION
FIGURE 2 MIDDLE EAST AND NORTH AFRICA EFFERVESCENT TABLET MARKET: DATA TRIANGULATION
FIGURE 3 MIDDLE EAST AND NORTH AFRICA EFFERVESCENT TABLET MARKET: DROC ANALYSIS
FIGURE 4 MIDDLE EAST AND NORTH AFRICA EFFERVESCENT TABLET MARKET: GLOBAL VS REGIONAL ANALYSIS
FIGURE 5 MIDDLE EAST AND NORTH AFRICA EFFERVESCENT TABLET MARKET: COMPANY RESEARCH ANALYSIS
FIGURE 6 MIDDLE EAST AND NORTH AFRICA EFFERVESCENT TABLET MARKET: INTERVIEW DEMOGRAPHICS
FIGURE 7 MIDDLE EAST AND NORTH AFRICA EFFERVESCENT TABLET MARKET: DBMR MARKET POSITION GRID
FIGURE 8 MIDDLE EAST AND NORTH AFRICA EFFERVESCENT TABLET MARKET: MARKET END USER COVERAGE GRID
FIGURE 9 EXECUTIVE SUMMARY
FIGURE 10 STRATEGIC DECISIONS
FIGURE 11 TWO SEGMENTS COMPRISE THE MIDDLE EAST AND NORTH AFRICA EFFERVESCENT TABLET MARKET, BY PRODUCT TYPE (2024)
FIGURE 12 MIDDLE EAST AND NORTH AFRICA EFFERVESCENT TABLET MARKET: SEGMENTATION
FIGURE 13 RISE IN CHRONIC DISEASES EXPECTED TO DRIVE THE GLOBAL CANCER PHOTODYNAMIC THERAPY MARKET IN THE FORECAST PERIOD OF 2025 TO 2032
FIGURE 14 PRODUCTS SEGMENT IS EXPECTED TO ACCOUNT FOR THE LARGEST SHARE OF THE MIDDLE EAST AND NORTH AFRICA EFFERVESCENT TABLET MARKET IN 2025 & 2032
FIGURE 15 DRIVERS, RESTRAINTS, OPPORTUNITIES, AND CHALLENGES OF MIDDLE EAST AND NORTH AFRICA EFFERVESCENT TABLET MARKET
FIGURE 16 MIDDLE EAST AND NORTH AFRICA EFFERVESCENT TABLET MARKET: BY PRODUCTS, 2024
FIGURE 17 MIDDLE EAST AND NORTH AFRICA EFFERVESCENT TABLET MARKET: BY PRODUCTS
FIGURE 18 MIDDLE EAST AND NORTH AFRICA EFFERVESCENT TABLET MARKET: BY PRODUCTS
FIGURE 19 MIDDLE EAST AND NORTH AFRICA EFFERVESCENT TABLET MARKET: BY PRODUCTS
FIGURE 20 MIDDLE EAST AND NORTH AFRICA EFFERVESCENT TABLET MARKET: BY METHODS, 2024
FIGURE 21 MIDDLE EAST AND NORTH AFRICA EFFERVESCENT TABLET MARKET: BY METHODS
FIGURE 22 MIDDLE EAST AND NORTH AFRICA EFFERVESCENT TABLET MARKET: BY METHODS
FIGURE 23 MIDDLE EAST AND NORTH AFRICA EFFERVESCENT TABLET MARKET: BY METHODS
FIGURE 24 MIDDLE EAST AND NORTH AFRICA EFFERVESCENT TABLET MARKET: BY TYPE, 2024
FIGURE 25 MIDDLE EAST AND NORTH AFRICA EFFERVESCENT TABLET MARKET: BY TYPE
FIGURE 26 MIDDLE EAST AND NORTH AFRICA EFFERVESCENT TABLET MARKET: BY TYPE
FIGURE 27 MIDDLE EAST AND NORTH AFRICA EFFERVESCENT TABLET MARKET: BY TYPE
FIGURE 28 MIDDLE EAST AND NORTH AFRICA EFFERVESCENT TABLET MARKET: BY INDICATION, 2024
FIGURE 29 MIDDLE EAST AND NORTH AFRICA EFFERVESCENT TABLET MARKET: BY INDICATION
FIGURE 30 MIDDLE EAST AND NORTH AFRICA EFFERVESCENT TABLET MARKET: BY INDICATION
FIGURE 31 MIDDLE EAST AND NORTH AFRICA EFFERVESCENT TABLET MARKET: BY INDICATION
FIGURE 32 MIDDLE EAST AND NORTH AFRICA EFFERVESCENT TABLET MARKET: BY POPULATION TYPE, 2024
FIGURE 33 MIDDLE EAST AND NORTH AFRICA EFFERVESCENT TABLET MARKET: BY POPULATION
FIGURE 34 MIDDLE EAST AND NORTH AFRICA EFFERVESCENT TABLET MARKET: BY POPULATION
FIGURE 35 MIDDLE EAST AND NORTH AFRICA EFFERVESCENT TABLET MARKET: BY POPULATION
FIGURE 36 MIDDLE EAST AND NORTH AFRICA EFFERVESCENT TABLET MARKET: BY APPLICATION, 2024
FIGURE 37 MIDDLE EAST AND NORTH AFRICA EFFERVESCENT TABLET MARKET: BY APPLICATION
FIGURE 38 MIDDLE EAST AND NORTH AFRICA EFFERVESCENT TABLET MARKET: BY APPLICATION
FIGURE 39 MIDDLE EAST AND NORTH AFRICA EFFERVESCENT TABLET MARKET: BY APPLICATION
FIGURE 40 MIDDLE EAST AND NORTH AFRICA EFFERVESCENT TABLET MARKET: BY END USER, 2024
FIGURE 41 MIDDLE EAST AND NORTH AFRICA EFFERVESCENT TABLET MARKET: BY END USER
FIGURE 42 MIDDLE EAST AND NORTH AFRICA EFFERVESCENT TABLET MARKET: BY END USER
FIGURE 43 MIDDLE EAST AND NORTH AFRICA EFFERVESCENT TABLET MARKET: BY END USER
FIGURE 44 MIDDLE EAST AND NORTH AFRICA EFFERVESCENT TABLET MARKET: BY DISTRIBUTION CHANNEL, 2024
FIGURE 45 MIDDLE EAST AND NORTH AFRICA EFFERVESCENT TABLET MARKET: BY DISTRIBUTION CHANNEL
FIGURE 46 MIDDLE EAST AND NORTH AFRICA EFFERVESCENT TABLET MARKET: BY DISTRIBUTION CHANNEL
FIGURE 47 MIDDLE EAST AND NORTH AFRICA EFFERVESCENT TABLET MARKET: BY DISTRIBUTION CHANNEL
FIGURE 48 MIDDLE EAST AND NORTH AFRICA EFFERVESCENT TABLET MARKET: SNAPSHOT (2024)
FIGURE 49 MIDDLE EAST AND NORTH AFRICA : COMPANY SHARE 2024 (%) (MANUFACTURER)
Data collection and base year analysis are done using data collection modules with large sample sizes. The stage includes obtaining market information or related data through various sources and strategies. It includes examining and planning all the data acquired from the past in advance. It likewise envelops the examination of information inconsistencies seen across different information sources. The market data is analysed and estimated using market statistical and coherent models. Also, market share analysis and key trend analysis are the major success factors in the market report. To know more, please request an analyst call or drop down your inquiry.
The key research methodology used by DBMR research team is data triangulation which involves data mining, analysis of the impact of data variables on the market and primary (industry expert) validation. Data models include Vendor Positioning Grid, Market Time Line Analysis, Market Overview and Guide, Company Positioning Grid, Patent Analysis, Pricing Analysis, Company Market Share Analysis, Standards of Measurement, Global versus Regional and Vendor Share Analysis. To know more about the research methodology, drop in an inquiry to speak to our industry experts.
Data Bridge Market Research is a leader in advanced formative research. We take pride in servicing our existing and new customers with data and analysis that match and suits their goal. The report can be customized to include price trend analysis of target brands understanding the market for additional countries (ask for the list of countries), clinical trial results data, literature review, refurbished market and product base analysis. Market analysis of target competitors can be analyzed from technology-based analysis to market portfolio strategies. We can add as many competitors that you require data about in the format and data style you are looking for. Our team of analysts can also provide you data in crude raw excel files pivot tables (Fact book) or can assist you in creating presentations from the data sets available in the report.


