
North America 3d Printing Gases Market
Market Size in USD Billion
 USD
29.90 Billion
USD
291.00 Billion
2024
2032
USD
29.90 Billion
USD
291.00 Billion
2024
2032
| 2025 - 2032 | |
| USD 29.90 Billion | |
| USD 291.00 Billion | |
| % | |
|
3D Printing Gases Market Size
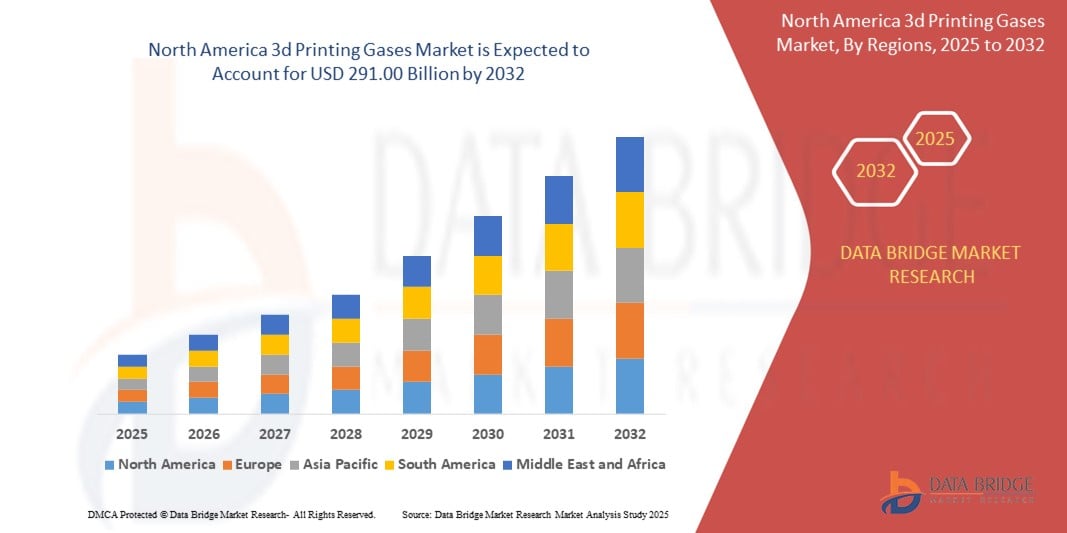
- The North America 3D printing gases market size was valued at USD 29.90 billion in 2024 and is expected to reach USD 291.00 billion by 2032, at a CAGR of 32.9% during the forecast period
- The market growth is largely fueled by the rapid adoption of additive manufacturing technologies across aerospace, automotive, and medical sectors in North America, which demand high-purity gases such as argon and nitrogen to maintain controlled printing environments during metal-based 3D printing
- Furthermore, increasing government and private investments in advanced manufacturing, along with the presence of a strong industrial base and R&D infrastructure, are driving the integration of 3D printing in mass production. These converging factors are significantly accelerating the demand for reliable gas delivery systems and process optimization solutions, thereby boosting the 3D printing gases market in the region
3D Printing Gases Market Analysis
- 3D printing gases such as argon, nitrogen, and hydrogen play a critical role in maintaining inert and stable conditions during additive manufacturing, especially for metal printing technologies such as DMLS and EBM. These gases prevent oxidation, ensure material integrity, and support consistent part quality in high-performance industries
- The increasing deployment of large-scale industrial 3D printing facilities, growing focus on lightweight and complex component manufacturing, and advancements in gas handling and purification technologies are key factors enhancing market expansion across North America
- U.S. dominated the 3D printing gases market with a share of 55.7% in 2024, due to its leadership in additive manufacturing adoption across aerospace, defense, and healthcare sectors. The presence of advanced manufacturing hubs, extensive R&D investments, and high demand for metal 3D printing in critical applications such as turbine parts, implants, and lightweight automotive components are fueling the strong uptake of high-purity inert gases such as argon and nitrogen
- Canada is expected to be the fastest growing region in the 3D printing gases market during the forecast period due to growing government-backed initiatives to integrate additive manufacturing in aerospace, energy, and medical sectors
- Argon segment dominated the market with a market share of 42.1% in 2024, due to its inert nature and its widespread use in metal additive manufacturing processes such as direct metal laser sintering (DMLS) and electron beam melting (EBM). Argon ensures a stable and contamination-free environment, which is crucial in preventing oxidation during metal fusion, making it a preferred choice in industrial and aerospace-grade applications
Report Scope and 3D Printing Gases Market Segmentation
|
Attributes |
3D Printing Gases Key Market Insights |
|
Segments Covered |
|
|
Countries Covered |
North America
|
|
Key Market Players |
|
|
Market Opportunities |
|
|
Value Added Data Infosets |
In addition to the insights on market scenarios such as market value, growth rate, segmentation, geographical coverage, and major players, the market reports curated by the Data Bridge Market Research also include import export analysis, production capacity overview, production consumption analysis, price trend analysis, climate change scenario, supply chain analysis, value chain analysis, raw material/consumables overview, vendor selection criteria, PESTLE Analysis, Porter Analysis, and regulatory framework. |
3D Printing Gases Market Trends
“Rising Demand for Specialized Gases”
- The North America 3D printing gases market is expanding as manufacturers and research labs increasingly require high-purity, specialized gases such as argon, nitrogen, and custom gas mixtures for additive manufacturing processes, crucial for ensuring product quality and minimizing oxidation and contamination in high-precision applications
- For instance, in the U.S., sectors such as aerospace, defense, and healthcare—including firms involved in customized medical implants and high-performance components—have driven significant investments in advanced gas solutions to maintain strict standards of precision and part integrity during 3D printing production
- The gas mixtures segment has emerged as the largest and fastest-growing submarket, reflecting escalating complexity in 3D printed materials and applications, demanding tailored atmospheric control for optimal print outcomes
- The shift from prototyping to mass production in fields such as aerospace and automotive increases the necessity for controlled gas environments, as even minor contamination or porosity directly impacts performance and safety of mission-critical parts
- Leading industrial gas suppliers in North America are launching innovative gas products and expanding production capacities to address evolving requirements, while also collaborating with 3D printer manufacturers and end users for application-specific solutions
- North America's position as an early adopter of 3D printing, combined with a strong local supply chain for both hardware and specialty gases, continues to reinforce market growth—particularly as more industries integrate metal and bioprinting technologies
3D Printing Gases Market Dynamics
Driver
“Growth in 3D Printing Industry”
- The rapid advancement of the 3D printing industry in North America, with rising implementation across aerospace, healthcare, automotive, and consumer goods, is the chief catalyst for increased demand for high-quality 3D printing gases
- For instance, the U.S. has become the leading market due to its highly advanced manufacturing infrastructure, early adoption of additive manufacturing, and high-value applications—such as creating aviation parts, dental prosthetics, and complex machinery—requiring stringent gas usage standards
- Applications such as metal additive manufacturing and bioprinting are particularly gas-intensive, as inert environments are crucial for producing defect-free, high-performance products with tight metallurgical specifications
- As 3D printing expands from rapid prototyping to full-scale manufacturing and supply chain integration, the demand for precise, reliable gas solutions grows, prompting gas producers to keep pace with technological advances and higher-volume needs
- Continuous innovation by gas suppliers, in collaboration with equipment manufacturers and end-user sectors, has streamlined production processes and improved material quality, further boosting the growth trajectory of both industries
Restraint/Challenge
“High Initial Costs”
- The high initial investment required for specialty gas infrastructure and advanced 3D printing equipment represents a significant barrier, especially for small and mid-sized enterprises seeking to adopt or scale up additive manufacturing
- For instance, establishing and maintaining controlled storage, delivery systems, and monitoring solutions for gases such as argon and nitrogen, in addition to acquiring high-end 3D printers, can substantially raise upfront project costs
- Advanced metal 3D printing and bioprinting processes also demand continuous supply of ultra-high-purity gases, increasing ongoing operational expenditures beyond just the initial investment
- The complexity of training staff in gas handling and equipment operation, along with compliance with regulatory and industry standards, can add to both time and resource requirements for new entrants
- While the cost is offset over time by improved efficiency and quality, these capital demands may slow adoption in cost-sensitive segments and constrain flexibility, especially for R&D-focused organizations with limited budgets
3D Printing Gases Market Scope
The market is segmented on the basis of type, technology, material, storage and distribution, function, and end-use.
- By Type
On the basis of type, the 3D printing gases market is segmented into argon, nitrogen, hydrogen, helium, and others. The argon segment dominated the largest market revenue share of 42.1% in 2024, primarily due to its inert nature and its widespread use in metal additive manufacturing processes such as direct metal laser sintering (DMLS) and electron beam melting (EBM). Argon ensures a stable and contamination-free environment, which is crucial in preventing oxidation during metal fusion, making it a preferred choice in industrial and aerospace-grade applications.
The hydrogen segment is anticipated to witness the fastest growth rate from 2025 to 2032, driven by its increasing adoption in cutting-edge metal printing technologies that demand enhanced energy efficiency and cleaner combustion. Hydrogen’s potential for improving print quality in specific high-temperature applications is gaining traction across experimental and research-based printing environments.
- By Technology
On the basis of technology, the market is segmented into Stereo Lithography (SLA), Selective Laser Sintering (SLS), Fused Deposition Modeling (FDM), Digital Light Process (DLP), Multi Jet Fusion (MJF), Polyjet, Direct Metal Laser Sintering (DMLS), Electron Beam Melting (EBM), Poly-Jet, and Others. DMLS held the largest market share in 2024, attributed to its extensive use in aerospace, automotive, and medical sectors for producing high-precision metal components that require controlled atmospheres, particularly argon and nitrogen, to ensure material integrity.
Electron Beam Melting (EBM) is expected to record the fastest growth through 2032, owing to its unique capability to process reactive and high-performance alloys. EBM's dependence on vacuum and inert gas environments boosts demand for high-purity gases, particularly in specialized applications such as titanium and nickel-based superalloy manufacturing.
- By Material
On the basis of material, the market is segmented into plastics, metal, alumide, wood, and others. The metal segment held the largest revenue share in 2024, driven by growing demand for durable and functional components in sectors such as aerospace, medical, and automotive, where metal powders are processed under protective gas atmospheres.
The alumide segment is projected to register the highest CAGR from 2025 to 2032 due to its increasing adoption in lightweight structural components and prototypes. Its compatibility with SLS technology and the requirement for controlled gas environments during sintering further elevate its relevance in the market.
- By Storage and Distribution
On the basis of storage and distribution, the market is segmented into cylinder, merchant liquid, and tonnage. The cylinder segment led the market in 2024, owing to its suitability for small to medium-scale 3D printing operations and ease of transport and on-site handling, especially in academic and prototyping labs.
The tonnage segment is anticipated to grow at the fastest pace during the forecast period, fueled by the rising number of large-scale industrial additive manufacturing facilities that demand continuous, high-volume gas supply for uninterrupted production.
- By Function
On the basis of function, the market is segmented into insulation, illumination, cooling, and others. The insulation segment accounted for the largest revenue share in 2024, as many 3D printing processes—particularly metal-based ones—require thermal stability and inert gas blankets to prevent oxidation and maintain consistent process temperatures.
The cooling segment is expected to expand rapidly from 2025 to 2032 due to increased demand for precision cooling in high-energy processes, especially in technologies such as DMLS and EBM, where thermal management significantly influences build quality.
- By End-Use
On the basis of end-use, the market is segmented into industrial, automotive, aerospace, consumer goods, medical, building and construction, jewellery, food, toys, visual art, robotics, and others. The aerospace segment led the market in 2024, backed by the sector's extensive reliance on high-performance metal printing that requires strict gas control to ensure part quality, reliability, and regulatory compliance.
The medical segment is projected to witness the fastest growth rate over the forecast period, spurred by the growing use of 3D printing in producing patient-specific implants, surgical tools, and dental devices, where gas-assisted precision and sterilization are critical.
3D Printing Gases Market Regional Analysis
- U.S. dominated the 3D printing gases market with the largest revenue share of 55.7% in 2024, driven by its leadership in additive manufacturing adoption across aerospace, defense, and healthcare sectors. The presence of advanced manufacturing hubs, extensive R&D investments, and high demand for metal 3D printing in critical applications such as turbine parts, implants, and lightweight automotive components are fueling the strong uptake of high-purity inert gases such as argon and nitrogen
- The country hosts several prominent gas suppliers and 3D printing OEMs that collaborate to develop customized gas delivery solutions, ensuring consistent atmospheric control during complex print jobs. Growth is also supported by federal funding initiatives for domestic manufacturing innovation and sustainability goals, which are encouraging the use of efficient gas technologies
- The U.S. market continues to benefit from the rise in large-scale industrial printing centers and rapid adoption of metal and polymer 3D printing for both prototyping and end-use parts. Technological advancements in gas monitoring systems and increasing penetration of Industry 4.0 practices are further consolidating its dominance in the North American market
Canada 3D Printing Gases Market Insight
Canada is projected to register the fastest CAGR in the North America 3D printing gases market from 2025 to 2032, supported by growing government-backed initiatives to integrate additive manufacturing in aerospace, energy, and medical sectors. The expanding presence of research institutions and university-driven innovation hubs is stimulating demand for research-grade gas supplies. Increasing adoption of metal 3D printing, particularly in Ontario and Quebec, is driving usage of argon and nitrogen gases for controlled manufacturing environments
Mexico 3D Printing Gases Market Insight
Mexico is expected to witness steady growth in the 3D printing gases market between 2025 and 2032, fueled by the expansion of automotive manufacturing and localized production efforts in consumer goods and tooling. Growing investment in industrial parks and OEM facilities—especially in northern Mexico—is boosting the adoption of 3D printing technologies and, consequently, high-purity gases for process optimization. The market is also supported by increasing cross-border collaboration with U.S.-based additive manufacturing players and improved access to industrial gas supply chains
3D Printing Gases Market Share
The 3D printing gases industry is primarily led by well-established companies, including:
- DuPont (U.S.)
- NIPPON SANSO HOLDINGS CORPORATION (Japan)
- ExOne (U.S.)
- 3D Systems, Inc. (U.S.)
- Renishaw plc (U.K.)
- Universal Industrial Gases Inc. (U.S.)
- Messer SE & Co. KGaA (Germany)
- Bronkhorst (Netherlands)
- Stratasys (Israel)
- General Electric (U.S.)
- Höganäs AB (Sweden)
- GKN Powder Metallurgy (Germany)
- Equispheres (Canada)
- Sandvik AB (Sweden)
- Air Products and Chemicals, Inc. (U.S.)
- AIR LIQUIDE(France)
- Evonik Industries AG (Germany)
- BASF SE (Germany)
- Linde PLC (Ireland)
Latest Developments in North America 3D Printing Gases Market
- In February 2021, 3D Systems advanced its presence in the 3D printing gases market with the launch of the 'High Speed Fusion' 3D printing system tailored for aerospace and automotive applications. This strategic move reflects the industry's demand for high-reliability products, aligning with the company's portfolio expansion in response to market needs
- In February 2021, AMEXCI collaborated with SLM Solutions displaying a concerted effort to bolster the industrialization of additive manufacturing. With a focus on supporting companies in implementing advanced manufacturing technologies, this collaboration underscores the role of 3D printing gases in facilitating the serial production of intricate metal parts in the evolving market
- In January 2021, Equispheres launched three high-performance aluminum powders, aiming to enhance strength, precision, and printing speed. This strategic move bolstered the company's revenue and diversified its product portfolio, positioning it for growth in the 3D printing materials market
- In May 2020, GENERAL ELECTRIC achieved a technology milestone by collaborating with the US Air Force to 3D print a sump cover for the F110 engine. This successful collaboration displaying advancements in metal additive manufacturing and contributed to revenue growth for GENERAL ELECTRIC through increased involvement in aerospace applications
- In March 2020, Stratasys collaborating with m2nxt Solutions, signifying a pivotal collaboration in the 3D printing gases market. This alliance aimed to enhance 3D printing solutions and additive manufacturing applications, helping enterprises embrace Industry 4.0 and shaping the evolving landscape of 3D printing technologies
SKU-

- Interactive Data Analysis Dashboard
- Company Analysis Dashboard for high growth potential opportunities
- Research Analyst Access for customization & queries
- Competitor Analysis with Interactive dashboard
- Latest News, Updates & Trend analysis
- Harness the Power of Benchmark Analysis for Comprehensive Competitor Tracking
North America 3d Printing Gases Market, Supply Chain Analysis and Ecosystem Framework
To support market growth and help clients navigate the impact of geopolitical shifts, DBMR has integrated in-depth supply chain analysis into its North America 3d Printing Gases Market research reports. This addition empowers clients to respond effectively to global changes affecting their industries. The supply chain analysis section includes detailed insights such as North America 3d Printing Gases Market consumption and production by country, price trend analysis, the impact of tariffs and geopolitical developments, and import and export trends by country and HSN code. It also highlights major suppliers with data on production capacity and company profiles, as well as key importers and exporters. In addition to research, DBMR offers specialized supply chain consulting services backed by over a decade of experience, providing solutions like supplier discovery, supplier risk assessment, price trend analysis, impact evaluation of inflation and trade route changes, and comprehensive market trend analysis.
Data collection and base year analysis are done using data collection modules with large sample sizes. The stage includes obtaining market information or related data through various sources and strategies. It includes examining and planning all the data acquired from the past in advance. It likewise envelops the examination of information inconsistencies seen across different information sources. The market data is analysed and estimated using market statistical and coherent models. Also, market share analysis and key trend analysis are the major success factors in the market report. To know more, please request an analyst call or drop down your inquiry.
The key research methodology used by DBMR research team is data triangulation which involves data mining, analysis of the impact of data variables on the market and primary (industry expert) validation. Data models include Vendor Positioning Grid, Market Time Line Analysis, Market Overview and Guide, Company Positioning Grid, Patent Analysis, Pricing Analysis, Company Market Share Analysis, Standards of Measurement, Global versus Regional and Vendor Share Analysis. To know more about the research methodology, drop in an inquiry to speak to our industry experts.
Data Bridge Market Research is a leader in advanced formative research. We take pride in servicing our existing and new customers with data and analysis that match and suits their goal. The report can be customized to include price trend analysis of target brands understanding the market for additional countries (ask for the list of countries), clinical trial results data, literature review, refurbished market and product base analysis. Market analysis of target competitors can be analyzed from technology-based analysis to market portfolio strategies. We can add as many competitors that you require data about in the format and data style you are looking for. Our team of analysts can also provide you data in crude raw excel files pivot tables (Fact book) or can assist you in creating presentations from the data sets available in the report.


