
North America Abrasive Market
Market Size in USD Billion
 USD
9.63 Billion
USD
14.34 Billion
2025
2033
USD
9.63 Billion
USD
14.34 Billion
2025
2033
| 2026 - 2033 | |
| USD 9.63 Billion | |
| USD 14.34 Billion | |
| % | |
|
North America Abrasives Market Size
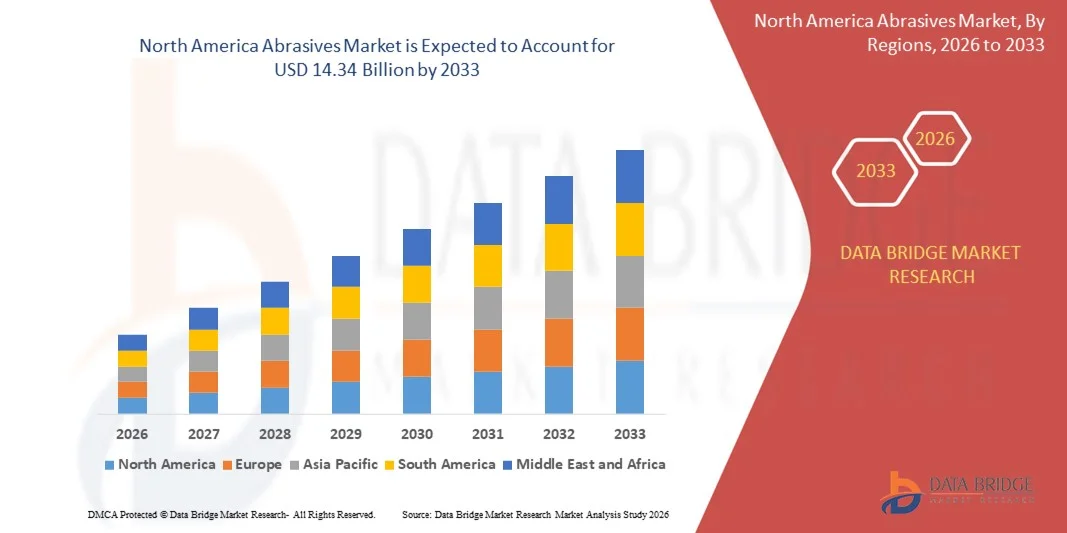
- The North America abrasives market size was valued at USD 9.63 billion in 2025 and is expected to reach USD 14.34 billion by 2033, at a CAGR of 5.10% during the forecast period
- The market growth is largely fuelled by the rising demand from industries such as automotive, metal fabrication, machinery, construction, and electronics
- Technological advancements in abrasive materials such as super abrasives and coated abrasives are contributing to enhanced efficiency and productivity
North America Abrasives Market Analysis
- The market is witnessing strong momentum driven by rapid industrialisation, expansion of production capacities, and rising adoption of advanced surface finishing and precision machining technologies
- Growing investments in infrastructure development and construction activities are boosting demand for abrasives across various applications
- U.S. dominated the North America abrasives market in 2025 due to strong demand across aerospace, automotive, machinery, and metal fabrication industries. High adoption of precision grinding and advanced finishing technologies drives extensive usage of super abrasives such as diamond and CBN
- Canada is expected to witness the highest compound annual growth rate (CAGR) in the North America abrasives market due to expanding industrial activities, rising demand for high-performance abrasives in construction and metalworking, and increasing technological upgrades across manufacturing facilities
- The synthetic segment held the largest market revenue share in 2025 driven by its higher durability, uniform grain structure, and consistent performance across heavy-duty industrial applications. Synthetic abrasives are widely preferred in modern machining environments due to their superior cutting efficiency and suitability for precision processes
Report Scope and North America Abrasives Market Segmentation
|
Attributes |
North America Abrasives Key Market Insights |
|
Segments Covered |
|
|
Countries Covered |
North America
|
|
Key Market Players |
|
|
Market Opportunities |
|
|
Value Added Data Infosets |
In addition to the insights on market scenarios such as market value, growth rate, segmentation, geographical coverage, and major players, the market reports curated by the Data Bridge Market Research also include import export analysis, production capacity overview, production consumption analysis, price trend analysis, climate change scenario, supply chain analysis, value chain analysis, raw material/consumables overview, vendor selection criteria, PESTLE Analysis, Porter Analysis, and regulatory framework. |
North America Abrasives Market Trends
Shift Toward Precision and High-Performance Abrasive Solutions
- The growing demand for precision finishing in sectors such as automotive, aerospace, and general manufacturing is accelerating the adoption of advanced abrasive products. High-performance abrasives support superior material removal, tighter tolerances, and improved surface quality, making them essential for modern production processes. The shift is also driven by the need for highly reliable tools that can maintain consistency across large-scale and complex operations
- The rising use of automated grinding and polishing machinery is driving the need for engineered abrasives that offer consistency, durability, and enhanced operational efficiency. These solutions help reduce downtime and maintain output quality in highly automated environments, ensuring minimal process interruptions. They also enhance the performance of modern robotic and CNC systems that demand uniform abrasive behavior
- Increasing preference for coated and superabrasives is reshaping fabrication workflows, especially in tasks requiring low heat generation and minimal surface damage. Their longer service life and improved cutting efficiency make them suitable for high-precision applications that require stable output over extended cycles. These properties help manufacturers reduce tool change frequency and improve production throughput
- For instance, in 2023, multiple manufacturing facilities reported improved cost efficiency and higher machining accuracy after adopting ceramic-coated abrasive belts for precision component finishing. These belts provided better durability and more uniform finishing across large production cycles, reducing rework rates. Their enhanced wear resistance also minimized operational delays and tool replacement costs
- While high-performance abrasives are transforming production, sustained progress depends on continuous product innovation, operator training, and cost optimization. Manufacturers must prioritize application-specific solutions to meet evolving industry needs and ensure the best fit for diverse machining environments. Collaboration between abrasive producers and end users is becoming increasingly important for developing tailored solutions
North America Abrasives Market Dynamics
Driver
Rising Industrialization and Expansion of Manufacturing Activities
- The expansion of manufacturing, metalworking, and construction activities is increasing the demand for abrasives used for grinding, cutting, polishing, and finishing operations. As production scales up, abrasive tools become essential for improving efficiency and maintaining product quality across various materials. This trend is further supported by rising adoption of advanced machining techniques
- Industries are increasingly recognizing the benefits of advanced abrasives in reducing machining time, improving equipment longevity, and ensuring consistent finishing results. This awareness is driving higher adoption across small, mid-sized, and large production units seeking greater operational efficiency. The reliability of premium abrasives also reduces the risk of output variability
- Supportive industrial development, technological upgrades, and investments in modern fabrication processes are further boosting the need for reliable abrasive products. Growing use of CNC machines and precision machining tools is reinforcing demand for abrasives that can support high-speed operations. The integration of digital manufacturing systems is also contributing to more precise abrasive usage
- For instance, in 2022, several manufacturing plants reported enhanced productivity after integrating high-performance bonded and coated abrasives into their machining processes, improving output without major equipment modifications. These improvements helped streamline operations and reduce total machining costs. Plants also observed better tool performance and reduced maintenance requirements
- While industrial growth is supporting the market, consistent quality standards, technical support, and wider availability of advanced abrasive types remain essential for long-term adoption. Manufacturers must also address increasing expectations around operational efficiency and sustainability. Ensuring product reliability is key to building trust among end users
Restraint/Challenge
Fluctuating Raw Material Prices and Environmental Compliance Costs
- Abrasive producers face challenges due to fluctuations in the prices of raw materials such as aluminum oxide, silicon carbide, zirconia alumina, and synthetic diamonds. These variations affect overall manufacturing costs and influence product pricing for end users, especially in cost-sensitive sectors. Managing these fluctuations requires strategic sourcing and efficient production planning
- Compliance with strict environmental, occupational safety, and waste management regulations increases operational expenses for abrasive manufacturers. Smaller producers often struggle to meet these standards, limiting their competitiveness and ability to scale operations. These requirements also push companies to adopt cleaner and more sustainable production technologies
- Supply chain inconsistencies and variable access to key raw materials contribute to production delays, affecting product availability and reliability. Such disruptions can hinder market penetration, particularly for specialized abrasive products that require consistent material quality. Ensuring raw material stability is becoming a critical focus for manufacturers
- For instance, in 2023, several abrasive producers reported increased production expenses stemming from rising energy costs and stricter compliance requirements, impacting the affordability of premium abrasive solutions. These increased costs also influenced product development timelines and market pricing strategies. Many companies expressed concern about long-term cost sustainability
- While cost and regulatory challenges persist, improving supply chain resilience, promoting sustainable production practices, and optimizing raw material usage are critical for unlocking long-term growth potential. Companies must also invest in innovation to develop cost-effective alternatives without compromising performance. Strategic planning will be essential to remain competitive in a challenging market environment
North America Abrasives Market Scope
The market is segmented on the basis of raw materials, type, product, form, application, and end-user
- By Raw Materials
On the basis of raw materials, the North America abrasives market is segmented into natural and synthetic. The synthetic segment held the largest market revenue share in 2025 driven by its higher durability, uniform grain structure, and consistent performance across heavy-duty industrial applications. Synthetic abrasives are widely preferred in modern machining environments due to their superior cutting efficiency and suitability for precision processes.
The natural segment is expected to witness a steady growth rate from 2026 to 2033 supported by the increasing use of eco-friendly and cost-effective abrasive materials for light-to-medium finishing tasks. Natural abrasives are gaining traction among industries seeking sustainable alternatives that offer adequate performance for non-critical applications.
- By Type
On the basis of type, the North America abrasives market is segmented into coated abrasive, bonded abrasive, super abrasive, and others. The bonded abrasive segment held the largest market revenue share in 2025 owing to its extensive use in grinding, cutting, and heavy material removal across manufacturing and metalworking operations. Its structural strength and long service life make it a preferred choice for high-load applications.
The super abrasive segment is expected to witness the fastest growth rate from 2026 to 2033 driven by the rising demand for precision machining in sectors such as aerospace, automotive, and electronics. Super abrasives such as diamond and CBN offer superior hardness, thermal stability, and accuracy, making them ideal for high-tolerance processes.
- By Product
On the basis of product, the North America abrasives market is segmented into disc, cups, cylinder, and others. The disc segment dominated the market in 2025 due to its widespread usage in metal fabrication, woodworking, and surface preparation tasks. Disc abrasives offer versatility, ease of installation, and compatibility with various handheld and automated tools.
The cylinder segment is expected to witness the fastest growth rate from 2026 to 2033 supported by increasing adoption in applications requiring uniform material removal and internal surface finishing. Their cylindrical shape provides superior control and stability, making them suitable for industrial grinding and deburring operations.
- By Form
On the basis of form, the North America abrasives market is segmented into block form and powdered form. The block form segment held the largest market revenue share in 2025 driven by its high demand in polishing, sharpening, and manual finishing applications. Block abrasives are valued for their longevity, ease of handling, and suitability for both industrial and workshop environments.
The powdered form segment is expected to witness substantial growth from 2026 to 2033 encouraged by its increasing use in lapping, micro-finishing, and precision polishing processes. Powdered abrasives offer exceptional control over grain size distribution, enabling fine-grade finishing required in electronics, optics, and advanced manufacturing.
- By Application
On the basis of application, the North America abrasives market is segmented into grinding, cutting, polishing, drilling, finishing, and others. The grinding segment held the largest market revenue share in 2025 owing to its central role in material shaping, surface preparation, and heavy stock removal across manufacturing industries. Grinding abrasives are essential for achieving dimensional accuracy and smooth surfaces.
The polishing segment is expected to register strong growth from 2026 to 2033 supported by increasing demand for high-quality surface finishing in automotive, electronics, and consumer goods. Polishing abrasives enhance aesthetic appeal and functional performance, making them crucial in final-stage manufacturing processes.
- By End-User
On the basis of end-user, the North America abrasives market is segmented into automotive, machinery, aerospace and defence, metal fabrication, building and construction, medical devices, oil and gas, electrical and electronics, and others. The metal fabrication segment captured the largest market revenue share in 2025 driven by the extensive use of abrasives in welding, cutting, grinding, and surface preparation. Abrasives play a key role in improving production efficiency and maintaining structural quality.
The automotive segment is expected to witness significant growth from 2026 to 2033 propelled by rising demand for precision components, lightweight materials, and superior finishing standards in vehicle manufacturing. Advanced abrasives support high-accuracy machining, paint preparation, and surface correction, making them indispensable in automotive production.
North America Abrasives Market Regional Analysis
- The U.S. dominated the North America abrasives market in 2025 due to strong demand across aerospace, automotive, machinery, and metal fabrication industries. High adoption of precision grinding and advanced finishing technologies drives extensive usage of super abrasives such as diamond and CBN
- The country’s advanced manufacturing ecosystem relies heavily on coated, bonded, and non-woven abrasive solutions for high-end machining operations. Industries prioritise efficiency, accuracy, and surface finishing quality, leading to increased consumption of innovative abrasive products
- Strong technological innovation and the presence of leading global abrasive producers support continuous product advancement. High investment in R&D, material engineering, and high-performance machining solutions ensures consistent improvement in abrasive quality
Canada Abrasives Market Insight
The Canada abrasives market is expected to witness the fastest growth rate from 2026 to 2033 within North America, supported by accelerating construction activity, expanding metal fabrication capacity, and increased reliance on advanced machining solutions. The growing adoption of coated and bonded abrasives for woodworking, automotive repair, and industrial maintenance is propelling demand. In addition, the rise in manufacturing modernisation initiatives and investments in high-precision equipment is driving strong market expansion across the country.
North America Abrasives Market Share
The North America abrasives industry is primarily led by well-established companies, including:
• 3M Company (U.S.)
• Ervin Industries (U.S.)
• Buffalo Abrasives, Inc. (U.S.)
• Weiler Corporation (U.S.)
• Aearo Holding LLC (U.S.)
• ACS Industries, Inc. (U.S.)
• Fortune Minerals & Abrasives (Canada)
• Western Abrasive Industries (Canada)
• K. C. Abrasive Co., LLC (U.S.)
• Engis Corporation (U.S.)
SKU-

- Interactive Data Analysis Dashboard
- Company Analysis Dashboard for high growth potential opportunities
- Research Analyst Access for customization & queries
- Competitor Analysis with Interactive dashboard
- Latest News, Updates & Trend analysis
- Harness the Power of Benchmark Analysis for Comprehensive Competitor Tracking
North America Abrasive Market, Supply Chain Analysis and Ecosystem Framework
To support market growth and help clients navigate the impact of geopolitical shifts, DBMR has integrated in-depth supply chain analysis into its North America Abrasive Market research reports. This addition empowers clients to respond effectively to global changes affecting their industries. The supply chain analysis section includes detailed insights such as North America Abrasive Market consumption and production by country, price trend analysis, the impact of tariffs and geopolitical developments, and import and export trends by country and HSN code. It also highlights major suppliers with data on production capacity and company profiles, as well as key importers and exporters. In addition to research, DBMR offers specialized supply chain consulting services backed by over a decade of experience, providing solutions like supplier discovery, supplier risk assessment, price trend analysis, impact evaluation of inflation and trade route changes, and comprehensive market trend analysis.
Data collection and base year analysis are done using data collection modules with large sample sizes. The stage includes obtaining market information or related data through various sources and strategies. It includes examining and planning all the data acquired from the past in advance. It likewise envelops the examination of information inconsistencies seen across different information sources. The market data is analysed and estimated using market statistical and coherent models. Also, market share analysis and key trend analysis are the major success factors in the market report. To know more, please request an analyst call or drop down your inquiry.
The key research methodology used by DBMR research team is data triangulation which involves data mining, analysis of the impact of data variables on the market and primary (industry expert) validation. Data models include Vendor Positioning Grid, Market Time Line Analysis, Market Overview and Guide, Company Positioning Grid, Patent Analysis, Pricing Analysis, Company Market Share Analysis, Standards of Measurement, Global versus Regional and Vendor Share Analysis. To know more about the research methodology, drop in an inquiry to speak to our industry experts.
Data Bridge Market Research is a leader in advanced formative research. We take pride in servicing our existing and new customers with data and analysis that match and suits their goal. The report can be customized to include price trend analysis of target brands understanding the market for additional countries (ask for the list of countries), clinical trial results data, literature review, refurbished market and product base analysis. Market analysis of target competitors can be analyzed from technology-based analysis to market portfolio strategies. We can add as many competitors that you require data about in the format and data style you are looking for. Our team of analysts can also provide you data in crude raw excel files pivot tables (Fact book) or can assist you in creating presentations from the data sets available in the report.


