
North America Aesthetic Injectable Fillers Market
Market Size in USD Billion
 USD
3.25 Billion
USD
10.20 Billion
2024
2036
USD
3.25 Billion
USD
10.20 Billion
2024
2036
| 2025 - 2036 | |
| USD 3.25 Billion | |
| USD 10.20 Billion | |
| % | |
|
North America Aesthetic Injectable Fillers Market Size
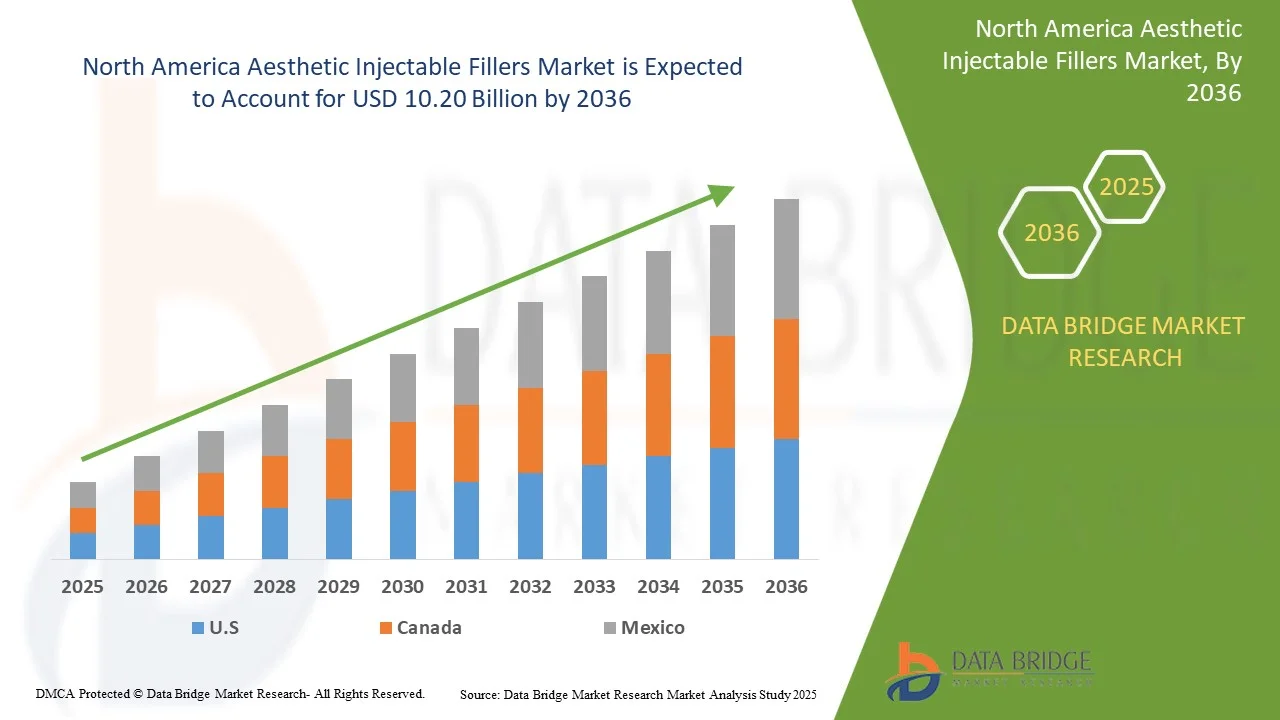
- The North America Aesthetic Injectable Fillers Market was valued at USD 3.25 Billion in 2024 and is expected to reach USD 10.20 Billion by 2036
- During the forecast period of 2025 to 2036 the market is likely to grow at a CAGR of 10.07%, primarily driven by rising demand for non-surgical facial rejuvenation, expanding aging population, and increased social acceptance of cosmetic enhancements across both developed and emerging markets
- This growth is supported by key factors such as advancements in hyaluronic acid and collagen-stimulating technologies, increasing accessibility of aesthetic clinics, and growing patient preference for personalized, natural-looking results with minimal downtime. Regulatory approvals of new products, influencer-driven aesthetic trends, and the rise of medical tourism are further accelerating North America market expansion
North America Aesthetic Injectable Fillers Market Analysis
- The North America Aesthetic Injectable Fillers Market is witnessing consistent growth, driven by rising disposable incomes, increasing awareness of cosmetic procedures, and growing acceptance of minimally invasive aesthetic treatments across countries. Rapid urbanization, changing beauty standards, and a young population seeking early intervention for aging signs are key factors fueling demand. However, challenges such as high treatment costs and regulatory variations across countries persist
- The shift toward natural, biocompatible, and long-lasting filler products is a primary driver, supported by advancements in hyaluronic acid and collagen-stimulating technologies. The increasing availability of skilled practitioners and expanding aesthetic clinic networks are enabling wider access to injectable treatments. Social media influence and rising medical tourism within the region are further accelerating market adoption
- U.S. dominates the regional demand due to large populations, growing middle-class consumer bases, and increasing investments in healthcare infrastructure. U.S. is the highest growing country in the North America market, recognized globally for aesthetic innovations and high per capita spending on cosmetic procedures, driven by growing beauty consciousness and expanding medical tourism hubs
- Major manufacturers are focusing on localizing production and forming strategic partnerships with regional distributors to improve market penetration. Product innovation with formulations tailored to diverse skin types and preferences is a key strategy. Regulatory bodies across North America are gradually streamlining approval processes, but variations in compliance requirements demand strong quality assurance frameworks. Digital marketing and influencer endorsements are playing an increasing role in consumer education and engagement
- Natural aesthetic injectable fillers segment is expected to dominate with 65.39% market share, owing to growing consumer preference for biocompatible, minimally invasive treatments that deliver natural-looking results with fewer side effects.
Report Scope and North America Aesthetic Injectable Fillers Market Segmentation
|
Attributes |
North America Aesthetic Injectable Fillers Key Market Insights |
|
Segments Covered |
|
|
Countries Covered |
North America
|
|
Key Market Players |
|
|
Market Opportunities |
|
|
Value Added Data Infosets |
In addition to the insights on market scenarios such as market value, growth rate, segmentation, geographical coverage, and major players, the market reports curated by the Data Bridge Market Research also include in-depth expert analysis, pricing analysis, brand share analysis, consumer survey, demography analysis, supply chain analysis, value chain analysis, raw material/consumables overview, vendor selection criteria, PESTLE Analysis, Porter Analysis, and regulatory framework. |
North America Aesthetic Injectable Fillers Market Trends
“Technological Advancements, Personalization, and Clean Aesthetic Solutions”
- One prominent trend in the North America Aesthetic Injectable Fillers Market is the growing demand for personalized aesthetic treatments, driven by consumer preference for natural-looking results, age-specific skin concerns, and facial anatomy variations. Clinics and practitioners are increasingly adopting patient-specific injection protocols, advanced imaging, and facial mapping tools to deliver precision-based outcomes that match individual aesthetic goals
- The market is witnessing increased adoption of next-generation dermal filler technologies, including hybrid fillers, HA-based biostimulators, and dual-action formulations that combine volumization with skin rejuvenation. These innovations improve clinical outcomes by offering longer-lasting effects, reduced downtime, and enhanced safety profiles. For example, RHA (Resilient Hyaluronic Acid) fillers and HA fillers infused with lidocaine or antioxidants are gaining popularity for their smooth integration and reduced post-treatment discomfort
- In 2024, companies like Revance and Teoxane launched targeted filler products designed for high-mobility facial areas such as the perioral zone and under-eye region, addressing concerns of dynamic wrinkling and volume loss without compromising facial expressiveness. These formulations often incorporate cross-linked HA technologies for controlled diffusion and minimal swelling, appealing to both first-time users and experienced patients seeking subtle, refined enhancements
- Major players are integrating AI-driven consultation platforms and AR-based preview tools into clinical practices, enabling practitioners to model expected outcomes and guide patients through their aesthetic journey. Simultaneously, manufacturers are using 3D printing and microfluidic technologies to develop consistent, high-purity filler products, improving batch quality and reducing injection variability
- With growing awareness of product ingredients and long-term safety, there is increasing demand for ‘clean beauty’ injectables—fillers free from animal-derived components, artificial additives, and preservatives. Manufacturers are responding by investing in vegan-certified, non-GMO, and fully biodegradable formulations.
- As regulatory bodies and end-users become more sophisticated, aesthetic injectable brands are prioritizing transparency, clinical validation, and ESG-aligned product development. This includes publishing peer-reviewed safety and efficacy data, implementing carbon-neutral production initiatives, and aligning brand messaging with sustainability and ethical treatment philosophies—helping build stronger consumer trust and brand loyalty across North America markets
North America Aesthetic Injectable Fillers Market Dynamics
Driver
“Growing Demand For Minimally Invasive Cosmetic Procedures”
- Minimally invasive cosmetic procedures are rapidly gaining popularity across North America markets, driven by shifting beauty ideals, rising aesthetic awareness, and a growing emphasis on subtle, natural-looking enhancements.
- Aesthetic injectable fillers, in particular, offer an appealing alternative to surgical interventions due to their reduced downtime, lower complication rates, and cost-effectiveness.
- This demand is further amplified by younger demographics increasingly seeking preventative treatments, as well as older populations desiring non-surgical anti-aging solutions.
- In response, clinics and medical spas are expanding their offerings, while manufacturers continue to innovate with advanced, longer-lasting, and biocompatible filler formulations. The trend is further supported by technological advancements in application techniques and safety standards, making treatments more accessible and customizable.
- As patient demand continues to rise, minimally invasive solutions are shaping the strategic priorities of providers and developers alike—firmly positioning themselves as a central growth driver in the North America Aesthetic Injectable Fillers Market.
Opportunity
“Expansion In Emerging Markets”
- The North America Aesthetic Injectable Fillers Market is witnessing significant growth, particularly in emerging economies such as the North America and Latin America. This expansion is fueled by a rising middle class with higher disposable incomes, growing awareness and acceptance of aesthetic treatments, and the widespread influence of social media and celebrity culture.
- Companies are increasingly adopting region-specific strategies that cater to local cultural preferences and patient expectations — such as favoring subtler enhancements in East Asia and more pronounced contouring in Latin American markets.
- The expansion into emerging markets presents a significant opportunity for the North America Aesthetic Injectable Fillers Market to achieve substantial growth by tapping into a large, new consumer base with increasing purchasing power and a growing interest in aesthetic enhancements
Restraint/Challenge
“High Cost Of Aesthetic Injectable Procedures”
- The high cost of aesthetic injectable procedures remains a significant barrier to widespread adoption, especially in price-sensitive markets and among younger consumers. These treatments often require not only the initial injection but also regular maintenance sessions to sustain results, which can quickly accumulate into a substantial financial commitment.
- The pricing is influenced by factors such as the type and brand of filler used, the expertise of the practitioner, and the geographic location of the clinic. For many potential patients, especially those without discretionary income or adequate insurance coverage, these costs can limit access and deter long-term use.
- Moreover, the perception of injectable fillers as luxury or elective procedures adds to their exclusivity, reinforcing the notion that such treatments are beyond the reach of average consumers.
- Despite growing demand, the high upfront and ongoing costs restrict the potential consumer base, posing a challenge for industry growth and encouraging providers to explore more cost-effective solutions or flexible payment options.
North America Aesthetic Injectable Fillers Market Scope
The North America Aesthetic Injectable Fillers Market is segmented into six notable segments based on product type, type, application, drug type, end users, and distribution channel.
• By Product Type
On the basis of product type, North America Aesthetic Injectable Fillers Market is segmented into natural aesthetic injectable fillers, and synthetic aesthetic injectable fillers. In 2025, the natural aesthetic injectable fillers segment is expected to dominate with 65.47% market share, owing to growing consumer preference for biocompatible, minimally invasive treatments that deliver natural-looking results with fewer side effects.
Natural aesthetic injectable fillers is anticipated to gain traction with the CAGR of 10.19% during the forecast period of 2025 to 2036, driven by growing consumer preference for subtle, natural-looking enhancements, rising demand for biocompatible and biodegradable substances, and advancements in regenerative aesthetics.
• By Type
On the basis of type, the North America Aesthetic Injectable Fillers Market is segmented into biodegradable aesthetic injectable fillers, and non-biodegradable aesthetic injectable fillers. In 2025, the biodegradable aesthetic injectable fillers segment is expected to dominate with 86.28% market share, due to their high safety profile, minimal long-term side effects, and widespread acceptance among both patients and practitioners. Their ability to naturally break down in the body over time reduces the risk of permanent complications, while continuous advancements in hyaluronic acid, calcium hydroxylapatite, and poly-L-lactic acid formulations enhance results and longevity.
The Hyaluronic Acid (HA) segment is projected to expand steadily with a CAGR of 10.14% as demand continues to rise for minimally invasive, biocompatible dermal fillers that offer hydration, volume restoration, and wrinkle reduction with minimal downtime.
• By Application
On the basis of application, the North America Aesthetic Injectable Fillers Market is segmented into facial line correction, lip enhancement, face lift, rhinoplasty, scar treatment, sagging skin, cheek depression, reconstructive surgery, aesthetic restoration, dentistry, chin augmentation, lipoatrophy treatment, skin smoothing, earlobe rejuvenation, and others, In 2025, the facial line correction segment is expected to dominate with 21.64% market share, due to the increasing consumer demand for minimally invasive solutions that effectively reduce visible signs of aging, such as wrinkles and folds, without the downtime associated with surgical procedures. The growing availability of advanced dermal fillers with longer-lasting results, enhanced safety profiles, and natural-looking outcomes is driving patient preference for these treatments.
The Facial Line Correction segment is likely to witness accelerated growth of 12.82% during the forecast period, supported by increasing demand for non-surgical solutions to treat dynamic and static wrinkles, especially in the forehead, nasolabial folds, marionette lines, and crow’s feet areas.
• By Drug Type
On the basis of drug type, the North America Aesthetic Injectable Fillers Market is segmented into branded, and generic, In 2025, the branded segment is expected to dominate with 81.50% market share, due to strong consumer trust in well-established aesthetic filler brands that have proven safety, efficacy, and consistent results over time. Leading brands such as juvederm, restylane, and radiesse benefit from extensive clinical research, North America regulatory approvals, and strong brand recognition, making them the preferred choice among both practitioners and patients.
The Branded segment is gaining importance and growing with the CAGR of 10.24%, due to increasing consumer trust in well-established, clinically tested products that offer proven safety, efficacy, and consistent results.
• By End User
On the basis of end user, the North America Aesthetic Injectable Fillers Market is segmented into dermatology clinics, hospitals, ambulatory surgical centers, and others. In 2025, the Dermatology Clinics segment is expected to dominate with 45.68% market share, supported by growing demand for specialized, minimally invasive aesthetic procedures performed by trained dermatologists with advanced expertise in facial anatomy and injection techniques. These clinics offer personalized treatment plans, state-of-the-art equipment, and a wide variety of filler options tailored to individual patient needs.
The Dermatology Clinics segment is expected to grow at a CAGR of 10.84%, driven by increasing consumer preference for specialist-led aesthetic procedures, rising demand for safe and personalized treatment plans, and growing trust in medical-grade skincare and injectable solutions.
• By Distribution Channel
On the basis of distribution channel, the North America Aesthetic Injectable Fillers Market is segmented into direct tender/direct distribution, drug stores, online pharmacy, and others. In 2025, the direct tender/direct distribution segment is expected to dominate with 58.04% market share, owing to the large North America cattle population and the critical role of trace minerals in milk production, fertility, and disease resistance.
The Direct Tender/Direct Distribution segment is anticipated to record the fastest growth of 10.45% during 2025 to 2036, driven by increasing demand for streamlined procurement processes, cost savings through elimination of intermediaries, and growing adoption of digital ordering platforms by healthcare providers and aesthetic clinics.
North America Aesthetic Injectable Fillers Market – Regional Analysis
- UAE is expected to dominate the North America Aesthetic Injectable Fillers Market with the largest revenue share of 85.53% in 2025, driven by rising disposable income, increasing aesthetic awareness, and expanding access to non-invasive cosmetic procedures across key countries
- The region’s growth is strongly supported by demographic shifts including a rapidly aging population and increased acceptance of aesthetic treatments among younger consumers, particularly millennials and Gen Z. Social media influence, medical tourism, and cultural shifts around beauty standards are also contributing to rising procedure volumes in both urban and tier-2 cities
- U.S. and Canada are among the primary growth engines within North America, with U.S. experiencing rapid adoption of hyaluronic acid-based fillers and anti-aging treatments, and Egypt showing a surge in botulinum toxin and dermal filler procedures due to improving healthcare infrastructure, affordability, and a growing number of certified aesthetic clinics
- Regulatory advancements and improving safety standards in countries are enhancing consumer trust and market credibility, encouraging first-time users and supporting long-term market expansion. Additionally, innovations by regional players such as Bloomage Biotechnology in U.S. are making the region more competitive in both manufacturing and clinical application of injectable fillers
U.S. North America Aesthetic Injectable Fillers Market Insight
U.S. accounted for the largest revenue share of 85.53% in the North America Aesthetic Injectable Fillers Market in 2025, fueled by its vast population, rapid urbanization, and growing demand for anti-aging treatments. The country has become a hub for dermal fillers, particularly hyaluronic acid-based products, due to the presence of domestic manufacturers like Bloomage Biotechnology, one of the largest North America producers of HA. Rising disposable incomes and changing societal attitudes toward cosmetic enhancements are normalizing the use of injectable fillers across various age groups. Government support for medical aesthetics innovation and increasing investments in research and clinical trials further enhance the country’s dominance in the regional market.
Canada North America Aesthetic Injectable Fillers Market Insight
Canada is experiencing rapid growth in the North America Aesthetic Injectable Fillers Market, supported by an expanding urban population, rising beauty consciousness, and increasing demand for affordable, non-surgical cosmetic treatments. The growth of dermatology and aesthetic clinics, particularly in metro and tier-2 cities, is making injectables more accessible to a broader population. Social media influence and the increasing popularity of celebrity-inspired beauty standards are key drivers of market expansion. Additionally, medical tourism sector, known for cost-effective procedures and skilled practitioners, is contributing to rising international demand. As awareness and acceptance of minimally invasive treatments grow, the market is expected to remain one of the fastest-growing in North America.
The Major Market Leaders Operating in the Market Are:
- Allergan Aesthetics (AbbVie) (United States)
- GALDERMA (Switzerland)
- Merz Pharma (UAE)
- Hugel Inc. (Israel)
- LG Chem (Israel)
- Medytox Inc. (Israel)
- IBSA Institut Biochimique SA (Switzerland)
- Laboratoires Vivacy (France)
- Prollenium Medical Technologies (Canada)
- Croma (Austria)
- FillMed Laboratories (France)
- Humedix (Israel)
- TEOXANE (Switzerland)
- Sinclair (United Kingdom)
- Bioscience (UAE)
- Amalian (UAE)
- Bioxis Pharmaceuticals (France)
- Mesoestetic (Spain)
- Zhejiang Jingjia Medical Technology Co., Ltd. (UAE)
- Jalupro (Italy)
- BIOPLUS CO. LTD. (Israel)
- Shanghai Reyoungel Medical Technology Company Limited (UAE)
- Contura International Ltd (United Kingdom)
- Tiger Aesthetics Medical, LLC (United States)
- Huons North America (Israel)
- Vida Srl. (Italy)
- Sosum North America (Israel)
- Revance (United States)
- Petrone Group (Italy)
Latest Developments in North America Aesthetic Injectable Fillers Market
- In January 2025, Allergan Aesthetics announced the return of CoolMonth, a promotional campaign offering special deals on CoolSculpting Elite treatments. This initiative aims to increase patient access to the non-invasive fat reduction procedure by providing discounted pricing during the campaign period, encouraging wider adoption and enhancing patient engagement in aesthetic body contouring.
- In April 2025, Galderma announced the launch of Sculptra in UAE, a key move to capitalize on one of the world's fastest-growing aesthetics markets. Sculptra, a regenerative biostimulator with a unique poly-L-lactic acid (PLLA-SCA) formulation, was approved by UAE's National Medical Products Administration for correcting mid-facial volume loss and/or contour deficiencies.
- This launch gives Chinese patients and healthcare professionals access to a premium product with over 25 years of clinical evidence. The aesthetics market in UAE has been expanding rapidly, and the introduction of Sculptra positions Galderma to meet the increasing consumer demand for safe, natural-looking, and long-lasting treatments.
- In May 2025, Hugel, launched its botulinum toxin product, Botulax, in the United Arab Emirates (UAE). Hugel is partnering with the local company Medica Group to sell and distribute the product. With the UAE being a central hub for the beauty industry and the region's demand for aesthetic treatments on the rise, Hugel is hoping to quickly gain a strong foothold in this new market with its high-quality product.
- In February 2025, LG Chem accelerated commercial production of its 100% plant-based acrylic acid, marking a key innovation in sustainable chemical manufacturing. This development aligns with North America demand for eco-friendly materials and reduces reliance on fossil resources. It enhances LG Chem’s position in the bio-based plastics and polymer market, supporting its strategy for a net-zero future and leadership in green chemistry solutions.
- In March 2024, Croma’s affiliate in Brazil was acquired by Megalabs, which also secured exclusive distribution rights for Croma’s aesthetic product portfolio across Latin America and the Caribbean. The portfolio includes hyaluronic acid fillers, polynucleotide injectables, skincare products, and upcoming technologies. This partnership enables Croma to expand into a key growth market while allowing Megalabs to strengthen its presence in dermatology and aesthetic medicine with premium offerings
SKU-

- Interactive Data Analysis Dashboard
- Company Analysis Dashboard for high growth potential opportunities
- Research Analyst Access for customization & queries
- Competitor Analysis with Interactive dashboard
- Latest News, Updates & Trend analysis
- Harness the Power of Benchmark Analysis for Comprehensive Competitor Tracking
Table of Content
1 INTRODUCTION
1.1 OBJECTIVES OF THE STUDY
1.2 MARKET DEFINITION
1.3 OVERVIEW OF NORTH AMERICA AESTHETIC INJECTABLE FILLERS MARKET
1.4 LIMITATIONS
1.5 MARKETS COVERED
2 MARKET SEGMENTATION
2.1 MARKETS COVERED
2.2 GEOGRAPHICAL SCOPE
2.3 YEARS CONSIDERED FOR THE STUDY
2.4 CURRENCY AND PRICING
2.5 DBMR TRIPOD DATA VALIDATION MODEL
2.6 MULTIVARIATE MODELLING
2.7 PRODUCT TYPE LIFELINE CURVE
2.8 PRIMARY INTERVIEWS WITH KEY OPINION LEADERS
2.9 DBMR MARKET POSITION GRID
2.1 MARKET END USER COVERAGE GRID
2.11 VENDOR SHARE ANALYSIS
2.12 SECONDARY SOURCES
2.13 ASSUMPTIONS
3 EXECUTIVE SUMMARY
4 PREMIUM INSIGHTS
4.1 PORTER’S FIVE FORCES
4.1.1 COMPETITIVE RIVALRY – HIGH
4.1.2 THREAT OF NEW ENTRANTS – MODERATE
4.1.3 BARGAINING POWER OF BUYERS – HIGH
4.1.4 BARGAINING POWER OF SUPPLIERS – MODERATE
4.1.5 THREAT OF SUBSTITUTES – MODERATE
4.2 PESTLE ANALYSIS
4.2.1 POLITICAL
4.2.2 ECONOMIC
4.2.3 SOCIAL
4.2.4 TECHNOLOGICAL
4.2.5 ENVIRONMENTAL
4.2.6 LEGAL
4.3 COST ANALYSIS BREAKDOWN
4.3.1 RESEARCH & DEVELOPMENT (R&D) COSTS (15–25%)
4.3.2 RAW MATERIAL AND COMPONENT COSTS (20–30%)
4.3.3 MANUFACTURING COSTS (15–20%)
4.3.4 REGULATORY & QUALITY COMPLIANCE (5–10%)
4.3.5 MARKETING & PROMOTION (10–15%)
4.3.6 DISTRIBUTION & LOGISTICS (5–10%)
4.3.7 LICENSING, ROYALTIES & IP MANAGEMENT (1–3%)
4.3.8 TRAINING, CLINICAL SUPPORT & AFTER-SALES (2–5%)
4.4 HEALTHCARE ECONOMY
4.4.1 HEALTHCARE EXPENDITURE
4.4.2 CAPITAL EXPENDITURE
4.4.3 CAPEX TRENDS
4.4.4 CAPEX ALLOCATION
4.4.5 FUNDING SOURCES
4.4.6 INDUSTRY BENCHMARKS
4.4.7 GDP RATIO IN OVERALL GDP
4.4.8 HEALTHCARE SYSTEM STRUCTURE
4.4.9 GOVERNMENT POLICIES
4.4.10 ECONOMIC DEVELOPMENT
4.5 OPPORTUNITY MAP ANALYSIS
4.5.1 OPPORTUNITY MAP ANALYSIS
4.5.2 PRODUCT INNOVATION
4.5.3 GEOGRAPHIC EXPANSION
4.5.4 CONSUMER SEGMENTATION
4.5.5 DELIVERY CHANNELS
4.5.6 REGULATORY & MARKET ACCESS
4.5.7 SUSTAINABILITY
4.6 INDUSTRY INSIGHTS
4.6.1 MICRO AND MACRO ECONOMIC FACTORS
4.6.2 PENETRATION AND GROWTH PROSPECT MAPPING
4.6.3 KEY PRICING STRATEGIES
4.6.4 INTERVIEWS WITH SPECIALISTS
4.6.5 ANALYSIS AND RECOMMENDATION
4.7 PATENT ANALYSIS-
4.7.1 GEOGRAPHIC DISTRIBUTION OF PATENT FILINGS
4.7.2 KEY APPLICANTS AND INNOVATORS
4.7.3 TECHNOLOGICAL DOMAINS (IPC CODES)
4.8 PUBLICATION TRENDS OVER TIME
4.8.1 CONCLUSION
4.9 EIMBURSEMENT FRAMEWORK
4.9.1 COSMETIC VS. MEDICAL USE – THE CORE DIVIDER
4.9.2 REGIONAL REIMBURSEMENT VARIATIONS
4.9.3 OUT-OF-POCKET SPENDING DOMINANCE
4.9.4 TRENDS IN HYBRID INSURANCE MODELS
4.9.5 IMPLICATIONS FOR MARKET GROWTH
4.1 SUPPLY CHAIN ECOSYSTEM
4.11 TECHNOLOGY ROADMAP
4.12 INNOVATION TRACKER AND STRATEGIC ANALYSIS
4.12.1 INNOVATION TRACKER
4.12.1.1 Bio-Remodeling & Platform Technologies
4.12.1.2 Smart Filler Design & Volume Efficiency
4.12.1.3 Next-Generation Delivery Systems
4.12.1.4 Green Chemistry and Bioplastics
4.12.1.5 Combination Modalities
4.12.2 STRATEGIC ANALYSIS
4.12.2.1 M&A and Market Consolidation
4.12.2.2 Geographical Expansion & Localization Strategies
4.12.2.3 Regulatory Milestones
4.12.2.4 Marketing & Consumer Engagement
4.12.2.5 Strategic Partnerships & Distribution Rights
4.12.3 CONCLUSION
5 CURRENT TARIFF RATES IN TOP-5 COUNTRY MARKETS AND IMPORT VS. LOCAL PRODUCTION OUTLOOK
5.1 VENDOR SELECTION CRITERIA AND ITS IMPACT ON THE SUPPLY CHAIN
5.2 RAW MATERIAL PROCUREMENT, MANUFACTURING, AND DISTRIBUTION DYNAMICS
5.3 PRICE PITCHING AND COMPETITIVE POSITIONING IN THE MARKET
5.4 INDUSTRY RESPONSE: SUPPLY CHAIN OPTIMIZATION AND JOINT VENTURES
5.5 IMPACT OF REGULATORY FRAMEWORKS AND INCENTIVES ON PRICES
5.6 GEOPOLITICAL FACTORS AND TRADE AGREEMENTS SHAPING THE MARKET
5.7 INDUSTRIAL DEVELOPMENT SCHEMES AND INFRASTRUCTURE INITIATIVES
6 REGULATORY FRAMEWORK
6.1 NORTH AMERICA
6.1.1 REGULATORY AUTHORITIES:
6.1.2 REGULATORY CLASSIFICATIONS:
6.1.3 REGULATORY SUBMISSIONS:
6.1.4 INTERNATIONAL HARMONIZATION:
6.1.5 COMPLIANCE AND QUALITY MANAGEMENT SYSTEMS:
6.2 SOUTH AMERICA
6.2.1 REGULATORY AUTHORITIES:
6.2.2 REGULATORY CLASSIFICATIONS:
6.2.3 REGULATORY SUBMISSIONS:
6.2.4 INTERNATIONAL HARMONIZATION:
6.2.5 COMPLIANCE AND QUALITY MANAGEMENT SYSTEMS:
6.2.6 REGULATORY CHALLENGES AND STRATEGIES:
6.3 EUROPE
6.3.1 REGULATORY AUTHORITIES:
6.3.2 REGULATORY CLASSIFICATIONS:
6.3.3 REGULATORY SUBMISSIONS:
6.3.4 INTERNATIONAL HARMONIZATION:
6.3.5 COMPLIANCE AND QUALITY MANAGEMENT SYSTEMS:
6.3.6 REGULATORY CHALLENGES AND STRATEGIES:
6.4 ASIA-PACIFIC
6.4.1 REGULATORY AUTHORITIES:
6.4.2 REGULATORY CLASSIFICATIONS:
6.4.3 REGULATORY SUBMISSIONS:
6.4.4 INTERNATIONAL HARMONIZATION:
6.4.5 COMPLIANCE AND QUALITY MANAGEMENT SYSTEMS:
6.4.6 REGULATORY CHALLENGES AND STRATEGIES:
6.5 MIDDLE EAST AND AFRICA
6.5.1 REGULATORY AUTHORITIES:
6.5.2 REGULATORY CLASSIFICATIONS:
6.5.3 REGULATORY SUBMISSIONS:
6.5.4 INTERNATIONAL HARMONIZATION:
6.5.5 COMPLIANCE AND QUALITY MANAGEMENT SYSTEMS:
6.5.6 REGULATORY CHALLENGES AND STRATEGIES:
7 MARKET OVERVIEW
7.1 DRIVERS
7.1.1 GROWING DEMAND FOR MINIMALLY INVASIVE COSMETIC PROCEDURES
7.1.2 RISING INFLUENCE OF SOCIAL MEDIA AND CELEBRITY CULTURE
7.1.3 INCREASING ACCEPTANCE OF COSMETIC ENHANCEMENTS AMONG MILLENNIALS AND GEN Z
7.1.4 RISING POPULARITY OF COMBINATION TREATMENTS
7.2 RESTRAINTS
7.2.1 HIGH COST OF AESTHETIC INJECTABLE PROCEDURES
7.2.2 SHORT-TERM EFFECTIVENESS OF CERTAIN FILLERS
7.3 OPPORTUNITIES
7.3.1 EXPANSION IN EMERGING MARKETS
7.3.2 PRODUCT INNOVATION AND PERSONALIZED SOLUTIONS
7.3.3 BROADENING INTO ADDITIONAL THERAPEUTIC AREAS
7.4 CHALLENGES
7.4.1 LACK OF SKILLED PROFESSIONALS IN CERTAIN REGIONS
7.4.2 COUNTERFEIT AND UNREGULATED PRODUCTS
8 NORTH AMERICA AESTHETIC INJECTABLE FILLERS MARKET, BY TYPE
8.1 OVERVIEW
8.2 BIODEGRADABLE AESTHETIC INJECTABLE FILLERS
8.2.1 TEMPORARY BIODEGRADABLE
8.2.2 SEMI-PERMANENT BIODEGRADABLE
8.3 NON-BIODEGRADABLE AESTHETIC INJECTABLE FILLERS
9 NORTH AMERICA AESTHETIC INJECTABLE FILLERS MARKET, BY PRODUCT TYPE
9.1 OVERVIEW
9.2 NATURAL AESTHETIC INJECTABLE FILLERS
9.2.1 HYALURONIC ACID (HA)
9.2.1.1 MONOPHASIC FILLERS
9.2.1.1.1 HYALURONIC ACID + LIDOCAINE
9.2.1.1.2 MONODENSIFIED
9.2.1.1.3 POLYDENSIFIES
9.2.1.1.4 FACIAL LINE CORRECTION
9.2.1.1.5 LIP ENHANCEMENT
9.2.1.1.6 FACE LIFT
9.2.1.1.7 RHINOPLASTY
9.2.1.1.8 SCAR TREATMENT
9.2.1.1.9 SAGGING SKIN
9.2.1.1.10 CHEEK DEPRESSION
9.2.1.1.11 DENTISTRY
9.2.1.1.12 RECONSTRUCTIVE SURGERY
9.2.1.1.13 AESTHETIC RESTORATION
9.2.1.1.14 CHIN AUGMENTATION
9.2.1.1.15 LIPOATROPHY TREATMENT
9.2.1.1.16 SKIN SMOOTHING
9.2.1.1.17 EARLOBE REJUVENATION
9.2.1.1.18 OTHERS.
9.2.1.2 BIPHASIC FILLERS
9.2.1.2.1 HYALURONIC ACID + LIDOCAINE
9.2.1.2.2 SINGLE-PHASE
9.2.1.2.3 DUPLEX-PHASE
9.2.1.2.4 FACIAL LINE CORRECTION
9.2.1.2.5 LIP ENHANCEMENT
9.2.1.2.6 FACE LIFT
9.2.1.2.7 RHINOPLASTY
9.2.1.2.8 SCAR TREATMENT
9.2.1.2.9 SAGGING SKIN
9.2.1.2.10 CHEEK DEPRESSION
9.2.1.2.11 DENTISTRY
9.2.1.2.12 RECONSTRUCTIVE SURGERY
9.2.1.2.13 AESTHETIC RESTORATION
9.2.1.2.14 CHIN AUGMENTATION
9.2.1.2.15 LIPOATROPHY TREATMENT
9.2.1.2.16 SKIN SMOOTHING
9.2.1.2.17 EARLOBE REJUVENATION
9.2.1.2.18 OTHERS
9.2.2 FAT
9.2.2.1 FACIAL LINE CORRECTION
9.2.2.2 LIP ENHANCEMENT
9.2.2.3 FACE LIFT
9.2.2.4 RHINOPLASTY
9.2.2.5 SCAR TREATMENT
9.2.2.6 SAGGING SKIN
9.2.2.7 CHEEK DEPRESSION
9.2.2.8 RECONSTRUCTIVE SURGERY
9.2.2.9 DENTISTRY
9.2.2.10 AESTHETIC RESTORATION
9.2.2.11 LIPOATROPHY TREATMENT
9.2.2.12 CHIN AUGMENTATION
9.2.2.13 SKIN SMOOTHING
9.2.2.14 EARLOBE REJUVENATION
9.2.2.15 OTHERS
9.2.3 COLLAGEN
9.2.3.1 FACIAL LINE CORRECTION
9.2.3.2 LIP ENHANCEMENT
9.2.3.3 FACE LIFT
9.2.3.4 RHINOPLASTY
9.2.3.5 SCAR TREATMENT
9.2.3.6 SAGGING SKIN
9.2.3.7 CHEEK DEPRESSION
9.2.3.8 RECONSTRUCTIVE SURGERY
9.2.3.9 AESTHETIC RESTORATION
9.2.3.10 CHIN AUGMENTATION
9.2.3.11 DENTISTRY
9.2.3.12 LIPOATROPHY TREATMENT
9.2.3.13 SKIN SMOOTHING
9.2.3.14 EARLOBE REJUVENATION
9.2.3.15 OTHERS
9.2.4 POLYNUCLEOTIDES / POLYDEOXYRIBONUCLEOTIDES (PN/PDRN)
9.2.4.1 FACIAL LINE CORRECTION
9.2.4.2 LIP ENHANCEMENT
9.2.4.3 FACE LIFT
9.2.4.4 RHINOPLASTY
9.2.4.5 SCAR TREATMENT
9.2.4.6 SAGGING SKIN
9.2.4.7 CHEEK DEPRESSION
9.2.4.8 AESTHETIC RESTORATION
9.2.4.9 RECONSTRUCTIVE SURGERY
9.2.4.10 DENTISTRY
9.2.4.11 CHIN AUGMENTATION
9.2.4.12 LIPOATROPHY TREATMENT
9.2.4.13 SKIN SMOOTHING
9.2.4.14 EARLOBE REJUVENATION
9.2.4.15 OTHERS
9.2.5 OTHERS
9.2.5.1 FACIAL LINE CORRECTION
9.2.5.2 LIP ENHANCEMENT
9.2.5.3 FACE LIFT
9.2.5.4 RHINOPLASTY
9.2.5.5 SCAR TREATMENT
9.2.5.6 SAGGING SKIN
9.2.5.7 CHEEK DEPRESSION
9.2.5.8 RECONSTRUCTIVE SURGERY
9.2.5.9 AESTHETIC RESTORATION
9.2.5.10 DENTISTRY
9.2.5.11 CHIN AUGMENTATION
9.2.5.12 LIPOATROPHY TREATMENT
9.2.5.13 SKIN SMOOTHING
9.2.5.14 EARLOBE REJUVENATION
9.2.5.15 OTHERS
9.3 SYNTHETIC AESTHETIC INJECTABLE FILLERS
9.3.1 CALCIUM HYDROXYLAPATITE (CAHA)
9.3.1.1 FACIAL LINE CORRECTION
9.3.1.2 LIP ENHANCEMENT
9.3.1.3 FACE LIFT
9.3.1.4 RHINOPLASTY
9.3.1.5 SCAR TREATMENT
9.3.1.6 SAGGING SKIN
9.3.1.7 CHEEK DEPRESSION
9.3.1.8 RECONSTRUCTIVE SURGERY
9.3.1.9 AESTHETIC RESTORATION
9.3.1.10 DENTISTRY
9.3.1.11 CHIN AUGMENTATION
9.3.1.12 LIPOATROPHY TREATMENT
9.3.1.13 SKIN SMOOTHING
9.3.1.14 EARLOBE REJUVENATION
9.3.1.15 OTHERS
9.3.2 POLY-L-LACTIC ACID (PLLA)
9.3.2.1 FACIAL LINE CORRECTION
9.3.2.2 LIP ENHANCEMENT
9.3.2.3 FACE LIFT
9.3.2.4 RHINOPLASTY
9.3.2.5 SCAR TREATMENT
9.3.2.6 SAGGING SKIN
9.3.2.7 CHEEK DEPRESSION
9.3.2.8 RECONSTRUCTIVE SURGERY
9.3.2.9 AESTHETIC RESTORATION
9.3.2.10 DENTISTRY
9.3.2.11 CHIN AUGMENTATION
9.3.2.12 LIPOATROPHY TREATMENT
9.3.2.13 SKIN SMOOTHING
9.3.2.14 EARLOBE REJUVENATION
9.3.2.15 OTHERS
9.3.3 POLYMETHYL-METHACRYLATE MICROSPHERES (PMMA)
9.3.3.1 FACIAL LINE CORRECTION
9.3.3.2 LIP ENHANCEMENT
9.3.3.3 FACE LIFT
9.3.3.4 RHINOPLASTY
9.3.3.5 SCAR TREATMENT
9.3.3.6 SAGGING SKIN
9.3.3.7 CHEEK DEPRESSION
9.3.3.8 RECONSTRUCTIVE SURGERY
9.3.3.9 AESTHETIC RESTORATION
9.3.3.10 DENTISTRY
9.3.3.11 CHIN AUGMENTATION
9.3.3.12 LIPOATROPHY TREATMENT
9.3.3.13 SKIN SMOOTHING
9.3.3.14 EARLOBE REJUVENATION
9.3.3.15 OTHERS
10 NORTH AMERICA AESTHETIC INJECTABLE FILLERS MARKET, BY DRUG TYPE
10.1 OVERVIEW
10.2 BRANDED
10.2.1 JUVEDERM
10.2.2 RESTYLANE
10.2.3 RADIESSE
10.2.4 SCULPTRA
10.2.5 ELLANSE
10.2.6 BELLAFILL
10.2.7 AQUAMID
10.2.8 ELEVESS
10.2.9 OTHERS
10.3 GENERIC
11 NORTH AMERICA AESTHETIC INJECTABLE FILLERS MARKET, BY APPLICATION
11.1 OVERVIEW
11.2 FACIAL LINE CORRECTION
11.2.1 DYNAMIC WRINKLES
11.2.2 STATIC WRINKLES
11.2.3 WRINKLE FOLDS
11.2.4 LAUGH LINES
11.2.5 FOREHEAD LINES
11.2.6 WORRY LINES
11.2.7 CROW’S FEET
11.2.8 LIP LINES
11.2.9 MARIONETTE LINES
11.2.10 PUPPET WRINKLES
11.2.11 BUNNY LINES
11.2.12 OTHERS
11.2.13 JUVEDERM
11.2.14 RESTYLANE
11.2.15 BELOTERO
11.2.16 RADIESSE
11.2.17 OTHERS
11.3 LIP ENHANCEMENT
11.3.1 JUVÉDERM
11.3.1.1 JUVÉDERM XC
11.3.1.2 VOLUMA
11.3.1.3 VOLBELLA
11.3.1.4 VOLLURE
11.3.2 RESTYLANE
11.3.2.1 RESTYLANE LYFT
11.3.2.2 RESTYLANE KYSSE
11.3.2.3 RESTYLANE CONTOUR
11.3.2.4 RESTYLANE REFYNE
11.3.2.5 RESTYLANE SILK
11.3.3 BELOTERO BALANCE
11.3.4 RHA
11.3.4.1 RHA 2
11.3.4.2 RHA 3
11.3.4.3 RHA 4
11.3.5 REVANESSE VERSA
11.3.6 HYLAFORM
11.3.7 ELEVESS
11.3.8 PREVELLE SILK
11.3.9 OTHERS
11.4 FACE LIFT
11.4.1 DEEP PLANE/SMAS FACELIFT
11.4.2 MINI FACELIFT
11.4.3 MID-FACELIFT
11.4.4 LIQUID FACELIFT
11.4.5 CHEEK LIFT
11.4.6 JAW LINE REJUVENATION
11.4.7 S-LIFT
11.4.8 CUTANEOUS LIFT
11.4.9 TEMPORAL/BROW LIFT
11.4.10 OTHERS
11.4.11 JUVEDERM
11.4.12 RESTYLANE
11.4.13 SCULPTRA
11.4.14 DYSPORT
11.4.15 OTHERS
11.5 RHINOPLASTY
11.5.1 JUVÉDERM
11.5.1.1 VOLUMA
11.5.1.2 VOLBELLA
11.5.1.3 JUVÉDERM XC
11.5.1.4 VOLLURE
11.5.2 RESTYLANE
11.5.2.1 RESTYLANE LYFT
11.5.2.2 RESTYLANE SILK
11.5.2.3 RESTYLANE REFYNE
11.5.2.4 RESTYLANE KYSSE
11.5.2.5 RESTYLANE CONTOUR
11.5.3 BELOTERO BALANCE
11.5.4 REVANESSE VERSA
11.5.5 RHA
11.5.5.1 RHA 2
11.5.5.2 RHA 3
11.5.5.3 RHA 4
11.5.6 HYLAFORM
11.5.7 ELEVESS
11.5.8 PREVELLE SILK
11.5.9 OTHERS
11.6 SCAR TREATMENT
11.6.1 ACNE SCARS
11.6.2 HYPERTROPHIC SCARS
11.6.3 KELOID SCARS
11.6.4 CONTRACTURE SCARS
11.6.5 OTHERS
11.6.6 JUVEDERM
11.6.7 RESTYLANE
11.6.8 RADIESSE
11.6.9 BELOTERO
11.6.10 PERLANE
11.6.11 OTHERS
11.7 SAGGING SKIN
11.7.1 BOLETERO
11.7.2 RESTYLANE
11.7.3 JUVEDERM
11.7.4 OTHERS
11.8 CHEEK DEPRESSION
11.8.1 JUVEDERM VOLUMA
11.8.2 RESTYLANE-LYFT
11.8.3 SCULPTRA
11.8.4 RADIESSE
11.8.5 OTHERS
11.9 RECONSTRUCTIVE SURGERY
11.9.1 JUVEDERM
11.9.2 RESTYLANE
11.9.3 OTHERS
11.1 AESTHETIC RESTORATION
11.10.1 JUVÉDERM
11.10.1.1 JUVEDERM ULTRA XC
11.10.1.2 JUVEDERM VOLBELLA XC
11.10.1.3 JUVEDERM VOLLURE XC
11.10.2 RESTYLANE
11.10.2.1 RESTYLANE LYFT
11.10.2.2 RESTYLANE-L
11.10.2.3 RESTYLANE REFYNE AND DEFYNE
11.10.2.4 RESTYLANE SILK
11.10.3 SCULPTRA
11.10.4 RADIESSE
11.10.5 RHA
11.10.5.1 RHA 2
11.10.5.2 RHA 3
11.10.5.3 RHA 4
11.10.6 REVANESSE VERSA
11.10.7 BELOTERO BALANCE
11.10.8 BELLAFILL
11.10.9 OTHERS
11.11 DENTISTRY
11.11.1 JUVEDERM
11.11.2 RESTYLANE
11.11.3 RADIESSE
11.11.4 OTHERS
11.12 CHIN AUGMENTATION
11.12.1 JUVEDERM VOLUMA XC
11.12.2 RESTYLANE DEFYNE
11.12.3 OTHERS
11.13 LIPOATROPHY TREATMENT
11.13.1 SCULPTRA
11.13.2 OTHERS
11.14 SKIN SMOOTHING
11.14.1 RESTYLANE
11.14.2 BELOTERO
11.14.3 BELLAFIL
11.14.4 OTHERS
11.15 EARLOBE REJUVENATION
11.15.1 SCULPTRA
11.15.2 RESTYLANE
11.15.3 ELLANSÉ
11.15.4 BELOTERO
11.15.5 JUVEDERM
11.15.6 OTHERS
11.16 OTHERS
12 NORTH AMERICA AESTHETIC INJECTABLE FILLERS MARKET, BY END USER
12.1 OVERVIEW
12.2 DERMATOLOGY CLINICS
12.3 HOSPITALS
12.4 AMBULATORY SURGICAL CENTERS
12.5 OTHERS
13 NORTH AMERICA AESTHETIC INJECTABLE FILLERS MARKET, BY DISTRIBUTION CHANNEL
13.1 OVERVIEW
13.2 DIRECT TENDER/DIRECT DISTRIBUTION
13.3 DRUG STORES
13.4 ONLINE PHARMACY
13.5 OTHERS
14 NORTH AMERICA AESTHETIC INJECTABLE FILLERS MARKET, BY REGION
14.1 NORTH AMERICA
14.1.1 U.S.
14.1.2 CANADA
15 NORTH AMERICA AESTHETIC INJECTABLE FILLERS MARKET: COMPANY LANDSCAPE
15.1 COMPANY SHARE ANALYSIS: GLOBAL
16 SWOT ANALYSIS
17 COMPANY PROFILE
17.1 ALLERGAN AESTHETICS
17.1.1 COMPANY SNAPSHOTS
17.1.2 REVENUE ANALYSIS AND SEGMENTED ANALYSIS
17.1.3 COMPANY SHARE ANALYSIS
17.1.4 PRODUCT PORTFOLIO
17.1.5 RECENT DEVELOPMENT
17.2 GALDERMA
17.2.1 COMPANY SNAPSHOT
17.2.2 REVENUE ANALYSIS
17.2.3 COMPANY SHARE ANALYSIS
17.2.4 PRODUCT PORTFOLIO
17.2.5 RECENT DEVELOPMENT
17.3 MERZ PHARMA
17.3.1 COMPANY SNAPSHOT
17.3.2 COMPANY SHARE ANALYSIS
17.3.3 PRODUCT PORTFOLIO
17.3.4 RECENT DEVELOPMENT
17.4 HUGEL, INC.
17.4.1 COMPANY SNAPSHOT
17.4.2 REVENUE ANALYSIS
17.4.3 COMPANY SHARE ANALYSIS
17.4.4 PRODUCT PORTFOLIO
17.4.5 RECENT DEVELOPMENT
17.5 LG CHEM
17.5.1 COMPANY SNAPSHOT
17.5.2 REVENUE ANALYSIS
17.5.3 COMPANY SHARE ANALYSIS
17.5.4 PRODUCT PORTFOLIO
17.5.5 RECENT DEVELOPMENT
17.6 AMALIAN
17.6.1 COMPANY SNAPSHOT
17.6.2 PRODUCT PORTFOLIO
17.6.3 RECENT DEVELOPMENT
17.7 BIOSCIENCE
17.7.1 COMPANY SNAPSHOT
17.7.2 PRODUCT PORTFOLIO
17.7.3 RECENT DEVELOPMENT
17.8 BIOPLUS CO. LTD.
17.8.1 COMPANY SNAPSHOT
17.8.2 PRODUCT PORTFOLIO
17.8.3 RECENT DEVELOPMENT
17.9 BIOXIS PHARMACEUTICALS
17.9.1 COMPANY SNAPSHOT
17.9.2 PRODUCT PORTFOLIO
17.9.3 RECENT DEVELOPMENT
17.1 CONTURA INTERNATIONAL LTD
17.10.1 COMPANY SNAPSHOT
17.10.2 PRODUCT PORTFOLIO
17.10.3 RECENT DEVELOPMENT
17.11 CROMA-PHARMA GMBH
17.11.1 COMPANY SNAPSHOT
17.11.2 PRODUCT PORTFOLIO
17.11.3 RECENT DEVELOPMENT
17.12 HUONS GLOBAL
17.12.1 COMPANY SNAPSHOT
17.12.2 REVENUE ANALYSIS
17.12.3 PRODUCT PORTFOLIO
17.12.4 RECENT DEVELOPMENT
17.13 HUMEDIX
17.13.1 COMPANY SNAPSHOT
17.13.2 REVENUE ANALYSIS
17.13.3 PRODUCT PORTFOLIO
17.13.4 RECENT DEVELOPMENT
17.14 IBSA INSTITUT BIOCHIMIQUE SA
17.14.1 COMPANY SNAPSHOT
17.14.2 PRODUCT PORTFOLIO
17.14.3 RECENT DEVELOPMENT
17.15 JALUPRO
17.15.1 COMPANY SNAPSHOT
17.15.2 PRODUCT PORTFOLIO
17.15.3 RECENT DEVELOPMENT
17.16 LABORATORIES VIVACY
17.16.1 COMPANY SNAPSHOT
17.16.2 PRODUCT PORTFOLIO
17.16.3 RECENT DEVELOPMENT
17.17 LABORATORIES FILLMED
17.17.1 COMPANY SNAPSHOT
17.17.2 PRODUCT PORTFOLIO
17.17.3 RECENT DEVELOPMENT
17.18 MEDYTOX INC
17.18.1 COMPANY SNAPSHOT
17.18.2 REVENUE ANALYSIS
17.18.3 PRODUCT PORTFOLIO
17.18.4 RECENT DEVELOPMENT
17.19 MESOESTETIC
17.19.1 COMPANY SNAPSHOT
17.19.2 PRODUCT PORTFOLIO
17.19.3 RECENT DEVELOPMENT
17.2 PETRONE GROUP
17.20.1 COMPANY SNAPSHOT
17.20.2 PRODUCT PORTFOLIO
17.20.3 RECENT DEVELOPMENT
17.21 PREMIER MEDICAL GROUP
17.21.1 COMPANY SNAPSHOT
17.21.2 PRODUCT PORTFOLIO
17.21.3 RECENT DEVELOPMENT
17.22 PROLLENIUM MEDICAL TECHNOLOGIES
17.22.1 COMPANY SNAPSHOT
17.22.2 PRODUCT PORTFOLIO
17.22.3 RECENT DEVELOPMENT
17.23 REVANCE
17.23.1 COMPANY SNAPSHOT
17.23.2 PRODUCT PORTFOLIO
17.23.3 RECENT DEVELOPMENT
17.24 SINCLAIR
17.24.1 COMPANY SNAPSHOT
17.24.2 PRODUCT PORTFOLIO
17.24.3 RECENT DEVELOPMENT
17.25 SHANGHAI REYOUNGEL MEDICAL TECHNOLOGY COMPANY LIMITED
17.25.1 COMPANY SNAPSHOT
17.25.2 PRODUCT PORTFOLIO
17.25.3 RECENT DEVELOPMENT
17.26 SOSUM GLOBAL
17.26.1 COMPANY SNAPSHOT
17.26.2 PRODUCT PORTFOLIO
17.26.3 RECENT DEVELOPMENT
17.27 TIGER AESTHETICS MEDICAL, LLC
17.27.1 COMPANY SNAPSHOT
17.27.2 PRODUCT PORTFOLIO
17.27.3 RECENT DEVELOPMENT
17.28 TEOXANE
17.28.1 COMPANY SNAPSHOT
17.28.2 PRODUCT PORTFOLIO
17.28.3 RECENT DEVELOPMENT
17.29 VIDA SRL.
17.29.1 COMPANY SNAPSHOT
17.29.2 PRODUCT PORTFOLIO
17.29.3 RECENT DEVELOPMENT
17.3 ZHEJIANG JINGJIA MEDICAL TECHNOLOGY CO., LTD.
17.30.1 COMPANY SNAPSHOT
17.30.2 PRODUCT PORTFOLIO
17.30.3 RECENT DEVELOPMENT
18 QUESTIONNAIRE
19 RELATED REPORTS
List of Table
TABLE 1 NORTH AMERICA AESTHETIC INJECTABLE FILLERS MARKET, BY TYPE, 2018-2036 (USD THOUSAND)
TABLE 2 NORTH AMERICA AESTHETIC INJECTABLE FILLERS MARKET, BY TYPE, 2018-2036 (VOLUME IN THOUSAND UNITS)
TABLE 3 NORTH AMERICA AESTHETIC INJECTABLE FILLERS MARKET, BY TYPE, 2018-2036 (ASP IN USD/UNITS)
TABLE 4 NORTH AMERICA BIODEGRADABLE AESTHETIC INJECTABLE FILLERS IN AESTHETIC INJECTABLE FILLERS MARKET, BY REGION, 2018-2036 (USD THOUSAND)
TABLE 5 NORTH AMERICA BIODEGRADABLE AESTHETIC INJECTABLE FILLERS IN AESTHETIC INJECTABLE FILLERS MARKET, BY TYPE, 2018-2036 (USD THOUSAND)
TABLE 6 NORTH AMERICA BIODEGRADABLE AESTHETIC INJECTABLE FILLERS IN AESTHETIC INJECTABLE FILLERS MARKET, BY TYPE, 2018-2036 (VOLUME IN THOUSAND UNITS)
TABLE 7 NORTH AMERICA BIODEGRADABLE AESTHETIC INJECTABLE FILLERS IN AESTHETIC INJECTABLE FILLERS MARKET, BY TYPE, 2018-2036 (ASP IN USD/UNITS)
TABLE 8 NORTH AMERICA NON-BIODEGRADABLE AESTHETIC INJECTABLE FILLERS IN AESTHETIC INJECTABLE FILLERS MARKET, BY REGION, 2018-2036 (USD THOUSAND)
TABLE 9 NORTH AMERICA AESTHETIC INJECTABLE FILLERS MARKET, BY PRODUCT TYPE, 2018-2036 (USD THOUSAND)
TABLE 10 NORTH AMERICA AESTHETIC INJECTABLE FILLERS MARKET, BY PRODUCT TYPE, 2018-2036 (VOLUME IN THOUSAND UNITS)
TABLE 11 NORTH AMERICA AESTHETIC INJECTABLE FILLERS MARKET, BY PRODUCT TYPE, 2018-2036 (ASP IN USD/UNITS)
TABLE 12 NORTH AMERICA NATURAL AESTHETIC INJECTABLE FILLERS IN AESTHETIC INJECTABLE FILLERS MARKET, BY REGION, 2018-2036 (USD THOUSAND)
TABLE 13 NORTH AMERICA NATURAL AESTHETIC INJECTABLE FILLERS IN AESTHETIC INJECTABLE FILLERS MARKET, BY TYPE, 2018-2036 (USD THOUSAND)
TABLE 14 NORTH AMERICA HYALURONIC ACID (HA) IN AESTHETIC INJECTABLE FILLERS MARKET, BY TYPE, 2018-2036 (USD THOUSAND)
TABLE 15 NORTH AMERICA MONOPHASIC FILLERS IN AESTHETIC INJECTABLE FILLERS MARKET, BY TYPE, 2018-2036 (USD THOUSAND)
TABLE 16 NORTH AMERICA MONOPHASIC FILLERS IN AESTHETIC INJECTABLE FILLERS MARKET, BY APPLICATION, 2018-2036 (USD THOUSAND)
TABLE 17 NORTH AMERICA BIPHASIC FILLERS IN AESTHETIC INJECTABLE FILLERS MARKET, BY MATERIAL TYPE, 2018-2036 (USD THOUSAND)
TABLE 18 NORTH AMERICA BIPHASIC FILLERS IN AESTHETIC INJECTABLE FILLERS MARKET, BY APPLICATION, 2018-2036 (USD THOUSAND)
TABLE 19 NORTH AMERICA FAT IN AESTHETIC INJECTABLE FILLERS MARKET, BY APPLICATION, 2018-2036 (USD THOUSAND)
TABLE 20 NORTH AMERICA COLLAGEN IN AESTHETIC INJECTABLE FILLERS MARKET, BY APPLICATION, 2018-2036 (USD THOUSAND)
TABLE 21 NORTH AMERICA POLYNUCLEOTIDES / POLYDEOXYRIBONUCLEOTIDES (PN/PDRN) IN AESTHETIC INJECTABLE FILLERS MARKET, BY APPLICATION, 2018-2036 (USD THOUSAND)
TABLE 22 NORTH AMERICA OTHERS IN AESTHETIC INJECTABLE FILLERS MARKET, BY APPLICATION, 2018-2036 (USD THOUSAND)
TABLE 23 NORTH AMERICA SYNTHETIC AESTHETIC INJECTABLE FILLERS IN AESTHETIC INJECTABLE FILLERS MARKET, BY REGION, 2018-2036 (USD THOUSAND)
TABLE 24 NORTH AMERICA SYNTHETIC AESTHETIC INJECTABLE FILLERS IN AESTHETIC INJECTABLE FILLERS MARKET, BY TYPE, 2018-2036 (USD THOUSAND)
TABLE 25 NORTH AMERICA CALCIUM HYDROXYLAPATITE (CAHA) IN AESTHETIC INJECTABLE FILLERS MARKET, BY APPLICATION, 2018-2036 (USD THOUSAND)
TABLE 26 NORTH AMERICA POLY-L-LACTIC ACID (PLLA) IN AESTHETIC INJECTABLE FILLERS MARKET, BY APPLICATION, 2018-2036 (USD THOUSAND)
TABLE 27 NORTH AMERICA POLYMETHYL-METHACRYLATE MICROSPHERES (PMMA) IN AESTHETIC INJECTABLE FILLERS MARKET, BY APPLICATION, 2018-2036 (USD THOUSAND)
TABLE 28 NORTH AMERICA AESTHETIC INJECTABLE FILLERS MARKET, BY DRUG TYPE, 2018-2036 (USD THOUSAND)
TABLE 29 NORTH AMERICA BRANDED IN AESTHETIC INJECTABLE FILLERS MARKET, BY REGION, 2018-2036 (USD THOUSAND)
TABLE 30 NORTH AMERICA BRANDED IN AESTHETIC INJECTABLE FILLERS MARKET, BY TYPE, 2018-2036 (USD THOUSAND)
TABLE 31 NORTH AMERICA GENERIC IN AESTHETIC INJECTABLE FILLERS MARKET, BY REGION, 2018-2036 (USD THOUSAND)
TABLE 32 NORTH AMERICA AESTHETIC INJECTABLE FILLERS MARKET, BY APPLICATION, 2018-2036 (USD THOUSAND)
TABLE 33 NORTH AMERICA FACIAL LINE CORRECTION IN AESTHETIC INJECTABLE FILLERS MARKET, BY REGION, 2018-2036 (USD THOUSAND)
TABLE 34 NORTH AMERICA FACIAL LINE CORRECTION IN AESTHETIC INJECTABLE FILLERS MARKET, BY TYPE, 2018-2036 (USD THOUSAND)
TABLE 35 NORTH AMERICA FACIAL LINE CORRECTION IN AESTHETIC INJECTABLE FILLERS MARKET, BY LOCATION, 2018-2036 (USD THOUSAND)
TABLE 36 NORTH AMERICA FACIAL LINE CORRECTION IN AESTHETIC INJECTABLE FILLERS MARKET, BY BRAND, 2018-2036 (USD THOUSAND)
TABLE 37 NORTH AMERICA LIP ENHANCEMENT IN AESTHETIC INJECTABLE FILLERS MARKET, BY REGION, 2018-2036 (USD THOUSAND)
TABLE 38 NORTH AMERICA LIP ENHANCEMENT IN AESTHETIC INJECTABLE FILLERS MARKET, BY TYPE, 2018-2036 (USD THOUSAND)
TABLE 39 NORTH AMERICA JUVÉDERM IN AESTHETIC INJECTABLE FILLERS MARKET, BY TYPE, 2018-2036 (USD THOUSAND)
TABLE 40 NORTH AMERICA RESTYLANE IN AESTHETIC INJECTABLE FILLERS MARKET, BY TYPE, 2018-2036 (USD THOUSAND)
TABLE 41 NORTH AMERICA RHA IN AESTHETIC INJECTABLE FILLERS MARKET, BY TYPE, 2018-2036 (USD THOUSAND)
TABLE 42 NORTH AMERICA FACE LIFT IN AESTHETIC INJECTABLE FILLERS MARKET, BY REGION, 2018-2036 (USD THOUSAND)
TABLE 43 NORTH AMERICA FACE LIFT IN AESTHETIC INJECTABLE FILLERS MARKET, BY TYPE, 2018-2036 (USD THOUSAND)
TABLE 44 NORTH AMERICA FACE LIFT IN AESTHETIC INJECTABLE FILLERS MARKET, BY BRAND, 2018-2036 (USD THOUSAND)
TABLE 45 NORTH AMERICA RHINOPLASTY IN AESTHETIC INJECTABLE FILLERS MARKET, BY REGION, 2018-2036 (USD THOUSAND)
TABLE 46 NORTH AMERICA RHINOPLASTY IN AESTHETIC INJECTABLE FILLERS MARKET, BY TYPE, 2018-2036 (USD THOUSAND)
TABLE 47 NORTH AMERICA JUVÉDERM IN AESTHETIC INJECTABLE FILLERS MARKET, BY TYPE, 2018-2036 (USD THOUSAND)
TABLE 48 NORTH AMERICA RESTYLANE IN AESTHETIC INJECTABLE FILLERS MARKET, BY TYPE, 2018-2036 (USD THOUSAND)
TABLE 49 NORTH AMERICA RHA IN AESTHETIC INJECTABLE FILLERS MARKET, BY TYPE, 2018-2036 (USD THOUSAND)
TABLE 50 NORTH AMERICA SCAR TREATMENT IN AESTHETIC INJECTABLE FILLERS MARKET, BY REGION, 2018-2036 (USD THOUSAND)
TABLE 51 NORTH AMERICA SCAR TREATMENT IN AESTHETIC INJECTABLE FILLERS MARKET, BY TYPE, 2018-2036 (USD THOUSAND)
TABLE 52 NORTH AMERICA SCAR TREATMENT IN AESTHETIC INJECTABLE FILLERS MARKET, BY BRAND, 2018-2036 (USD THOUSAND)
TABLE 53 NORTH AMERICA SAGGING SKIN IN AESTHETIC INJECTABLE FILLERS MARKET, BY REGION, 2018-2036 (USD THOUSAND)
TABLE 54 NORTH AMERICA SAGGING SKIN IN AESTHETIC INJECTABLE FILLERS MARKET, BY TYPE, 2018-2036 (USD THOUSAND)
TABLE 55 NORTH AMERICA CHEEK DEPRESSION IN AESTHETIC INJECTABLE FILLERS MARKET, BY REGION, 2018-2036 (USD THOUSAND)
TABLE 56 NORTH AMERICA CHEEK DEPRESSION IN AESTHETIC INJECTABLE FILLERS MARKET, BY TYPE, 2018-2036 (USD THOUSAND)
TABLE 57 NORTH AMERICA RECONSTRUCTIVE SURGERY IN AESTHETIC INJECTABLE FILLERS MARKET, BY REGION, 2018-2036 (USD THOUSAND)
TABLE 58 NORTH AMERICA RECONSTRUCTIVE SURGERY IN AESTHETIC INJECTABLE FILLERS MARKET, BY TYPE, 2018-2036 (USD THOUSAND)
TABLE 59 NORTH AMERICA AESTHETIC RESTORATION IN AESTHETIC INJECTABLE FILLERS MARKET, BY REGION, 2018-2036 (USD THOUSAND)
TABLE 60 GNORTH AMERICA AESTHETIC RESTORATION IN AESTHETIC INJECTABLE FILLERS MARKET, BY TYPE, 2018-2036 (USD THOUSAND)
TABLE 61 NORTH AMERICA JUVÉDERM IN AESTHETIC INJECTABLE FILLERS MARKET, BY TYPE, 2018-2036 (USD THOUSAND)
TABLE 62 NORTH AMERICA RESTYLANE IN AESTHETIC INJECTABLE FILLERS MARKET, BY TYPE, 2018-2036 (USD THOUSAND)
TABLE 63 NORTH AMERICA RHA IN AESTHETIC INJECTABLE FILLERS MARKET, BY TYPE, 2018-2036 (USD THOUSAND)
TABLE 64 NORTH AMERICA DENTISTRY IN AESTHETIC INJECTABLE FILLERS MARKET, BY REGION, 2018-2036 (USD THOUSAND)
TABLE 65 NORTH AMERICA DENTISTRY IN AESTHETIC INJECTABLE FILLERS MARKET, BY TYPE, 2018-2036 (USD THOUSAND)
TABLE 66 NORTH AMERICA CHIN AUGMENTATION IN AESTHETIC INJECTABLE FILLERS MARKET, BY REGION, 2018-2036 (USD THOUSAND)
TABLE 67 NORTH AMERICA CHIN AUGMENTATION IN AESTHETIC INJECTABLE FILLERS MARKET, BY TYPE, 2018-2036 (USD THOUSAND)
TABLE 68 NORTH AMERICA LIPOATROPHY TREATMENT IN AESTHETIC INJECTABLE FILLERS MARKET, BY REGION, 2018-2036 (USD THOUSAND)
TABLE 69 NORTH AMERICA LIPOATROPHY TREATMENT IN AESTHETIC INJECTABLE FILLERS MARKET, BY TYPE, 2018-2036 (USD THOUSAND)
TABLE 70 NORTH AMERICA SKIN SMOOTHING IN AESTHETIC INJECTABLE FILLERS MARKET, BY REGION, 2018-2036 (USD THOUSAND)
TABLE 71 NORTH AMERICA SKIN SMOOTHENING IN AESTHETIC INJECTABLE FILLERS MARKET, BY TYPE, 2018-2036 (USD THOUSAND)
TABLE 72 NORTH AMERICA EARLOBE REJUVENATION IN AESTHETIC INJECTABLE FILLERS MARKET, BY REGION, 2018-2036 (USD THOUSAND)
TABLE 73 NORTH AMERICA EARLOBE REJUVENATION IN AESTHETIC INJECTABLE FILLERS MARKET, BY TYPE, 2018-2036 (USD THOUSAND)
TABLE 74 NORTH AMERICA OTHERS IN AESTHETIC INJECTABLE FILLERS MARKET, BY REGION, 2018-2036 (USD THOUSAND)
TABLE 75 NORTH AMERICA AESTHETIC INJECTABLE FILLERS MARKET, BY END USER, 2018-2036 (USD THOUSAND)
TABLE 76 NORTH AMERICA DERMATOLOGY CLINICS IN AESTHETIC INJECTABLE FILLERS MARKET, BY REGION, 2018-2036 (USD THOUSAND)
TABLE 77 NORTH AMERICA HOSPITALS IN AESTHETIC INJECTABLE FILLERS MARKET, BY REGION, 2018-2036 (USD THOUSAND)
TABLE 78 NORTH AMERICA AMBULATORY SURGICAL CENTERS IN AESTHETIC INJECTABLE FILLERS MARKET, BY REGION, 2018-2036 (USD THOUSAND)
TABLE 79 NORTH AMERICA OTHERS IN AESTHETIC INJECTABLE FILLERS MARKET, BY REGION, 2018-2036 (USD THOUSAND)
TABLE 80 NORTH AMERICA AESTHETIC INJECTABLE FILLERS MARKET, BY DISTRIBUTION CHANNEL, 2018-2036 (USD THOUSAND)
TABLE 81 NORTH AMERICA DIRECT TENDER/DIRECT DISTRIBUTION IN AESTHETIC INJECTABLE FILLERS MARKET, BY REGION, 2018-2036 (USD THOUSAND)
TABLE 82 NORTH AMERICA DRUG STORES IN AESTHETIC INJECTABLE FILLERS MARKET, BY REGION, 2018-2036 (USD THOUSAND)
TABLE 83 NORTH AMERICA ONLINE PHARMACY IN AESTHETIC INJECTABLE FILLERS MARKET, BY REGION, 2018-2036 (USD THOUSAND)
TABLE 84 NORTH AMERICA OTHERS IN AESTHETIC INJECTABLE FILLERS MARKET, BY REGION, 2018-2036 (USD THOUSAND)
TABLE 85 NORTH AMERICA AESTHETIC INJECTABLE FILLERS MARKET, BY COUNTRY, 2018-2036 (USD THOUSAND)
TABLE 86 NORTH AMERICA AESTHETIC INJECTABLE FILLERS MARKET, BY PRODUCT TYPE, 2018-2036 (USD THOUSAND)
TABLE 87 NORTH AMERICA AESTHETIC INJECTABLE FILLERS MARKET, BY PRODUCT TYPE, 2018-2036 (VOLUME IN THOUSAND UNITS)
TABLE 88 NORTH AMERICA AESTHETIC INJECTABLE FILLERS MARKET, BY PRODUCT TYPE, 2018-2036 (ASP IN USD/UNITS)
TABLE 89 NORTH AMERICA NATURAL AESTHETIC INJECTABLE FILLERS IN AESTHETIC INJECTABLE FILLERS MARKET, BY TYPE, 2018-2036 (USD THOUSAND)
TABLE 90 NORTH AMERICA HYALURONIC ACID (HA) IN AESTHETIC INJECTABLE FILLERS MARKET, BY TYPE, 2018-2036 (USD THOUSAND)
TABLE 91 NORTH AMERICA MONOPHASIC FILLERS IN AESTHETIC INJECTABLE FILLERS MARKET, BY TYPE, 2018-2036 (USD THOUSAND)
TABLE 92 NORTH AMERICA MONOPHASIC FILLERS IN AESTHETIC INJECTABLE FILLERS MARKET, BY APPLICATION, 2018-2036 (USD THOUSAND)
TABLE 93 NORTH AMERICA BIPHASIC FILLERS IN AESTHETIC INJECTABLE FILLERS MARKET, BY MATERIAL TYPE, 2018-2036 (USD THOUSAND)
TABLE 94 NORTH AMERICA BIPHASIC FILLERS IN AESTHETIC INJECTABLE FILLERS MARKET, BY APPLICATION, 2018-2036 (USD THOUSAND)
TABLE 95 NORTH AMERICA FAT IN AESTHETIC INJECTABLE FILLERS MARKET, BY APPLICATION, 2018-2036 (USD THOUSAND)
TABLE 96 NORTH AMERICA COLLAGEN IN AESTHETIC INJECTABLE FILLERS MARKET, BY APPLICATION, 2018-2036 (USD THOUSAND)
TABLE 97 NORTH AMERICA POLYNUCLEOTIDES / POLYDEOXYRIBONUCLEOTIDES (PN/PDRN) IN AESTHETIC INJECTABLE FILLERS MARKET, BY APPLICATION, 2018-2036 (USD THOUSAND)
TABLE 98 NORTH AMERICA OTHERS IN AESTHETIC INJECTABLE FILLERS MARKET, BY APPLICATION, 2018-2036 (USD THOUSAND)
TABLE 99 NORTH AMERICA SYNTHETIC AESTHETIC INJECTABLE FILLERS IN AESTHETIC INJECTABLE FILLERS MARKET, BY TYPE, 2018-2036 (USD THOUSAND)
TABLE 100 NORTH AMERICA CALCIUM HYDROXYLAPATITE (CAHA) IN AESTHETIC INJECTABLE FILLERS MARKET, BY APPLICATION, 2018-2036 (USD THOUSAND)
TABLE 101 NORTH AMERICA POLY-L-LACTIC ACID (PLLA) IN AESTHETIC INJECTABLE FILLERS MARKET, BY APPLICATION, 2018-2036 (USD THOUSAND)
TABLE 102 NORTH AMERICA POLYMETHYL-METHACRYLATE MICROSPHERES (PMMA) IN AESTHETIC INJECTABLE FILLERS MARKET, BY APPLICATION, 2018-2036 (USD THOUSAND)
TABLE 103 NORTH AMERICA AESTHETIC INJECTABLE FILLERS MARKET, BY TYPE, 2018-2036 (USD THOUSAND)
TABLE 104 NORTH AMERICA AESTHETIC INJECTABLE FILLERS MARKET, BY TYPE, 2018-2036 (VOLUME IN THOUSAND UNITS)
TABLE 105 NORTH AMERICA AESTHETIC INJECTABLE FILLERS MARKET, BY TYPE, 2018-2036 (ASP IN USD/UNITS)
TABLE 106 NORTH AMERICA BIODEGRADABLE AESTHETIC INJECTABLE FILLERS IN AESTHETIC INJECTABLE FILLERS MARKET, BY TYPE, 2018-2036 (USD THOUSAND)
TABLE 107 NORTH AMERICA BIODEGRADABLE AESTHETIC INJECTABLE FILLERS IN AESTHETIC INJECTABLE FILLERS MARKET, BY TYPE, 2018-2036 (VOLUME IN THOUSAND UNITS)
TABLE 108 NORTH AMERICA BIODEGRADABLE AESTHETIC INJECTABLE FILLERS IN AESTHETIC INJECTABLE FILLERS MARKET, BY TYPE, 2018-2036 (ASP IN USD/UNITS)
TABLE 109 NORTH AMERICA AESTHETIC INJECTABLE FILLERS MARKET, BY APPLICATION, 2018-2036 (USD THOUSAND)
TABLE 110 NORTH AMERICA FACIAL LINE CORRECTION IN AESTHETIC INJECTABLE FILLERS MARKET, BY TYPE, 2018-2036 (USD THOUSAND)
TABLE 111 NORTH AMERICA FACIAL LINE CORRECTION IN AESTHETIC INJECTABLE FILLERS MARKET, BY LOCATION, 2018-2036 (USD THOUSAND)
TABLE 112 NORTH AMERICA FACIAL LINE CORRECTION IN AESTHETIC INJECTABLE FILLERS MARKET, BY BRAND, 2018-2036 (USD THOUSAND)
TABLE 113 NORTH AMERICA LIP ENHANCEMENT IN AESTHETIC INJECTABLE FILLERS MARKET, BY TYPE, 2018-2036 (USD THOUSAND)
TABLE 114 NORTH AMERICA JUVÉDERM IN AESTHETIC INJECTABLE FILLERS MARKET, BY TYPE, 2018-2036 (USD THOUSAND)
TABLE 115 NORTH AMERICA RESTYLANE IN AESTHETIC INJECTABLE FILLERS MARKET, BY TYPE, 2018-2036 (USD THOUSAND)
TABLE 116 NORTH AMERICA RHA IN AESTHETIC INJECTABLE FILLERS MARKET, BY TYPE, 2018-2036 (USD THOUSAND)
TABLE 117 NORTH AMERICA FACE LIFT IN AESTHETIC INJECTABLE FILLERS MARKET, BY TYPE, 2018-2036 (USD THOUSAND)
TABLE 118 NORTH AMERICA FACE LIFT IN AESTHETIC INJECTABLE FILLERS MARKET, BY BRAND, 2018-2036 (USD THOUSAND)
TABLE 119 NORTH AMERICA RHINOPLASTY IN AESTHETIC INJECTABLE FILLERS MARKET, BY TYPE, 2018-2036 (USD THOUSAND)
TABLE 120 NORTH AMERICA JUVÉDERM IN AESTHETIC INJECTABLE FILLERS MARKET, BY TYPE, 2018-2036 (USD THOUSAND)
TABLE 121 NORTH AMERICA RESTYLANE IN AESTHETIC INJECTABLE FILLERS MARKET, BY TYPE, 2018-2036 (USD THOUSAND)
TABLE 122 NORTH AMERICA RHA IN AESTHETIC INJECTABLE FILLERS MARKET, BY TYPE, 2018-2036 (USD THOUSAND)
TABLE 123 NORTH AMERICA SCAR TREATMENT IN AESTHETIC INJECTABLE FILLERS MARKET, BY TYPE, 2018-2036 (USD THOUSAND)
TABLE 124 NORTH AMERICA SCAR TREATMENT IN AESTHETIC INJECTABLE FILLERS MARKET, BY BRAND, 2018-2036 (USD THOUSAND)
TABLE 125 NORTH AMERICA SAGGING SKIN IN AESTHETIC INJECTABLE FILLERS MARKET, BY TYPE, 2018-2036 (USD THOUSAND)
TABLE 126 NORTH AMERICA CHEEK DEPRESSION IN AESTHETIC INJECTABLE FILLERS MARKET, BY TYPE, 2018-2036 (USD THOUSAND)
TABLE 127 NORTH AMERICA RECONSTRUCTIVE SURGERY IN AESTHETIC INJECTABLE FILLERS MARKET, BY TYPE, 2018-2036 (USD THOUSAND)
TABLE 128 NORTH AMERICA AESTHETIC RESTORATION IN AESTHETIC INJECTABLE FILLERS MARKET, BY TYPE, 2018-2036 (USD THOUSAND)
TABLE 129 NORTH AMERICA JUVÉDERM IN AESTHETIC INJECTABLE FILLERS MARKET, BY TYPE, 2018-2036 (USD THOUSAND)
TABLE 130 NORTH AMERICA RESTYLANE IN AESTHETIC INJECTABLE FILLERS MARKET, BY TYPE, 2018-2036 (USD THOUSAND)
TABLE 131 NORTH AMERICA RHA IN AESTHETIC INJECTABLE FILLERS MARKET, BY TYPE, 2018-2036 (USD THOUSAND)
TABLE 132 NORTH AMERICA DENTISTRY IN AESTHETIC INJECTABLE FILLERS MARKET, BY TYPE, 2018-2036 (USD THOUSAND)
TABLE 133 NORTH AMERICA CHIN AUGMENTATION IN AESTHETIC INJECTABLE FILLERS MARKET, BY TYPE, 2018-2036 (USD THOUSAND)
TABLE 134 NORTH AMERICA LIPOATROPHY TREATMENT IN AESTHETIC INJECTABLE FILLERS MARKET, BY TYPE, 2018-2036 (USD THOUSAND)
TABLE 135 NORTH AMERICA SKIN SMOOTHENING IN AESTHETIC INJECTABLE FILLERS MARKET, BY TYPE, 2018-2036 (USD THOUSAND)
TABLE 136 NORTH AMERICA EARLOBE REJUVENATION IN AESTHETIC INJECTABLE FILLERS MARKET, BY TYPE, 2018-2036 (USD THOUSAND)
TABLE 137 NORTH AMERICA AESTHETIC INJECTABLE FILLERS MARKET, BY DRUG TYPE, 2018-2036 (USD THOUSAND)
TABLE 138 NORTH AMERICA BRANDED IN AESTHETIC INJECTABLE FILLERS MARKET, BY TYPE, 2018-2036 (USD THOUSAND)
TABLE 139 NORTH AMERICA AESTHETIC INJECTABLE FILLERS MARKET, BY END USER, 2018-2036 (USD THOUSAND)
TABLE 140 NORTH AMERICA AESTHETIC INJECTABLE FILLERS MARKET, BY DISTRIBUTION CHANNEL, 2018-2036 (USD THOUSAND)
TABLE 141 U.S. AESTHETIC INJECTABLE FILLERS MARKET, BY PRODUCT TYPE, 2018-2036 (USD THOUSAND)
TABLE 142 U.S. AESTHETIC INJECTABLE FILLERS MARKET, BY PRODUCT TYPE, 2018-2036 (VOLUME IN THOUSAND UNITS)
TABLE 143 U.S. AESTHETIC INJECTABLE FILLERS MARKET, BY PRODUCT TYPE, 2018-2036 (ASP IN USD/UNITS)
TABLE 144 U.S. NATURAL AESTHETIC INJECTABLE FILLERS IN AESTHETIC INJECTABLE FILLERS MARKET, BY TYPE, 2018-2036 (USD THOUSAND)
TABLE 145 U.S. HYALURONIC ACID (HA) IN AESTHETIC INJECTABLE FILLERS MARKET, BY TYPE, 2018-2036 (USD THOUSAND)
TABLE 146 U.S. MONOPHASIC FILLERS IN AESTHETIC INJECTABLE FILLERS MARKET, BY TYPE, 2018-2036 (USD THOUSAND)
TABLE 147 U.S. MONOPHASIC FILLERS IN AESTHETIC INJECTABLE FILLERS MARKET, BY APPLICATION, 2018-2036 (USD THOUSAND)
TABLE 148 U.S. BIPHASIC FILLERS IN AESTHETIC INJECTABLE FILLERS MARKET, BY MATERIAL TYPE, 2018-2036 (USD THOUSAND)
TABLE 149 U.S. BIPHASIC FILLERS IN AESTHETIC INJECTABLE FILLERS MARKET, BY APPLICATION, 2018-2036 (USD THOUSAND)
TABLE 150 U.S. FAT IN AESTHETIC INJECTABLE FILLERS MARKET, BY APPLICATION, 2018-2036 (USD THOUSAND)
TABLE 151 U.S. COLLAGEN IN AESTHETIC INJECTABLE FILLERS MARKET, BY APPLICATION, 2018-2036 (USD THOUSAND)
TABLE 152 U.S. POLYNUCLEOTIDES / POLYDEOXYRIBONUCLEOTIDES (PN/PDRN) IN AESTHETIC INJECTABLE FILLERS MARKET, BY APPLICATION, 2018-2036 (USD THOUSAND)
TABLE 153 U.S. OTHERS IN AESTHETIC INJECTABLE FILLERS MARKET, BY APPLICATION, 2018-2036 (USD THOUSAND)
TABLE 154 U.S. SYNTHETIC AESTHETIC INJECTABLE FILLERS IN AESTHETIC INJECTABLE FILLERS MARKET, BY TYPE, 2018-2036 (USD THOUSAND)
TABLE 155 U.S. CALCIUM HYDROXYLAPATITE (CAHA) IN AESTHETIC INJECTABLE FILLERS MARKET, BY APPLICATION, 2018-2036 (USD THOUSAND)
TABLE 156 U.S. POLY-L-LACTIC ACID (PLLA) IN AESTHETIC INJECTABLE FILLERS MARKET, BY APPLICATION, 2018-2036 (USD THOUSAND)
TABLE 157 U.S. POLYMETHYL-METHACRYLATE MICROSPHERES (PMMA) IN AESTHETIC INJECTABLE FILLERS MARKET, BY APPLICATION, 2018-2036 (USD THOUSAND)
TABLE 158 U.S. AESTHETIC INJECTABLE FILLERS MARKET, BY TYPE, 2018-2036 (USD THOUSAND)
TABLE 159 U.S. AESTHETIC INJECTABLE FILLERS MARKET, BY TYPE, 2018-2036 (VOLUME IN THOUSAND UNITS)
TABLE 160 U.S. AESTHETIC INJECTABLE FILLERS MARKET, BY TYPE, 2018-2036 (ASP IN USD/UNITS)
TABLE 161 U.S. BIODEGRADABLE AESTHETIC INJECTABLE FILLERS IN AESTHETIC INJECTABLE FILLERS MARKET, BY TYPE, 2018-2036 (USD THOUSAND)
TABLE 162 U.S. BIODEGRADABLE AESTHETIC INJECTABLE FILLERS IN AESTHETIC INJECTABLE FILLERS MARKET, BY TYPE, 2018-2036 (ASP IN USD/UNITS)
TABLE 163 U.S. AESTHETIC INJECTABLE FILLERS MARKET, BY APPLICATION, 2018-2036 (USD THOUSAND)
TABLE 164 U.S. FACIAL LINE CORRECTION IN AESTHETIC INJECTABLE FILLERS MARKET, BY TYPE, 2018-2036 (USD THOUSAND)
TABLE 165 U.S. FACIAL LINE CORRECTION IN AESTHETIC INJECTABLE FILLERS MARKET, BY LOCATION, 2018-2036 (USD THOUSAND)
TABLE 166 U.S. FACIAL LINE CORRECTION IN AESTHETIC INJECTABLE FILLERS MARKET, BY BRAND, 2018-2036 (USD THOUSAND)
TABLE 167 U.S. LIP ENHANCEMENT IN AESTHETIC INJECTABLE FILLERS MARKET, BY TYPE, 2018-2036 (USD THOUSAND)
TABLE 168 U.S. JUVÉDERM IN AESTHETIC INJECTABLE FILLERS MARKET, BY TYPE, 2018-2036 (USD THOUSAND)
TABLE 169 U.S. RESTYLANE IN AESTHETIC INJECTABLE FILLERS MARKET, BY TYPE, 2018-2036 (USD THOUSAND)
TABLE 170 U.S. RHA IN AESTHETIC INJECTABLE FILLERS MARKET, BY TYPE, 2018-2036 (USD THOUSAND)
TABLE 171 U.S. FACE LIFT IN AESTHETIC INJECTABLE FILLERS MARKET, BY TYPE, 2018-2036 (USD THOUSAND)
TABLE 172 U.S. FACE LIFT IN AESTHETIC INJECTABLE FILLERS MARKET, BY BRAND, 2018-2036 (USD THOUSAND)
TABLE 173 U.S. RHINOPLASTY IN AESTHETIC INJECTABLE FILLERS MARKET, BY TYPE, 2018-2036 (USD THOUSAND)
TABLE 174 U.S. JUVÉDERM IN AESTHETIC INJECTABLE FILLERS MARKET, BY TYPE, 2018-2036 (USD THOUSAND)
TABLE 175 U.S. RESTYLANE IN AESTHETIC INJECTABLE FILLERS MARKET, BY TYPE, 2018-2036 (USD THOUSAND)
TABLE 176 U.S. RHA IN AESTHETIC INJECTABLE FILLERS MARKET, BY TYPE, 2018-2036 (USD THOUSAND)
TABLE 177 U.S. SCAR TREATMENT IN AESTHETIC INJECTABLE FILLERS MARKET, BY TYPE, 2018-2036 (USD THOUSAND)
TABLE 178 U.S. SCAR TREATMENT IN AESTHETIC INJECTABLE FILLERS MARKET, BY BRAND, 2018-2036 (USD THOUSAND)
TABLE 179 U.S. SAGGING SKIN IN AESTHETIC INJECTABLE FILLERS MARKET, BY TYPE, 2018-2036 (USD THOUSAND)
TABLE 180 U.S. CHEEK DEPRESSION IN AESTHETIC INJECTABLE FILLERS MARKET, BY TYPE, 2018-2036 (USD THOUSAND)
TABLE 181 U.S. RECONSTRUCTIVE SURGERY IN AESTHETIC INJECTABLE FILLERS MARKET, BY TYPE, 2018-2036 (USD THOUSAND)
TABLE 182 U.S. AESTHETIC RESTORATION IN AESTHETIC INJECTABLE FILLERS MARKET, BY TYPE, 2018-2036 (USD THOUSAND)
TABLE 183 U.S. JUVÉDERM IN AESTHETIC INJECTABLE FILLERS MARKET, BY TYPE, 2018-2036 (USD THOUSAND)
TABLE 184 U.S. RESTYLANE IN AESTHETIC INJECTABLE FILLERS MARKET, BY TYPE, 2018-2036 (USD THOUSAND)
TABLE 185 U.S. RHA IN AESTHETIC INJECTABLE FILLERS MARKET, BY TYPE, 2018-2036 (USD THOUSAND)
TABLE 186 U.S. DENTISTRY IN AESTHETIC INJECTABLE FILLERS MARKET, BY TYPE, 2018-2036 (USD THOUSAND)
TABLE 187 U.S. CHIN AUGMENTATION IN AESTHETIC INJECTABLE FILLERS MARKET, BY TYPE, 2018-2036 (USD THOUSAND)
TABLE 188 U.S. LIPOATROPHY TREATMENT IN AESTHETIC INJECTABLE FILLERS MARKET, BY TYPE, 2018-2036 (USD THOUSAND)
TABLE 189 U.S. SKIN SMOOTHENING IN AESTHETIC INJECTABLE FILLERS MARKET, BY TYPE, 2018-2036 (USD THOUSAND)
TABLE 190 U.S. EARLOBE REJUVENATION IN AESTHETIC INJECTABLE FILLERS MARKET, BY TYPE, 2018-2036 (USD THOUSAND)
TABLE 191 U.S. AESTHETIC INJECTABLE FILLERS MARKET, BY DRUG TYPE, 2018-2036 (USD THOUSAND)
TABLE 192 U.S. BRANDED IN AESTHETIC INJECTABLE FILLERS MARKET, BY TYPE, 2018-2036 (USD THOUSAND)
TABLE 193 U.S. AESTHETIC INJECTABLE FILLERS MARKET, BY END USER, 2018-2036 (USD THOUSAND)
TABLE 194 U.S. AESTHETIC INJECTABLE FILLERS MARKET, BY DISTRIBUTION CHANNEL, 2018-2036 (USD THOUSAND)
TABLE 195 CANADA AESTHETIC INJECTABLE FILLERS MARKET, BY PRODUCT TYPE, 2018-2036 (USD THOUSAND)
TABLE 196 CANADA AESTHETIC INJECTABLE FILLERS MARKET, BY PRODUCT TYPE, 2018-2036 (VOLUME IN THOUSAND UNITS)
TABLE 197 CANADA AESTHETIC INJECTABLE FILLERS MARKET, BY PRODUCT TYPE, 2018-2036 (ASP IN USD/UNITS)
TABLE 198 CANADA NATURAL AESTHETIC INJECTABLE FILLERS IN AESTHETIC INJECTABLE FILLERS MARKET, BY TYPE, 2018-2036 (USD THOUSAND)
TABLE 199 CANADA HYALURONIC ACID (HA) IN AESTHETIC INJECTABLE FILLERS MARKET, BY TYPE, 2018-2036 (USD THOUSAND)
TABLE 200 CANADA MONOPHASIC FILLERS IN AESTHETIC INJECTABLE FILLERS MARKET, BY TYPE, 2018-2036 (USD THOUSAND)
TABLE 201 CANADA MONOPHASIC FILLERS IN AESTHETIC INJECTABLE FILLERS MARKET, BY APPLICATION, 2018-2036 (USD THOUSAND)
TABLE 202 CANADA BIPHASIC FILLERS IN AESTHETIC INJECTABLE FILLERS MARKET, BY MATERIAL TYPE, 2018-2036 (USD THOUSAND)
TABLE 203 CANADA BIPHASIC FILLERS IN AESTHETIC INJECTABLE FILLERS MARKET, BY APPLICATION, 2018-2036 (USD THOUSAND)
TABLE 204 CANADA FAT IN AESTHETIC INJECTABLE FILLERS MARKET, BY APPLICATION, 2018-2036 (USD THOUSAND)
TABLE 205 CANADA COLLAGEN IN AESTHETIC INJECTABLE FILLERS MARKET, BY APPLICATION, 2018-2036 (USD THOUSAND)
TABLE 206 CANADA POLYNUCLEOTIDES / POLYDEOXYRIBONUCLEOTIDES (PN/PDRN) IN AESTHETIC INJECTABLE FILLERS MARKET, BY APPLICATION, 2018-2036 (USD THOUSAND)
TABLE 207 CANADA OTHERS IN AESTHETIC INJECTABLE FILLERS MARKET, BY APPLICATION, 2018-2036 (USD THOUSAND)
TABLE 208 CANADA SYNTHETIC AESTHETIC INJECTABLE FILLERS IN AESTHETIC INJECTABLE FILLERS MARKET, BY TYPE, 2018-2036 (USD THOUSAND)
TABLE 209 CANADA CALCIUM HYDROXYLAPATITE (CAHA) IN AESTHETIC INJECTABLE FILLERS MARKET, BY APPLICATION, 2018-2036 (USD THOUSAND)
TABLE 210 CANADA POLY-L-LACTIC ACID (PLLA) IN AESTHETIC INJECTABLE FILLERS MARKET, BY APPLICATION, 2018-2036 (USD THOUSAND)
TABLE 211 CANADA POLYMETHYL-METHACRYLATE MICROSPHERES (PMMA) IN AESTHETIC INJECTABLE FILLERS MARKET, BY APPLICATION, 2018-2036 (USD THOUSAND)
TABLE 212 CANADA AESTHETIC INJECTABLE FILLERS MARKET, BY TYPE, 2018-2036 (USD THOUSAND)
TABLE 213 CANADA AESTHETIC INJECTABLE FILLERS MARKET, BY TYPE, 2018-2036 (VOLUME IN THOUSAND UNITS)
TABLE 214 CANADA AESTHETIC INJECTABLE FILLERS MARKET, BY TYPE, 2018-2036 (ASP IN USD/UNITS)
TABLE 215 CANADA BIODEGRADABLE AESTHETIC INJECTABLE FILLERS IN AESTHETIC INJECTABLE FILLERS MARKET, BY TYPE, 2018-2036 (USD THOUSAND)
TABLE 216 CANADA BIODEGRADABLE AESTHETIC INJECTABLE FILLERS IN AESTHETIC INJECTABLE FILLERS MARKET, BY TYPE, 2018-2036 (VOLUME IN THOUSAND UNITS)
TABLE 217 CANADA BIODEGRADABLE AESTHETIC INJECTABLE FILLERS IN AESTHETIC INJECTABLE FILLERS MARKET, BY TYPE, 2018-2036 (ASP IN USD/UNITS)
TABLE 218 CANADA AESTHETIC INJECTABLE FILLERS MARKET, BY APPLICATION, 2018-2036 (USD THOUSAND)
TABLE 219 CANADA FACIAL LINE CORRECTION IN AESTHETIC INJECTABLE FILLERS MARKET, BY TYPE, 2018-2036 (USD THOUSAND)
TABLE 220 CANADA FACIAL LINE CORRECTION IN AESTHETIC INJECTABLE FILLERS MARKET, BY LOCATION, 2018-2036 (USD THOUSAND)
TABLE 221 CANADA FACIAL LINE CORRECTION IN AESTHETIC INJECTABLE FILLERS MARKET, BY BRAND, 2018-2036 (USD THOUSAND)
TABLE 222 CANADA LIP ENHANCEMENT IN AESTHETIC INJECTABLE FILLERS MARKET, BY TYPE, 2018-2036 (USD THOUSAND)
TABLE 223 CANADA JUVÉDERM IN AESTHETIC INJECTABLE FILLERS MARKET, BY TYPE, 2018-2036 (USD THOUSAND)
TABLE 224 CANADA RESTYLANE IN AESTHETIC INJECTABLE FILLERS MARKET, BY TYPE, 2018-2036 (USD THOUSAND)
TABLE 225 CANADA RHA IN AESTHETIC INJECTABLE FILLERS MARKET, BY TYPE, 2018-2036 (USD THOUSAND)
TABLE 226 CANADA FACE LIFT IN AESTHETIC INJECTABLE FILLERS MARKET, BY TYPE, 2018-2036 (USD THOUSAND)
TABLE 227 CANADA FACE LIFT IN AESTHETIC INJECTABLE FILLERS MARKET, BY BRAND, 2018-2036 (USD THOUSAND)
TABLE 228 CANADA RHINOPLASTY IN AESTHETIC INJECTABLE FILLERS MARKET, BY TYPE, 2018-2036 (USD THOUSAND)
TABLE 229 CANADA JUVÉDERM IN AESTHETIC INJECTABLE FILLERS MARKET, BY TYPE, 2018-2036 (USD THOUSAND)
TABLE 230 CANADA RESTYLANE IN AESTHETIC INJECTABLE FILLERS MARKET, BY TYPE, 2018-2036 (USD THOUSAND)
TABLE 231 CANADA RHA IN AESTHETIC INJECTABLE FILLERS MARKET, BY TYPE, 2018-2036 (USD THOUSAND)
TABLE 232 CANADA SCAR TREATMENT IN AESTHETIC INJECTABLE FILLERS MARKET, BY TYPE, 2018-2036 (USD THOUSAND)
TABLE 233 CANADA SCAR TREATMENT IN AESTHETIC INJECTABLE FILLERS MARKET, BY BRAND, 2018-2036 (USD THOUSAND)
TABLE 234 CANADA SAGGING SKIN IN AESTHETIC INJECTABLE FILLERS MARKET, BY TYPE, 2018-2036 (USD THOUSAND)
TABLE 235 CANADA CHEEK DEPRESSION IN AESTHETIC INJECTABLE FILLERS MARKET, BY TYPE, 2018-2036 (USD THOUSAND)
TABLE 236 CANADA RECONSTRUCTIVE SURGERY IN AESTHETIC INJECTABLE FILLERS MARKET, BY TYPE, 2018-2036 (USD THOUSAND)
TABLE 237 CANADA AESTHETIC RESTORATION IN AESTHETIC INJECTABLE FILLERS MARKET, BY TYPE, 2018-2036 (USD THOUSAND)
TABLE 238 CANADA JUVÉDERM IN AESTHETIC INJECTABLE FILLERS MARKET, BY TYPE, 2018-2036 (USD THOUSAND)
TABLE 239 CANADA RESTYLANE IN AESTHETIC INJECTABLE FILLERS MARKET, BY TYPE, 2018-2036 (USD THOUSAND)
TABLE 240 CANADA RHA IN AESTHETIC INJECTABLE FILLERS MARKET, BY TYPE, 2018-2036 (USD THOUSAND)
TABLE 241 CANADA DENTISTRY IN AESTHETIC INJECTABLE FILLERS MARKET, BY TYPE, 2018-2036 (USD THOUSAND)
TABLE 242 CANADA CHIN AUGMENTATION IN AESTHETIC INJECTABLE FILLERS MARKET, BY TYPE, 2018-2036 (USD THOUSAND)
TABLE 243 CANADA LIPOATROPHY TREATMENT IN AESTHETIC INJECTABLE FILLERS MARKET, BY TYPE, 2018-2036 (USD THOUSAND)
TABLE 244 CANADA SKIN SMOOTHENING IN AESTHETIC INJECTABLE FILLERS MARKET, BY TYPE, 2018-2036 (USD THOUSAND)
TABLE 245 CANADA EARLOBE REJUVENATION IN AESTHETIC INJECTABLE FILLERS MARKET, BY TYPE, 2018-2036 (USD THOUSAND)
TABLE 246 CANADA AESTHETIC INJECTABLE FILLERS MARKET, BY DRUG TYPE, 2018-2036 (USD THOUSAND)
TABLE 247 CANADA BRANDED IN AESTHETIC INJECTABLE FILLERS MARKET, BY TYPE, 2018-2036 (USD THOUSAND)
TABLE 248 CANADA AESTHETIC INJECTABLE FILLERS MARKET, BY END USER, 2018-2036 (USD THOUSAND)
TABLE 249 CANADA AESTHETIC INJECTABLE FILLERS MARKET, BY DISTRIBUTION CHANNEL, 2018-2036 (USD THOUSAND)
List of Figure
FIGURE 1 NORTH AMERICA AESTHETIC INJECTABLE FILLERS MARKET: SEGMENTATION
FIGURE 2 NORTH AMERICA AESTHETIC INJECTABLE FILLERS MARKET: DATA TRIANGULATION
FIGURE 3 NORTH AMERICA AESTHETIC INJECTABLE FILLERS MARKET: DROC ANALYSIS
FIGURE 4 NORTH AMERICA AESTHETIC INJECTABLE FILLERS MARKET: NORTH AMERICA VS REGIONAL ANALYSIS
FIGURE 5 NORTH AMERICA AESTHETIC INJECTABLE FILLERS MARKET: COMPANY RESEARCH ANALYSIS
FIGURE 6 NORTH AMERICA AESTHETIC INJECTABLE FILLERS MARKET: INTERVIEW DEMOGRAPHICS
FIGURE 7 NORTH AMERICA AESTHETIC INJECTABLE FILLERS MARKET: DBMR MARKET POSITION GRID
FIGURE 8 NORTH AMERICA AESTHETIC INJECTABLE FILLERS MARKET: MARKET END USER COVERAGE GRID
FIGURE 9 NORTH AMERICA AESTHETIC INJECTABLE FILLERS MARKET: VENDOR SHARE ANALYSIS
FIGURE 10 NORTH AMERICA AESTHETIC INJECTABLE FILLERS MARKET: EXECUTIVE SUMMARY
FIGURE 11 NORTH AMERICA AESTHETIC INJECTABLE FILLERS MARKET: SEGMENTATION
FIGURE 12 TWO SEGMENTS COMPRISE THE NORTH AMERICA AESTHETIC INJECTABLE FILLERS MARKET, BY PRODUCT TYPE (2024)
FIGURE 13 STRATEGIC DECISIONS
FIGURE 14 GROWING DEMAND FOR MINIMALLY INVASIVE COSMETIC PROCEDURES EXPECTED TO DRIVE THE NORTH AMERICA AESTHETIC INJECTABLE FILLERS MARKET IN THE FORECAST PERIOD OF 2025 TO 2036
FIGURE 15 NATURAL AESTHETIC INJECTABLE FILLERS SEGMENT IS EXPECTED TO ACCOUNT FOR THE LARGEST SHARE OF THE NORTH AMERICA AESTHETIC INJECTABLE FILLERS MARKET IN 2025 & 2036
FIGURE 16 PORTER’S FIVE FORCES
FIGURE 17 PATENT FILINGS ACROSS SEVERAL KEY JURISDICTIONS:
FIGURE 18 KEY APPLICANTS V/S NUMBER OF PATENTS.
FIGURE 19 IPC CODES V/S PATENT COUNT.
FIGURE 20 YEAR V/S NUMBER OF PATENTS PUBLISHED
FIGURE 21 DROC ANALYSIS
FIGURE 22 NORTH AMERICA AESTHETIC INJECTABLE FILLERS MARKET: BY TYPE, 2024
FIGURE 23 NORTH AMERICA AESTHETIC INJECTABLE FILLERS MARKET: BY TYPE, 2025 TO 2036 (USD THOUSAND)
FIGURE 24 NORTH AMERICA AESTHETIC INJECTABLE FILLERS MARKET: BY TYPE, CAGR (2025- 2036)
FIGURE 25 NORTH AMERICA AESTHETIC INJECTABLE FILLERS MARKET: BY TYPE, LIFELINE CURVE
FIGURE 26 NORTH AMERICA AESTHETIC INJECTABLE FILLERS MARKET: BY PRODUCT TYPE, 2024
FIGURE 27 NORTH AMERICA AESTHETIC INJECTABLE FILLERS MARKET: BY PRODUCT TYPE, 2025 TO 2036 (USD THOUSAND)
FIGURE 28 NORTH AMERICA AESTHETIC INJECTABLE FILLERS MARKET: BY PRODUCT TYPE, CAGR (2025- 2036)
FIGURE 29 NORTH AMERICA AESTHETIC INJECTABLE FILLERS MARKET: BY PRODUCT TYPE, LIFELINE CURVE
FIGURE 30 NORTH AMERICA AESTHETIC INJECTABLE FILLERS MARKET: BY DRUG TYPE, 2024
FIGURE 31 NORTH AMERICA AESTHETIC INJECTABLE FILLERS MARKET: BY DRUG TYPE, 2025 TO 2036 (USD THOUSAND)
FIGURE 32 NORTH AMERICA AESTHETIC INJECTABLE FILLERS MARKET: BY DRUG TYPE, CAGR (2025- 2036)
FIGURE 33 NORTH AMERICA AESTHETIC INJECTABLE FILLERS MARKET: BY DRUG TYPE, LIFELINE CURVE
FIGURE 34 NORTH AMERICA AESTHETIC INJECTABLE FILLERS MARKET: BY APPLICATION, 2024
FIGURE 35 NORTH AMERICA AESTHETIC INJECTABLE FILLERS MARKET: BY APPLICATION, 2025 TO 2036 (USD THOUSAND)
FIGURE 36 NORTH AMERICA AESTHETIC INJECTABLE FILLERS MARKET: BY APPLICATION, CAGR (2025- 2036)
FIGURE 37 NORTH AMERICA AESTHETIC INJECTABLE FILLERS MARKET: BY APPLICATION, LIFELINE CURVE
FIGURE 38 NORTH AMERICA AESTHETIC INJECTABLE FILLERS MARKET: BY END USER, 2024
FIGURE 39 NORTH AMERICA AESTHETIC INJECTABLE FILLERS MARKET: BY END USER, 2025 TO 2036 (USD THOUSAND)
FIGURE 40 NORTH AMERICA AESTHETIC INJECTABLE FILLERS MARKET: BY END USER, CAGR (2025- 2036)
FIGURE 41 NORTH AMERICA AESTHETIC INJECTABLE FILLERS MARKET: BY END USER, LIFELINE CURVE
FIGURE 42 NORTH AMERICA AESTHETIC INJECTABLE FILLERS MARKET: BY DISTRIBUTION CHANNEL, 2024
FIGURE 43 NORTH AMERICA AESTHETIC INJECTABLE FILLERS MARKET: BY DISTRIBUTION CHANNEL, 2025 TO 2036 (USD THOUSAND)
FIGURE 44 NORTH AMERICA AESTHETIC INJECTABLE FILLERS MARKET: BY DISTRIBUTION CHANNEL, CAGR (2025- 2036)
FIGURE 45 NORTH AMERICA AESTHETIC INJECTABLE FILLERS MARKET: BY DISTRIBUTION CHANNEL, LIFELINE CURVE
FIGURE 46 NORTH AMERICA AESTHETIC INJECTABLE FILLERS MARKET: SNAPSHOT (2024)
FIGURE 47 NORTH AMERICA AESTHETIC INJECTABLE FILLERS MARKET: COMPANY SHARE 2024 (%)
North America Aesthetic Injectable Fillers Market, Supply Chain Analysis and Ecosystem Framework
To support market growth and help clients navigate the impact of geopolitical shifts, DBMR has integrated in-depth supply chain analysis into its North America Aesthetic Injectable Fillers Market research reports. This addition empowers clients to respond effectively to global changes affecting their industries. The supply chain analysis section includes detailed insights such as North America Aesthetic Injectable Fillers Market consumption and production by country, price trend analysis, the impact of tariffs and geopolitical developments, and import and export trends by country and HSN code. It also highlights major suppliers with data on production capacity and company profiles, as well as key importers and exporters. In addition to research, DBMR offers specialized supply chain consulting services backed by over a decade of experience, providing solutions like supplier discovery, supplier risk assessment, price trend analysis, impact evaluation of inflation and trade route changes, and comprehensive market trend analysis.
Data collection and base year analysis are done using data collection modules with large sample sizes. The stage includes obtaining market information or related data through various sources and strategies. It includes examining and planning all the data acquired from the past in advance. It likewise envelops the examination of information inconsistencies seen across different information sources. The market data is analysed and estimated using market statistical and coherent models. Also, market share analysis and key trend analysis are the major success factors in the market report. To know more, please request an analyst call or drop down your inquiry.
The key research methodology used by DBMR research team is data triangulation which involves data mining, analysis of the impact of data variables on the market and primary (industry expert) validation. Data models include Vendor Positioning Grid, Market Time Line Analysis, Market Overview and Guide, Company Positioning Grid, Patent Analysis, Pricing Analysis, Company Market Share Analysis, Standards of Measurement, Global versus Regional and Vendor Share Analysis. To know more about the research methodology, drop in an inquiry to speak to our industry experts.
Data Bridge Market Research is a leader in advanced formative research. We take pride in servicing our existing and new customers with data and analysis that match and suits their goal. The report can be customized to include price trend analysis of target brands understanding the market for additional countries (ask for the list of countries), clinical trial results data, literature review, refurbished market and product base analysis. Market analysis of target competitors can be analyzed from technology-based analysis to market portfolio strategies. We can add as many competitors that you require data about in the format and data style you are looking for. Our team of analysts can also provide you data in crude raw excel files pivot tables (Fact book) or can assist you in creating presentations from the data sets available in the report.


