
North America Agricultural Lubricants Market
Market Size in USD Million
 USD
569.01 Million
USD
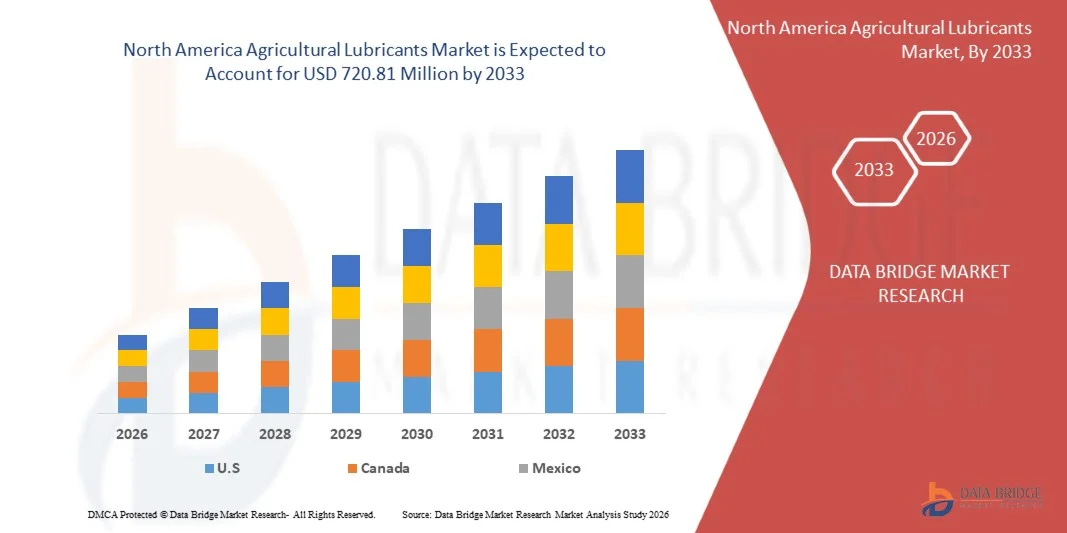
720.81 Million
2025
2033
USD
569.01 Million
USD
720.81 Million
2025
2033
| 2026 - 2033 | |
| USD 569.01 Million | |
| USD 720.81 Million | |
| % | |
|
North America Agricultural Lubricants Market Overview
As per Data Bridge Market Research analysis the North America agricultural lubricants market was valued at USD 569.01 million in 2025 and is projected to reach USD 720.81 million by 2033, growing at a CAGR of 3.00% from 2026 to 2033. The market is experiencing steady growth driven by increasing mechanization in agriculture, rising demand for high-performance lubricants for tractors and farm machinery, and expanding adoption of precision farming equipment across developing and developed economies.
The growing use of tractors, harvesters, sprayers, tillers, and other agricultural machinery is increasing the need for engine oils, hydraulic fluids, transmission oils, gear oils, and greases that support equipment reliability under demanding field conditions. Agricultural lubricants help reduce friction, prevent wear and corrosion, improve fuel efficiency, and extend machinery service life, making them essential for minimizing maintenance costs and operational downtime.
In addition, the expansion of large-scale commercial farming, government support for farm mechanization, and increasing awareness regarding preventive equipment maintenance are supporting market demand. Manufacturers are also introducing bio-based and environmentally compatible lubricants to address sustainability requirements and reduce the environmental impact of lubricant leakage and disposal in agricultural operations.
Key Market Trends & Insights
- The U.S. dominated the North America agricultural lubricants market with the largest revenue share of approximately 79.4% in 2025, supported by extensive use of tractors, harvesters, sprayers, and advanced agricultural equipment across large-scale farming operations.
- Canada agricultural lubricants market accounted for a significant revenue share of approximately 20.6% in 2025 within North America, supported by expanding large-scale commercial farming, rising mechanization of agricultural operations, and increasing adoption of high-performance tractors, harvesters, and irrigation equipment.
- The Mineral Oil segment held the largest market revenue share of approximately 56.8% in 2025, driven by its cost-effectiveness, widespread availability, and established use across conventional tractors, harvesters, and other agricultural machinery. Mineral oil-based formulations remain widely preferred for routine engine, transmission, and hydraulic maintenance due to their compatibility with legacy equipment and lower replacement costs.
- The Synthetic segment is projected to register the fastest growth from 2026 to 2033, driven by increasing demand for lubricants offering superior oxidation stability, temperature resistance, and extended drain intervals. The growing use of high-horsepower tractors, precision farming machinery, and advanced hydraulic systems is accelerating the adoption of synthetic formulations. Bio-based lubricants are also gaining traction as farm operators and equipment owners increasingly focus on biodegradable alternatives for environmentally sensitive agricultural applications.
- The Engine Oil segment held the largest market revenue share of approximately 53.35% in 2024, driven by the extensive use of diesel-powered tractors, combines, harvesters, and self-propelled agricultural equipment. Engine oils are essential for reducing wear, controlling soot deposits, preventing corrosion, and maintaining engine efficiency during extended field operations.
- The Hydraulic Oils segment is projected to register the fastest growth from 2026 to 2033, supported by rising adoption of hydraulic lifts, loaders, steering systems, sprayers, and automated implements. Modern agricultural equipment increasingly integrates complex hydraulic systems that require fluids with high thermal stability, anti-wear properties, and consistent viscosity performance. Grease also represents a significant product category due to its use in bearings, joints, couplings, and other high-load moving components across farm machinery.
- The Petroleum-Based Lubricants segment held the largest market revenue share of approximately 64.2% in 2025, supported by established refining infrastructure, broad product availability, and lower costs compared with alternative formulations. Petroleum-based lubricants continue to be widely used across engines, gears, transmissions, and hydraulic systems because they provide reliable performance for a broad range of agricultural machinery.
- The Bio-Based Lubricants segment is projected to register the fastest growth from 2026 to 2033, driven by increasing demand for biodegradable hydraulic fluids, greases, and chain oils. Bio-based products are gaining adoption in applications where accidental lubricant leakage can affect soil, crops, and water systems. Growing interest in soybean oil-based lubricant formulations and improving performance characteristics of bio-derived esters are further supporting segment expansion.
- The Engines segment held the largest market revenue share of approximately 44.2% in 2025, driven by the high lubricant consumption of diesel engines used in tractors, harvesters, balers, and other self-propelled agricultural machinery. Regular engine maintenance cycles and the need for protection against dust, soot, high temperatures, and heavy operating loads continue to support segment dominance.
- The Hydraulics segment is projected to register the fastest growth from 2026 to 2033, supported by the growing use of hydraulic-powered implements, loaders, lifting systems, and precision farming equipment. Hydraulic lubricants are increasingly required to provide stable pressure control, anti-wear protection, and resistance to oxidation during demanding agricultural operations. Gear and transmission applications also account for a substantial share due to the widespread use of power take-off systems, final drives, wet brakes, and continuously variable transmissions in modern agricultural equipment.
- The Tractors segment held the largest market revenue share of approximately 50.1% in 2025, driven by their widespread use across land preparation, planting, irrigation, material handling, and crop transportation activities. Tractors require regular consumption of engine oils, transmission fluids, hydraulic oils, and greases, supporting their leading position in lubricant demand.
- The Harvesters segment is projected to register the fastest growth from 2026 to 2033, driven by increasing use of combines, forage harvesters, and specialized crop harvesting equipment. Harvesters operate under high mechanical loads during seasonal harvesting periods and require frequent lubrication of engines, hydraulic circuits, cutting systems, bearings, and gear assemblies. Balers, sprayers, fertilizer spreaders, and mowers also represent important equipment categories as agricultural operations increasingly adopt mechanized solutions to improve productivity and reduce labor dependency.
Market Size & Forecast
- Market Value (2025): USD 569.01 Billion
- Expected Market Value (2033): USD 720.81 Billion
- Forecast CAGR (2026–2033): 3.00%
- Leading Country in 2025: U.S.
- Fastest Country Region: Canada
Report Scope and North America Agricultural Lubricants Market Segmentation
|
Attributes |
North America Agricultural Lubricants Key Market Insights |
|
Segments Covered |
· By Category: Mineral Oil, Synthetic, and Bio-based · By Type: Engine Oil, Grease, Hydraulic Oils, Transformer Oil, Crankcase Oils, Bar and Chain Oil, and Others · By Raw Material: Petroleum Based Lubricants and Bio-Based Lubricants · By Application: Engines, Gear and Transmission, Hydraulics, Greasing, Chain, Implements, and Others · By Agricultural Equipment: Tractors, Harvesters, Corn-Pickers, Balers, Verge Cutters, Circular Spike Harrows, Stone Grinders, Fertilizer Spreaders, Slurry Tankers, Sprayers, Fodder Mixers, Silage Spreaders, Straw Blowers, Mowers and Mower-Conditioners, Hay Tedders, Hay Rakes, Bale Wrappers, Grape Harvesting Machines, and Others |
|
Countries Covered |
North America · U.S. · Canada · Mexico |
|
Key Market Players |
• ExxonMobil (U.S.) |
|
Market Opportunities |
• Growing Adoption Of Bio-Based And Environmentally Compatible Agricultural Lubricants • Increasing Farm Mechanization And Demand For Advanced Agricultural Machinery |
|
Value Added Data Infosets |
In addition to the insights on market scenarios such as market value, growth rate, segmentation, geographical coverage, and major players, the market reports curated by the Data Bridge Market Research also include import export analysis, production capacity overview, production consumption analysis, price trend analysis, climate change scenario, supply chain analysis, value chain analysis, raw material/consumables overview, vendor selection criteria, PESTLE Analysis, Porter Analysis, and regulatory framework. |
North America Agricultural Lubricants Market Trends
Trend: Growing Adoption Of High-Performance And Bio-Based Agricultural Lubricants
The agricultural lubricants market is witnessing a growing shift toward high-performance synthetic, semi-synthetic, and bio-based formulations designed to improve machinery reliability, extend service intervals, and reduce environmental impact. Agricultural equipment operates under demanding conditions involving heavy loads, dust exposure, moisture, temperature fluctuations, and long operating hours, increasing the need for lubricants with enhanced oxidation stability, anti-wear protection, and viscosity control. Conventional mineral-based lubricants remain widely used because of their lower cost and broad compatibility; however, equipment owners are increasingly evaluating premium products that can reduce maintenance frequency and minimize unplanned downtime.
Modern tractors, combines, balers, sprayers, and harvesting equipment increasingly use integrated hydraulic, transmission, wet-brake, and power take-off systems that require specialized universal tractor transmission oils and hydraulic fluids. For instance, engine oil accounted for approximately 47.2% of agricultural lubricant demand in 2025, reflecting the high lubricant consumption associated with diesel-powered tractors and other heavy agricultural machinery. Manufacturers are also developing multi-functional lubricant formulations that support engines, gearboxes, hydraulics, and final drives, helping farm operators reduce inventory complexity while maintaining equipment performance across varying field conditions.
The growing focus on environmentally responsible farming practices is further supporting demand for biodegradable and bio-based lubricants, particularly for hydraulic systems, chains, and equipment operating in areas where accidental fluid leakage can reach soil or water. Bio-based hydraulic fluids are gaining relevance in tractors, harvesters, and forestry-linked agricultural equipment because these applications face greater leakage and spill exposure during field operations. In addition, lubricant suppliers are introducing products with improved biodegradability, thermal resistance, and load-carrying capacity to address sustainability requirements without compromising machine protection.
Global Agricultural Lubricants Market Dynamics
Key Market Driver: Rising Farm Mechanization And Demand For Equipment Maintenance
The increasing adoption of mechanized farming equipment is a major driver for agricultural lubricant consumption. Farmers and agricultural contractors are deploying tractors, harvesters, tillers, seeders, irrigation pumps, and crop-handling equipment to improve productivity, manage labor shortages, and support timely agricultural operations. These machines require regular use of engine oils, hydraulic fluids, gear oils, transmission oils, coolants, and greases to reduce friction, control heat, prevent corrosion, and maintain efficient operation under high-load conditions.
The need to reduce equipment downtime is becoming increasingly important as modern agricultural machinery represents a significant capital investment for farm operators. For instance, engine oil represented approximately 47.2% of the agricultural lubricants market in 2025, supported by its essential role in protecting diesel engines from soot accumulation, deposit formation, wear, and corrosion. Advanced engine oils are also increasingly formulated to support turbocharged and high-output agricultural engines that operate for extended periods during planting and harvesting seasons.
Agricultural machinery manufacturers and lubricant suppliers are also expanding the use of universal tractor transmission oils that serve combined hydraulic and transmission requirements. These products help simplify maintenance procedures and support wet-brake systems, power steering, hydraulic lifts, and gear components within a single machine. The continued growth in farm machinery adoption, combined with increasing awareness regarding preventive maintenance, is expected to support consistent demand for agricultural lubricants through OEM and aftermarket service channels.
Key Restraint/Challenge: Volatility In Base Oil Prices And Preference For Low-Cost Lubricants
Fluctuating prices of crude oil, base oils, additives, and specialty chemical inputs remain a major challenge for the agricultural lubricants market. Agricultural lubricants are largely dependent on petroleum-derived base oils and performance additives, making production costs sensitive to changes in crude oil prices, refining capacity, transportation expenses, and supply chain disruptions. These fluctuations can increase product prices and create procurement uncertainty for lubricant manufacturers, distributors, and end users.
Cost sensitivity among small and medium-scale farm operators also limits the adoption of premium synthetic and bio-based lubricants. Although high-performance lubricants can provide longer drain intervals, improved thermal stability, and enhanced wear protection, their higher upfront cost often encourages users to select lower-priced mineral oil formulations. Mineral oil-based lubricants continue to retain a strong market position because of their widespread availability, familiarity among operators, and suitability for older agricultural equipment.
In addition, improper lubricant selection, delayed oil changes, and the use of non-compliant fluids can affect machinery performance and increase maintenance costs. Modern agricultural equipment requires lubricants that meet specific OEM requirements for engines, transmissions, hydraulic systems, and wet brakes. The lack of awareness regarding these technical specifications in some farming operations can lead to lubricant incompatibility, component wear, reduced fuel efficiency, and avoidable equipment downtime.
Key Market Opportunity: Expansion Of Bio-Based Lubricants And Advanced Precision Farming Equipment
The growing adoption of bio-based lubricants presents a significant opportunity for agricultural lubricant manufacturers. Environmental concerns related to lubricant leakage, soil contamination, and disposal are encouraging the development of biodegradable hydraulic fluids, greases, and chain oils for agricultural applications. These products are particularly relevant for equipment operating in environmentally sensitive areas, where lost-in-use lubricants can be dispersed directly into soil and surrounding ecosystems.
Agricultural equipment manufacturers are also introducing more advanced tractors, combines, autonomous machinery, precision sprayers, and digitally connected farm equipment that require specialized lubricant solutions. High-horsepower engines, continuously variable transmissions, integrated hydraulic systems, and electronically controlled components require lubricants with improved shear stability, oxidation resistance, low-temperature fluidity, and anti-wear performance. This is creating opportunities for synthetic and semi-synthetic formulations that can support longer service intervals and improved equipment availability.
For instance, industry estimates indicate that the agricultural lubricants market is projected to grow from USD 7.55 billion in 2026 to USD 8.95 billion by 2031, supported by rising farm mechanization, increased use of modern agricultural machinery, and greater emphasis on maintenance efficiency. The expansion of OEM-approved lubricants, multi-functional universal tractor transmission oils, and biodegradable products is expected to create additional revenue opportunities as farm operators increasingly prioritize machinery protection, operational efficiency, and sustainable agricultural practices.
North America Agricultural Lubricants Market Scope
The market is segmented on the basis of category, type, raw material, application, and agricultural equipment.
- By Category
On the basis of category, the North America agricultural lubricants market is segmented into mineral oil, synthetic, and bio-based. The Mineral Oil segment held the largest market revenue share of approximately 56.8% in 2025, driven by its cost-effectiveness, widespread availability, and established use across conventional tractors, harvesters, and other agricultural machinery. Mineral oil-based formulations remain widely preferred for routine engine, transmission, and hydraulic maintenance due to their compatibility with legacy equipment and lower replacement costs.
The Synthetic segment is projected to register the fastest growth from 2026 to 2033, driven by increasing demand for lubricants offering superior oxidation stability, temperature resistance, and extended drain intervals. The growing use of high-horsepower tractors, precision farming machinery, and advanced hydraulic systems is accelerating the adoption of synthetic formulations. Bio-based lubricants are also gaining traction as farm operators and equipment owners increasingly focus on biodegradable alternatives for environmentally sensitive agricultural applications.
- By Type
On the basis of type, the North America agricultural lubricants market is segmented into engine oil, grease, hydraulic oils, transformer oil, crankcase oils, bar and chain oil, and others. The Engine Oil segment held the largest market revenue share of approximately 53.35% in 2024, driven by the extensive use of diesel-powered tractors, combines, harvesters, and self-propelled agricultural equipment. Engine oils are essential for reducing wear, controlling soot deposits, preventing corrosion, and maintaining engine efficiency during extended field operations.
The Hydraulic Oils segment is projected to register the fastest growth from 2026 to 2033, supported by rising adoption of hydraulic lifts, loaders, steering systems, sprayers, and automated implements. Modern agricultural equipment increasingly integrates complex hydraulic systems that require fluids with high thermal stability, anti-wear properties, and consistent viscosity performance. Grease also represents a significant product category due to its use in bearings, joints, couplings, and other high-load moving components across farm machinery.
- By Raw Material
On the basis of raw material, the North America agricultural lubricants market is segmented into petroleum-based lubricants and bio-based lubricants. The Petroleum-Based Lubricants segment held the largest market revenue share of approximately 64.2% in 2025, supported by established refining infrastructure, broad product availability, and lower costs compared with alternative formulations. Petroleum-based lubricants continue to be widely used across engines, gears, transmissions, and hydraulic systems because they provide reliable performance for a broad range of agricultural machinery.
The Bio-Based Lubricants segment is projected to register the fastest growth from 2026 to 2033, driven by increasing demand for biodegradable hydraulic fluids, greases, and chain oils. Bio-based products are gaining adoption in applications where accidental lubricant leakage can affect soil, crops, and water systems. Growing interest in soybean oil-based lubricant formulations and improving performance characteristics of bio-derived esters are further supporting segment expansion.
- By Application
On the basis of application, the North America agricultural lubricants market is segmented into engines, gear and transmission, hydraulics, greasing, chain, implements, and others. The Engines segment held the largest market revenue share of approximately 44.2% in 2025, driven by the high lubricant consumption of diesel engines used in tractors, harvesters, balers, and other self-propelled agricultural machinery. Regular engine maintenance cycles and the need for protection against dust, soot, high temperatures, and heavy operating loads continue to support segment dominance.
The Hydraulics segment is projected to register the fastest growth from 2026 to 2033, supported by the growing use of hydraulic-powered implements, loaders, lifting systems, and precision farming equipment. Hydraulic lubricants are increasingly required to provide stable pressure control, anti-wear protection, and resistance to oxidation during demanding agricultural operations. Gear and transmission applications also account for a substantial share due to the widespread use of power take-off systems, final drives, wet brakes, and continuously variable transmissions in modern agricultural equipment.
- By Agricultural Equipment
On the basis of agricultural equipment, the North America agricultural lubricants market is segmented into tractors, harvesters, corn-pickers, balers, verge cutters, circular spike harrows, stone grinders, fertilizer spreaders, slurry tankers, sprayers, fodder mixers, silage spreaders, straw blowers, mowers and mower-conditioners, hay tedders, hay rakes, bale wrappers, grape harvesting machines, and others. The Tractors segment held the largest market revenue share of approximately 50.1% in 2025, driven by their widespread use across land preparation, planting, irrigation, material handling, and crop transportation activities. Tractors require regular consumption of engine oils, transmission fluids, hydraulic oils, and greases, supporting their leading position in lubricant demand.
The Harvesters segment is projected to register the fastest growth from 2026 to 2033, driven by increasing use of combines, forage harvesters, and specialized crop harvesting equipment. Harvesters operate under high mechanical loads during seasonal harvesting periods and require frequent lubrication of engines, hydraulic circuits, cutting systems, bearings, and gear assemblies. Balers, sprayers, fertilizer spreaders, and mowers also represent important equipment categories as agricultural operations increasingly adopt mechanized solutions to improve productivity and reduce labor dependency.
North America Agricultural Lubricants Market Regional Analysis
U.S. Agricultural Lubricants Market Insight
The U.S. agricultural lubricants market captured the largest revenue share of approximately 79.4% in 2025 within North America, fueled by the extensive deployment of tractors, combines, balers, sprayers, and other self-propelled agricultural equipment. The growing focus on improving farm productivity, managing labor shortages, and reducing machinery downtime is increasing demand for specialized lubricants across engine, hydraulic, transmission, and greasing applications. The growing adoption of high-horsepower equipment, connected farm machinery, and precision agriculture systems is further accelerating demand for premium lubricant formulations that can perform under high loads, variable temperatures, and prolonged operating cycles. Moreover, the increasing use of universal tractor transmission oils and advanced hydraulic fluids is supporting simplified maintenance practices across modern farm fleets. The expanding preference for bio-based and biodegradable lubricants, particularly for applications involving potential soil and water exposure, is also contributing to the market's expansion.
Canada Agricultural Lubricants Market Insight
The Canada agricultural lubricants market accounted for a significant revenue share of approximately 20.6% in 2025 within North America, supported by expanding large-scale commercial farming, rising mechanization of agricultural operations, and increasing adoption of high-performance tractors, harvesters, and irrigation equipment. The growing need for efficient farm operations in long operating cycles and harsh weather conditions is driving demand for engine oils, hydraulic fluids, transmission oils, gear lubricants, and greases. The market is further supported by increasing preference for advanced synthetic and bio-based lubricants designed to improve fuel efficiency, reduce wear and tear, and extend machinery service life. Canadian agricultural operators are increasingly focusing on preventive maintenance practices to minimize equipment downtime during critical planting and harvesting seasons. Additionally, rising awareness regarding environmental sustainability and soil protection is accelerating the adoption of biodegradable lubricants, particularly in hydraulic and chain applications used in field operations.
North America Agricultural Lubricants Market Share
The North America Agricultural Lubricants industry is primarily led by well-established companies, including:
- ExxonMobil (U.S.)
- Chevron (U.S.)
- Phillips 66 (U.S.)
- Valvoline Global (U.S.)
- CHS Inc. (U.S.)
- Calumet, Inc.(U.S.)
- Amalie Oil Company(U.S.)
- Smitty’s Supply, Inc.(U.S.)
- Lubrication Engineers, Inc.(U.S.)
- Hydrotex(U.S.)
- Renewable Lubricants, Inc.(U.S.)
- Frontier Lubricants(U.S.)
- WARCO Lubricants(U.S.)
- Advantage Lubricants(U.S.)
- Petro-Canada Lubricants(Canada)
SKU-

- Interactive Data Analysis Dashboard
- Company Analysis Dashboard for high growth potential opportunities
- Research Analyst Access for customization & queries
- Competitor Analysis with Interactive dashboard
- Latest News, Updates & Trend analysis
- Harness the Power of Benchmark Analysis for Comprehensive Competitor Tracking
North America Agricultural Lubricants Market, Supply Chain Analysis and Ecosystem Framework
To support market growth and help clients navigate the impact of geopolitical shifts, DBMR has integrated in-depth supply chain analysis into its North America Agricultural Lubricants Market research reports. This addition empowers clients to respond effectively to global changes affecting their industries. The supply chain analysis section includes detailed insights such as North America Agricultural Lubricants Market consumption and production by country, price trend analysis, the impact of tariffs and geopolitical developments, and import and export trends by country and HSN code. It also highlights major suppliers with data on production capacity and company profiles, as well as key importers and exporters. In addition to research, DBMR offers specialized supply chain consulting services backed by over a decade of experience, providing solutions like supplier discovery, supplier risk assessment, price trend analysis, impact evaluation of inflation and trade route changes, and comprehensive market trend analysis.
Data collection and base year analysis are done using data collection modules with large sample sizes. The stage includes obtaining market information or related data through various sources and strategies. It includes examining and planning all the data acquired from the past in advance. It likewise envelops the examination of information inconsistencies seen across different information sources. The market data is analysed and estimated using market statistical and coherent models. Also, market share analysis and key trend analysis are the major success factors in the market report. To know more, please request an analyst call or drop down your inquiry.
The key research methodology used by DBMR research team is data triangulation which involves data mining, analysis of the impact of data variables on the market and primary (industry expert) validation. Data models include Vendor Positioning Grid, Market Time Line Analysis, Market Overview and Guide, Company Positioning Grid, Patent Analysis, Pricing Analysis, Company Market Share Analysis, Standards of Measurement, Global versus Regional and Vendor Share Analysis. To know more about the research methodology, drop in an inquiry to speak to our industry experts.
Data Bridge Market Research is a leader in advanced formative research. We take pride in servicing our existing and new customers with data and analysis that match and suits their goal. The report can be customized to include price trend analysis of target brands understanding the market for additional countries (ask for the list of countries), clinical trial results data, literature review, refurbished market and product base analysis. Market analysis of target competitors can be analyzed from technology-based analysis to market portfolio strategies. We can add as many competitors that you require data about in the format and data style you are looking for. Our team of analysts can also provide you data in crude raw excel files pivot tables (Fact book) or can assist you in creating presentations from the data sets available in the report.


