
North America Agritech Market
Market Size in USD Billion
 USD
7.74 Billion
USD
17.99 Billion
2025
2033
USD
7.74 Billion
USD
17.99 Billion
2025
2033
| 2026 - 2033 | |
| USD 7.74 Billion | |
| USD 17.99 Billion | |
| % | |
|
North America Agritech Market Size
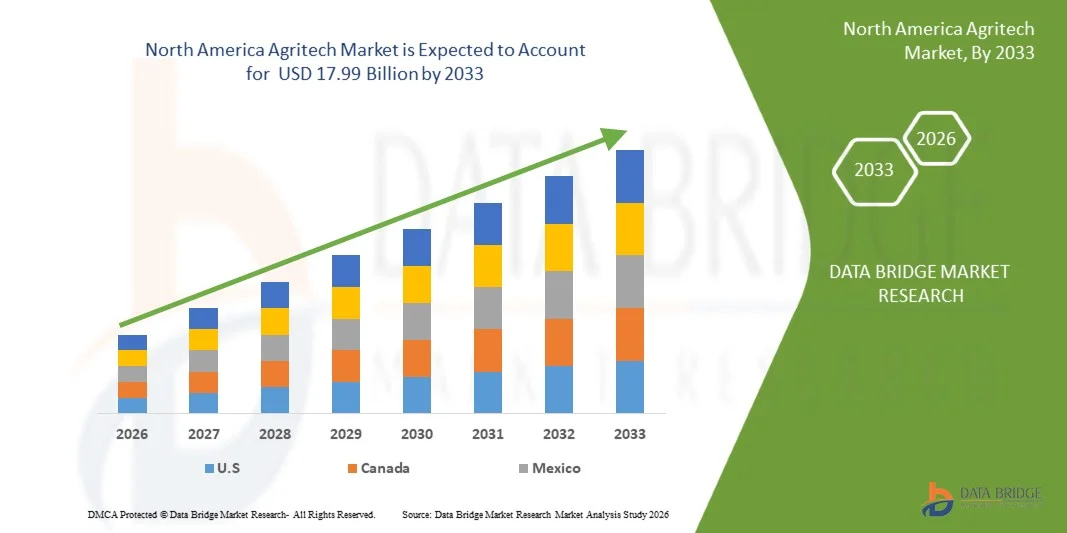
- The North America Agritech market was valued at USD 7.74 billion in 2025 and is expected to reach USD 17.99 billion by 2033 at a CAGR of 11.3% during the forecast period.
- The market is primarily driven by increasing demand for cost-effective, technology-enabled, and sustainable agricultural solutions. Key adoption areas include precision farming, smart irrigation, farm automation, digital farm management platforms, and data-driven crop monitoring across both large commercial farms and mid-scale agricultural operations.
- Sustained market growth is supported by continuous innovations in agri-IoT, AI-based analytics, robotics, drones, and advanced sensing technologies, along with the expanding availability of cloud-based platforms and integrated hardware–software solutions. Favourable government initiatives promoting sustainable agriculture, rising investments in climate-resilient farming practices, and increasing focus on resource efficiency, yield optimization, and emission reduction are strengthening the overall market outlook in North America.
North America Agritech Market Analysis
- The North America agritech market is witnessing steady advancement as solution providers increasingly focus on technological innovation, farm-level efficiency, and application-specific optimization to address evolving agricultural productivity and sustainability needs. Agritech developers are leveraging precision agriculture tools, AI-driven analytics, IoT-enabled sensors, drones, and automation systems to enhance crop monitoring, yield prediction, soil health management, and input optimization across large commercial farms, mid-sized operations, and controlled-environment agriculture. integration of digital dashboards, real-time data connectivity, and cloud-based farm management platforms is further shaping product development strategies across the region.
- These advancements are strengthening the regional agritech value chain by improving operational efficiency, scalability, and decision accuracy, while reducing resource wastage, labor dependency, and overall production costs. Expanding direct-to-farm sales models, dealer networks, agri-input partnerships, and collaborations with agribusinesses and cooperatives are enabling faster market penetration and improved farmer access. Rising adoption of agritech solutions across row crops, horticulture, livestock management, and greenhouse farming, supported by government sustainability programs, smart farming incentives, and climate-resilient agriculture initiatives, is further enhancing market accessibility.
- U.S. is expected to dominate the North America Agritech Market with the largest revenue share of 77.95% in 2025, supported by large-scale commercial farming operations, high technology adoption rates, strong agri-tech startup activity, and sustained investments in digital agriculture, automation, and data-driven farming solutions.
- Canada is projected to be the fastest-growing market, registering a CAGR of 12.0%, driven by increasing adoption of precision farming technologies, smart irrigation systems, and climate-adaptive agricultural practices, along with supportive government policies and growing awareness of sustainable food production.
- In 2025, the precision farming equipment segment is expected to dominate the North America agritech market with a 34.56% share, reflecting strong demand for GPS-guided machinery, variable rate technology, field sensors, and automated equipment. Widespread use across crop production, farm monitoring, and resource management applications, combined with continuous technological innovation and digital integration, continues to reinforce the segment’s leadership within the North America Agritech market.
Report Scope and North America Agritech Market Segmentation
|
Attributes |
North America Agritech Key Market insights |
|
Segments Covered |
|
|
Country Covered |
North America
|
|
Key Market Players |
|
|
Market Opportunities |
|
|
Value Added Data infosets |
in addition to the insights on market scenarios such as market value, growth rate, segmentation, geographical coverage, and major players, the market reports curated by the Data Bridge Market Research also include depth expert analysis, pipeline analysis, pricing analysis, and regulatory framework. |
North America Agritech Market Trends
“Growing Integration of Artificial Intelligence and Analytics in Agriculture”
- The growing integration of artificial intelligence (AI) and advanced analytics in agriculture is reshaping modern farming by enabling highly data-driven, precise, and efficient operations. AI technologies—including machine learning, deep learning, computer vision, and predictive modeling—are increasingly being applied to analyze vast amounts of data generated from IoT-enabled sensors, drones, satellite imagery, and automated machinery. This allows farmers to monitor soil health, weather patterns, crop growth, irrigation levels, and pest or disease outbreaks in real time, enabling timely interventions and optimized use of water, fertilizers, and other inputs.
- Advanced analytics platforms are also empowering farmers with actionable insights on yield forecasting, market demand prediction, and supply chain optimization. By combining historical and real-time data, these tools help reduce operational risks, minimize crop losses, and improve farm profitability. For example, predictive algorithms can alert farmers to potential pest infestations or nutrient deficiencies before they significantly impact crop health, while AI-driven analytics can recommend optimal planting and harvesting schedules based on weather and soil conditions.
- The integration of AI and analytics is further enhancing sustainability in agriculture by reducing overuse of inputs, lowering greenhouse gas emissions, and supporting precision resource management. As farms become increasingly connected and digitized, AI and analytics are emerging as foundational technologies that not only increase productivity and efficiency but also facilitate smarter, more resilient, and environmentally responsible farming systems. This trend represents a critical opportunity for agritech providers to deliver innovative solutions that drive both economic and ecological benefits across the North America agricultural landscape.
- In January 2026, Ceres AI announced an upgraded integration with the John Deere Operations Center, enabling growers to access Ceres’s AI‑powered imagery and analytics directly within the platform, which enhances real‑time field monitoring, crop health analysis, and decision‑making for improved productivity and sustainability.
- As highlighted in November 2025 by Land O’Lakes in partnership with Microsoft, the AI-based assistant “Oz” was introduced to provide field-specific recommendations derived from advanced analytics, helping farmers optimize fertilizer use, irrigation, and pest management across their operations.
- In conclusion, the growing integration of artificial intelligence and analytics is revolutionizing modern agriculture by enabling data-driven decision-making, precision resource management, and predictive insights for crop health, irrigation, and pest control. By leveraging AI-powered tools and advanced analytics, farmers can optimize yields, reduce input waste, and enhance operational efficiency, while improving sustainability and profitability. This trend represents a significant growth driver for the agritech market, positioning AI and analytics as essential technologies for smarter, more resilient, and future-ready agricultural systems
North America Agritech Market Dynamics
Driver
“Rising Adoption of Precision Farming Technologies”
- The rising adoption of precision farming technologies is being shaped by the increasing need to make agricultural production more efficient, predictable, and economically viable. As farming operations face mounting pressure from fluctuating input costs, labor constraints, and yield uncertainty, technology-enabled approaches are being embraced to gain better control over field-level variability. Tools such as GPS-guided tractors, soil and crop sensors, satellite and drone-based imaging, and automated machinery are being deployed to monitor farm conditions with greater accuracy. Through these systems, real-time data is being captured across multiple stages of the crop cycle, allowing farming decisions to be guided by measurable field insights rather than traditional trial-and-error methods.
- At the operational level, precision farming technologies are enabling targeted application of critical inputs, including seeds, fertilizers, irrigation, and crop protection chemicals. instead of uniform input distribution, variable rate technologies are being used to match application levels with specific soil conditions, crop health, and yield potential. This approach is resulting in improved input-use efficiency, reduced wastage, and lower environmental impact, while also supporting consistent yield outcomes. By minimizing overuse of resources and addressing underperforming areas within fields, farms are being managed more systematically, leading to better cost control and improved return on investment over time.
- Beyond productivity gains, precision farming is also contributing to a broader transformation in how farms are planned, monitored, and optimized. Data generated from connected equipment and digital platforms is being analyzed to support yield forecasting, risk assessment, and long-term farm planning. As climate variability and weather unpredictability increase, these technologies are being relied upon to anticipate stress factors and enable timely interventions. Collectively, the adoption of precision farming technologies is positioning agriculture as a more data-driven and resilient sector, where informed decision-making is becoming central to sustainable farm growth and long-term food security.
- As reported by John Deere on its official press platform in March 2025, the company highlighted precision upgrades that enable farmers to integrate advanced satellite-connected guidance, precision ag sustainability tools, and automated equipment features into existing machinery fleets, helping improve field efficiency and resource utilization across diverse crop operations.
- As reported by John Deere Australia & New Zealand on its official news site in May 2025, the company emphasized the importance of driving greater utilization of precision farming technologies across farm operations to help users extract higher efficiency and productivity from their equipment, especially through connected precision features and guidance tools.
- In conclusion, the rising adoption of precision farming technologies across North America agriculture supported by increasing use of connected equipment, sensors, and data-driven farm management tools is a structural and long-term driver of the agritech market. As agricultural operations become more technology-enabled, precision-oriented, and resource-efficient, precision farming solutions will remain critical to improving productivity, reducing input inefficiencies, and enabling scalable, sustainable agricultural development across regions
Restraints/Challenges
“High Initial Investment and Technology Adoption Costs”
- High initial investment and technology adoption costs are significant barriers to the widespread adoption of advanced agritech solutions, particularly among small and marginal farmers. Cutting-edge farming technologies including precision machinery, sensors, drones, automated irrigation systems, and digital farm management platforms often require substantial upfront capital for purchase, installation, and training. For many farmers, especially in emerging economies, these costs can exceed available financial resources, making it difficult to justify the short-term investment despite the potential long-term productivity gains.
- Moreover, ongoing expenses related to system maintenance, software subscriptions, and technical support further increase the total cost of ownership, creating additional hesitation in adopting new technologies. This financial barrier is compounded by limited access to affordable credit and financing options for technology-driven farm operations, slowing the pace of digital and mechanized farming transformation.
- As a result, high initial investment and technology adoption costs remain a key restraint in the agritech market, influencing adoption rates, limiting scalability, and creating disparities in access to productivity-enhancing innovations between large commercial farms and smaller, resource-constrained farming communities.
- In March 2025, Deere & Company emphasized in an official press release that although automated steering systems, advanced sensors, and connected farm equipment significantly improve efficiency, the high upfront investment required for these technologies continues to restrict adoption among smaller far.
- As highlighted by CNH industrial in October 2024, their advanced telematics and precision agriculture solutions demand considerable initial capital, which many operators find challenging to justify despite the promise of long-term yield and operational benefits.
- In August 2024, Mahindra & Mahindra announced via official media channels that financing schemes are being introduced alongside smart tractor and digital farming solutions to overcome customer concerns regarding the high acquisition costs of technology-enabled machinery.
- In conclusion, high upfront costs and technology adoption expenses continue to restrain the agritech market, limiting access for smaller farmers. Subsidies, financing options, and cost-effective solutions will be key to enabling broader adoption and realizing the benefits of modern agricultural technologies
North America Agritech Market Scope
North America agritech market is categorized into seven notable segments which are based on product type, plant science, technology, application, farm size end users, and distribution channel.
- By Product Type
On the basis of product type, the North America agritech market is segmented into precision farming equipment, farm management software, smart irrigation systems, agricultural drones, and others. in 2026, the precision farming equipment segment is expected to dominate the market with a 34.53% share, driven by widespread adoption across large and medium-sized farms for GPS-guided machinery, variable-rate application, automated harvesting, and real-time field monitoring. Strong replacement demand for modernized equipment, expansion of use cases beyond traditional mechanization, and growing adoption of connected, easy-to-operate, and productivity-enhancing technologies continue to reinforce the segment’s leadership in the region.
The farm management software segment is expected to be the fastest-growing, registering a CAGR of 12.0% in the North America agritech market. Growth is driven by rising demand for integrated, user-friendly, and scalable digital platforms that enable data-driven decision-making, resource planning, compliance tracking, and yield optimization. increasing adoption across commercial farms, cooperatives, and agribusinesses, along with expansion of subscription-based models, cloud deployment, and mobile access, is expected to further accelerate market penetration across North America.
- By Plant Science
On the basis of plant science, the North America agritech market is segmented into genetic engineering, molecular breeding, genomic selection and marker-assisted breeding, gene-editing technologies, and others. in 2026, the genetic engineering segment is expected to dominate the market with a 34.68% share, driven by its widespread application in crop trait enhancement, pest and disease resistance, herbicide tolerance, and yield improvement. Strong adoption across commercial seed producers, large agribusinesses, and research institutions, supported by proven efficacy, scalability for large-scale cultivation, and relatively predictable development pathways, continues to reinforce the segment’s leadership in North America.
The gene-editing technologies segment is expected to be the fastest-growing, registering a CAGR of 11.8% in the North America agritech market. Growth is driven by increasing demand for precision breeding, faster trait development cycles, and targeted genetic improvements that address climate resilience, nutrient efficiency, and crop quality. Rising adoption of CRISPR and next-generation editing platforms, combined with supportive research funding, advancing regulatory clarity, and integration with genomic data and AI-driven breeding tools, is expected to further accelerate market expansion across key agricultural regions in North America.
- By Technology
On the basis of technology, the North America agritech market is segmented into internet of Things (IoT), Artificial intelligence (AI), Big Data & Analytics, Remote Sensing, Blockchain, and others. in 2026, the IoT segment is expected to dominate the market with a 38.14% share, driven by its broad applicability across farm monitoring, irrigation control, soil sensing, equipment tracking, and livestock management. Ease of deployment, scalability, real-time data collection, and relatively low operating and maintenance costs, combined with widespread integration across large, medium, and small farms, contribute to IoT’s leading position in the regional agritech landscape.
The Artificial intelligence (AI) segment is expected to be the fastest-growing, registering a CAGR of 11.7% in the North America agritech market. Growth is driven by rising demand for advanced decision-support systems, predictive analytics, and automated insights that enable yield forecasting, pest and disease prediction, input optimization, and precision resource allocation. increasing adoption of machine learning models, computer vision, and AI-powered robotics, along with integration into existing IoT and remote sensing platforms, is further accelerating AI adoption across North American agricultural operations.
- By Application
On the basis of application, the North America agritech market is segmented into crop monitoring, irrigation management, field mapping, soil management, weather prediction, livestock monitoring, supply chain management, and others. in 2026, the crop monitoring segment is expected to dominate the market with a 20.52% share, driven by its ease of deployment, real-time insights, and high impact on yield optimization and risk mitigation. Widespread adoption of remote sensing, drones, satellite imagery, and AI-based analytics across large and mid-sized farms enables early detection of crop stress, pest infestations, nutrient deficiencies, and disease outbreaks, reinforcing the segment’s leadership across North America.
The livestock monitoring segment is expected to be the fastest-growing, registering a CAGR of 12.3% in the North America agritech market. Growth is driven by increasing demand for real-time animal health tracking, productivity monitoring, and welfare management across dairy, poultry, and livestock operations. Expanding adoption of wearable sensors, RFID tags, automated feeding systems, and data-driven herd management platforms, combined with continuous advancements in sensor accuracy, connectivity, and automation, is accelerating market penetration across key agricultural regions in North America.
- By Farm Size
On the basis of farm size, the North America agritech market is segmented into large farms, medium farms, and small farms. in 2026, the large farms segment is expected to dominate the market with a 47.68% share, driven by high demand for advanced, data-intensive, and cost-efficient agritech solutions that support precision farming, large-scale crop monitoring, automated machinery, and resource optimization. Widespread adoption of GPS-guided equipment, AI-enabled analytics, smart irrigation systems, and integrated farm management platforms, coupled with continuous advancements in automation, connectivity, and real-time decision support, reinforces the segment’s leadership across North America.
The small farms segment is expected to be the fastest-growing, registering a CAGR of 11.6% in the North America agritech market. Growth is driven by increasing demand for affordable, scalable, and easy-to-use agritech solutions that improve productivity, crop health monitoring, and input efficiency. Expanding access to mobile-based advisory platforms, low-cost sensors, digital marketplaces, and government-supported adoption programs, along with simplified deployment and minimal maintenance requirements, is accelerating adoption across small and mid-scale farming communities throughout the region..
- By End User
On the basis of end user, the North America agritech market is segmented into individual farmers, corporate agribusinesses, agricultural cooperatives, government & NGO initiatives, research organizations, and others. in 2026, the individual farmers segment is expected to dominate the market with an 11.2% share, driven by increasing adoption of agritech solutions for day-to-day farm operations, crop monitoring, soil analysis, irrigation management, and yield optimization. Ease of use, reliable performance, affordability, and low maintenance requirements, combined with growing demand for compact, mobile, and user-friendly digital farming tools, support the segment’s leadership across both rural and semi-urban farming regions.
The government & NGO initiatives segment is expected to be the fastest-growing, registering a CAGR of 11.8% in the North America Agritech market. Growth is driven by expanding deployment of agritech solutions through smart agriculture programs, sustainability initiatives, climate-resilient farming projects, and farmer outreach schemes. increasing focus on resource efficiency, early risk detection (climate, pests, and soil degradation), and data-driven decision-making, along with the adoption of scalable, easy-to-deploy, and low-maintenance technologies, is accelerating market penetration across key agricultural regions in North America.
- By Distribution Channel
On the basis of distribution channel, the North America agritech market is segmented into direct and indirect channels. in 2026, the indirect segment is expected to dominate the market with a 56.89% share, driven by widespread adoption of agritech solutions through dealers, distributors, agricultural cooperatives, equipment retailers, and agribusiness partners. Key factors such as ease of deployment, technical support availability, after-sales services, financing options, and cost efficiency, combined with strong dealer networks and government-supported agricultural programs, support the segment’s leadership across the region.
The indirect channel is also expected to be the fastest-growing segment, registering a CAGR of 11.5% in the North America agritech market. Growth is driven by increasing penetration of agritech solutions across commercial farms, mid-sized operations, and smallholder farms, supported by expanding private agri-distributor networks, digital marketplaces, and public–private partnerships. Rising emphasis on operational efficiency, scalable farm technologies, and user-friendly solutions, along with improved access to training and financing, continues to accelerate adoption across key agricultural regions in North America.
North America Agritech Market Regional Analysis
- The U.S. is expected to dominate the North America agritech market, accounting for the largest revenue share of 77.83% in 2026, supported by significant investments in digital agriculture, precision farming infrastructure, and agri-tech innovation ecosystems. High adoption of AI-driven farm management platforms, GPS-enabled machinery, smart irrigation systems, and automation technologies, along with strong participation from agribusinesses and agri-tech startups, continues to strengthen the U.S. market position across large-scale and commercial farming operations.
- Canada is expected to be the fastest-growing market in the North America agritech sector, registering a CAGR of 12.0% during the forecast period. Growth is driven by increasing adoption of precision agriculture tools, climate-resilient farming practices, smart greenhouses, and data-driven crop management solutions, supported by favorable government policies, sustainability initiatives, and rising awareness of resource-efficient farming.
- Additionally, sustained focus on cost-effective, scalable, and easy-to-deploy agritech solutions, combined with investments in digital farm platforms, real-time data integration, automation, and sustainable agricultural technologies, is expected to support long-term market expansion across both commercial and mid-scale farms throughout North America
Canada Agritech Market insight
The Canada agritech market is experiencing steady growth, driven by increasing adoption of precision agriculture, smart irrigation systems, digital farm management platforms, and climate-resilient farming technologies. Strong government support for sustainable agriculture, rising awareness of resource efficiency, and the modernization of farming practices across crop production, horticulture, and greenhouse farming are improving adoption rates. Additionally, growing use of data analytics, IoT-enabled sensors, automation, and connectivity-driven farm solutions continues to strengthen Canada’s position within the North America Agritech market, particularly in addressing labor shortages, yield optimization, and environmental sustainability.
Mexico Agritech Market insight
The Mexico agritech market is expected to expand steadily, supported by increasing focus on agricultural productivity, food security, and modernization of farming operations. Rising adoption of precision farming tools, smart irrigation technologies, and digital advisory platforms, along with expanding access to agritech solutions through cooperatives, agribusiness partnerships, and direct-to-farm distribution models, is supporting market development. Furthermore, growing emphasis on cost-effective, scalable, and easy-to-deploy agritech solutions is driving sustained adoption across both commercial farms and small-to-mid-sized agricultural operations, particularly in water-stressed and high-value crop regions.
The Major Market Leaders Operating in the Market Are:
- Bayer AG (Germany)
- CNH industrial N.V. (U.K.)
- AGCO Corporation (U.S.)
- Deere & Company (U.S.)
- Syngenta (Switzerland)
- Yara (Norway)
- CropX inc. (U.S.)
- Ag Leader Technology (U.S.)
- Corteva (U.S.)
- FARMERS EDGE (Corvian) (Canada)
- The Weather Company LLC (U.S.)
- TOPCON AGRICULTURE (U.S.)
- Cropin Technology Solutions Private Limited (india)
- XAG Co., Ltd. (China)
- DJI (China)
- Taranis (U.S.)
- JIYI ROBOTICS (China)
Latest Developments in North America Agritech Market
- In February 2024, CNH industrial has taken a minority stake in Bem Agro, a startup using AI and drone imaging to generate detailed agronomic maps that help farmers optimize operations, reduce costs, and improve yields. This investment strengthens CNH’s precision agriculture solutions, enhances the Case IH and New Holland digital platforms, and expands the company’s presence in AgTech innovation across Latin America and the Asia Pacific region.
- In March 2025, DJI Agriculture partnered with Siam Kubota Corporation to launch the Thailand Agricultural Drone Pilot Competition in the Northeast region, where the new innovative method of farming is growing. DJI aimed at accelerating the adoption of precision farming equipment and elevating operators’ technical expertise.
- In August 2025 – Cropin secured a €700,000 AI deal under the EIT Food Impact Funding Framework to scale regenerative potato farming practices across Europe. The initiative, called FIRST Potato, will deploy Cropin’s AI decision-support tools to pilot regenerative farming methods on farms in Denmark, Germany, and the UK. The project combines satellite data, IoT, weather feeds, and predictive analytics to help farmers adopt climate-smart practices that improve soil health and yields while supporting corporate sustainability goals.
- In October 2025, Syngenta Crop Protection and Taranis announced they are formalizing their successful collaboration into a strategic partnership across the Midwest. The partnership will equip agricultural retailers with AI-powered crop management solutions, delivering innovative digital technologies that create significant value for both retailers and their grower customers.
- In November 2025 – Topcon Agriculture named Precision Ag Solved (PAS) as a new master dealer to expand its agricultural product territory in the western United States. PAS will provide sales, support, inventory, and training for Topcon’s precision agriculture solutions across the region. This strengthens local service capability and improves customer access to precision farming tools
SKU-

- Interactive Data Analysis Dashboard
- Company Analysis Dashboard for high growth potential opportunities
- Research Analyst Access for customization & queries
- Competitor Analysis with Interactive dashboard
- Latest News, Updates & Trend analysis
- Harness the Power of Benchmark Analysis for Comprehensive Competitor Tracking
Table of Content
1 INTRODUCTION
1.1 OBJECTIVES OF THE STUDY
1.2 MARKET DEFINITION
1.3 OVERVIEW OF NORTH AMERICA AGRITECH MARKET
1.4 LIMITATIONS
1.5 MARKETS COVERED
2 MARKET SEGMENTATION
2.1 MARKETS COVERED
2.2 GEOGRAPHICAL SCOPE
2.3 YEARS CONSIDERED FOR THE STUDY
2.4 CURRENCY AND PRICING
2.5 DBMR TRIPOD DATA VALIDATION MODEL
2.6 MULTIVARIATE MODELLING
2.7 PRIMARY INTERVIEWS WITH KEY OPINION LEADERS
2.8 DBMR MARKET POSITION GRID
2.9 MARKET END USER COVERAGE GRID
2.1 VENDOR SHARE ANALYSIS
2.11 SECONDARY SOURCES
2.12 ASSUMPTIONS
3 EXECUTIVE SUMMARY
4 PREMIUM INSIGHTS
4.1 ROLE OF CORPORATIONS, INVESTORS, AND STARTUPS
4.1.1 HOW NORTH AMERICA CORPORATIONS (DEERE & CO., CNH INDUSTRIAL, CORTEVA, BAYER) ARE DRIVING DIGITAL TRANSFORMATION
4.1.2 ROLE OF STRATEGIC INVESTORS AND VENTURE CAPITAL IN FUNDING INNOVATION
4.1.3 KEY M&A AND FUNDING TRENDS IN AGRITECH
4.2 BARRIERS TO ENTRY
4.2.1 TECHNOLOGICAL COMPLEXITY
4.2.2 CAPITAL REQUIREMENTS AND ROI CHALLENGES
4.2.3 POLICY AND REGULATORY BARRIERS (DATA USAGE, BIOTECH APPROVAL, DRONE REGULATIONS)
4.2.4 MARKET ADOPTION BARRIERS (FARMER AWARENESS, RURAL INFRASTRUCTURE)
4.3 RAW MATERIAL COVERAGE — NORTH AMERICA AGRITECH MARKET
4.3.1 ELECTRONIC COMPONENTS AND SEMICONDUCTORS
4.3.2 PRECISION SENSOR MATERIALS
4.3.3 STRUCTURAL ALLOYS AND COMPOSITES
4.3.4 ENERGY STORAGE AND POWER MATERIALS
4.3.5 BIOLOGICAL INPUTS AND AGROCHEMICAL RAWS
4.3.6 NETWORKING, COMMUNICATION AND CONNECTIVITY MATERIALS
4.3.7 SOFTWARE PLATFORM INFRASTRUCTURE MATERIALS
4.3.8 QUALITY, COMPLIANCE AND TRACEABILITY
4.4 BRAND OUTLOOK — NORTH AMERICA AGRITECH MARKET
4.4.1 BRAND COMPARATIVE ANALYSIS OF KEY NORTH AMERICA AGRITECH PLAYERS
4.4.2 PRODUCT VS BRAND OVERVIEW
4.4.3 PRODUCT OVERVIEW
4.4.4 BRAND OVERVIEW
4.5 CONSUMER BUYING BEHAVIOUR
4.5.1 PRODUCT EFFECTIVENESS & YIELD IMPROVEMENT
4.5.2 COST SENSITIVITY & RETURN ON INVESTMENT (ROI)
4.5.3 EASE OF USE & ADOPTION
4.5.4 TECHNOLOGY RELIABILITY & ACCURACY
4.5.5 ACCESS TO FINANCING & SUBSIDIES
4.5.6 AFTER-SALES SUPPORT & SERVICE
4.5.7 BRAND REPUTATION & TRUST
4.5.8 SUSTAINABILITY & ENVIRONMENTAL IMPACT
4.5.9 CUSTOMIZATION & SCALABILITY
4.5.10 DIGITAL CONNECTIVITY & DATA INSIGHTS
4.5.11 AVAILABILITY & DISTRIBUTION REACH
4.5.12 CONCLUSION
4.6 VENDOR SELECTION CRITERIA
4.6.1 QUALITY AND CERTIFICATION STANDARDS
4.6.2 TECHNICAL AND FUNCTIONAL COMPLIANCE
4.6.3 FINANCIAL AND OPERATIONAL STABILITY
4.6.4 SUSTAINABILITY AND RISK ASSESSMENT
4.7 TECHNOLOGY ADVANCEMENT, ADOPTION AND IMPLEMENTATION OUTLOOK
4.7.1 TECHNOLOGY ADVANCEMENT
4.7.2 TECHNOLOGY ADOPTION LANDSCAPE
4.7.2.1 OVERVIEW OF CURRENT ADOPTION RATES OF MAJOR AGRITECH SOLUTIONS
4.7.2.2 REGIONAL COMPARISON
4.7.2.3 ADOPTION TRENDS BY FARM TYPE AND SIZE
4.7.3 PRACTICAL STRATEGIES TO IMPROVE TECHNOLOGY UPTAKE
4.7.3.1 CAPACITY-BUILDING AND FARMER TRAINING PROGRAMS
4.7.3.2 PARTNERSHIPS BETWEEN TECHNOLOGY PROVIDERS AND AGRICULTURAL EXTENSION AGENCIES
4.7.3.3 PILOT PROJECTS SHOWCASING ROI AND EFFICIENCY GAINS
4.7.4 KEY BARRIERS TO ADOPTION
4.7.4.1 HIGH UPFRONT INVESTMENT COSTS AND LACK OF FINANCING
4.7.4.2 LIMITED TECHNICAL KNOWLEDGE AMONG FARMERS
4.7.4.3 POOR CONNECTIVITY/INFRASTRUCTURE IN RURAL AREAS
4.8 VALUE CHAIN ANALYSIS
4.8.1 RAW MATERIAL & FEEDSTOCK SUPPLY (5%–10%)
4.8.2 MANUFACTURING & PROCESSING (15%–25%)
4.8.3 DISTRIBUTION & LOGISTICS (30%–40%)
4.8.4 END-USE INDUSTRIES & SALES CHANNELS (10%–20%)
4.8.5 CONCLUSION
4.9 PORTER’S FIVE FORCES ANALYSIS – NORTH AMERICA AGRITECH MARKET
4.9.1 BARGAINING POWER OF BUYERS (HIGH)
4.9.2 THREAT OF NEW ENTRANTS (LOW TO MODERATE)
4.9.3 THREAT OF SUBSTITUTE PRODUCTS (MODERATE TO HIGH)
4.9.4 BARGAINING POWER OF SUPPLIERS (MODERATE)
4.9.5 INTENSITY OF COMPETITIVE RIVALRY (HIGH)
4.9.6 CONCLUSION:-
4.1 INNOVATION TRACKER AND STRATEGIC ANALYSIS
4.10.1 MAJOR DEALS AND STRATEGIC ALLIANCES ANALYSIS
4.10.1.1 JOINT VENTURES
4.10.1.2 MERGERS AND ACQUISITIONS
4.10.1.3 LICENSING AND PARTNERSHIP
4.10.1.4 TECHNOLOGY COLLABORATIONS
4.10.1.5 STRATEGIC DIVESTMENTS.
4.10.2 NUMBER OF PRODUCTS IN DEVELOPMENT
4.10.3 STAGE OF DEVELOPMENT
4.10.4 TIMELINES AND MILESTONES
4.10.5 INNOVATION STRATEGIES AND METHODOLOGIES
4.10.6 FUTURE OUTLOOK
4.11 PRICING ANALYSIS
4.11.1 AGRICULTURAL DRONES
4.11.2 SOIL MONITORING DEVICES AND PH SENSORS
4.11.3 FARM MANAGEMENT SOFTWARE
4.12 IRRIGATION AND SMART WATER MANAGEMENT SYSTEMS
4.13 SUPPLY CHAIN ANALYSIS – NORTH AMERICA AGRITECH MARKET
4.13.1 OVERVIEW OF AGRITECH AND SUPPLY CHAIN INTEGRATION
4.13.2 TECHNOLOGIES SUPPORTING SUPPLY CHAIN OPTIMIZATION
4.13.3 IMPORTANCE OF LOGISTIC SERVICE PROVIDERS
4.13.4 FOCUS ON RESILIENCE AND RISK MITIGATION
4.13.5 CHALLENGES AND FUTURE OPPORTUNITIES
4.13.6 CONCLUSION
4.14 BROADER INDUSTRY CHALLENGES
4.14.1 CLIMATE CHANGE SCENARIO
4.14.1.1 ENVIRONMENTAL CONCERNS
4.14.1.1.1 EFFECTS ON CROP YIELDS
4.14.1.1.2 SOIL HEALTH CONCERNS
4.14.1.1.3 WATER AVAILABILITY
4.14.1.2 ADAPTION STRATEGIES
4.14.1.2.1 PRECISION AGRICULTURE
4.14.1.2.2 DROUGHT-RESISTANT CROPS
4.14.1.2.3 CARBON FARMING
4.14.1.3 GOVERNMENT’S ROLE
4.14.1.3.1 POLICY DEVELOPMENT AND LEGISLATION
4.14.1.3.2 FUNDING AND RESEARCH INVESTMENT
4.14.1.3.3 REGULATION AND RISK MANAGEMENT
4.14.1.3.4 INTERNATIONAL COLLABORATION AND SUPPORT FOR DEVELOPING COUNTRIES
4.14.1.3.5 PROMOTING SUSTAINABLE PRACTICES THROUGH EDUCATION AND EXTENSION SERVICES
4.14.1.3.6 CARBON FARMING AND EMISSION REDUCTION POLICIES
4.14.2 RESOURCE SCARCITY
4.14.2.1 LAND DEGRADATION, WATER SCARCITY, AND FERTILIZER CONSTRAINTS
4.14.2.2 ROLE OF TECHNOLOGY IN OPTIMIZING INPUT USAGE
4.14.2.2.1 PRECISION AGRICULTURE
4.14.2.2.2 SMART IRRIGATION SYSTEMS
4.14.2.2.3 FERTILIZER MANAGEMENT TECHNOLOGY
4.14.2.2.4 BIOTECHNOLOGICAL ADVANCES IN CROP DEVELOPMENT
4.14.2.2.5 REGENERATIVE AGRICULTURE AND CARBON FARMING TECHNOLOGIES
4.14.3 GEOPOLITICAL DISRUPTIONS
4.14.3.1 IMPACTS OF TRADE RESTRICTIONS, WARS, AND SUPPLY CHAIN INSTABILITY
4.14.3.2 GROWING IMPORTANCE OF LOCAL PRODUCTION, FOOD SOVEREIGNTY, AND DIGITAL TRACEABILITY.
4.14.4 ECONOMIC VOLATILITY
4.14.4.1 FLUCTUATING COMMODITY PRICES AND INFLATIONARY PRESSURES
4.14.4.2 EVOLVING AGRICULTURAL SUBSIDIES AND GREEN FINANCING PROGRAMS
4.15 EMERGING OPPORTUNITIES
4.15.1 SUSTAINABILITY AND REGENERATIVE AGRICULTURE
4.15.1.1 INTEGRATION OF AGRITECH WITH CARBON FARMING, SOIL REGENERATION, AND BIODIVERSITY CONSERVATION
4.15.1.2 START-UPS AND INVESTORS FOCUSING ON SUSTAINABILITY-LINKED INNOVATION
4.15.2 DIGITALIZATION AND DATA-DRIVEN DECISIONS
4.15.2.1 GROWTH OF AI, MACHINE LEARNING, AND REMOTE SENSING IN FARMING OPERATIONS
4.15.2.2 CLOUD-BASED FARM MANAGEMENT PLATFORMS AND THEIR ROI
4.15.3 AGRI-FINTECH AND INCLUSIVE GROWTH
4.15.3.1 FINANCIAL INCLUSION THROUGH DIGITAL CREDIT, CROP INSURANCE, AND MOBILE PAYMENTS
4.15.3.2 EMPOWERMENT OF SMALLHOLDER FARMERS THROUGH PLATFORM-BASED AGRITECH ECOSYSTEMS
4.15.4 TECHNOLOGICAL ADVANCEMENTS
4.15.4.1 DIGITAL AGRICULTURE, AI-DRIVEN FARM ANALYTICS, IOT IN CROP MONITORING.
4.15.5 BIOTECHNOLOGY, GENE EDITING, AND ALTERNATIVE PROTEINS.
4.16 GO-TO-MARKET (GTM) STRATEGY IMPLICATIONS
4.16.1 COMMERCIALIZATION MODELS:
4.16.1.1 SEED LICENSING VS. IN-HOUSE SEED DEVELOPMENT.
4.16.1.2 PARTNERSHIPS WITH AGRIBUSINESS DISTRIBUTORS.
4.16.2 MARKET ENTRY STRATEGIES:
4.16.2.1 TARGETING EMERGING MARKETS WITH ADAPTABLE VARIETIES.
4.16.2.2 COLLABORATION WITH LOCAL R&D INSTITUTES.
4.16.3 VALUE CHAIN INTEGRATION—FROM RESEARCH TO FARMER ADOPTION
5 TARIFFS & IMPACT ON THE MARKET
5.1 CURRENT TARIFF RATE(S) IN TOP-5 COUNTRY MARKETS
5.2 OUTLOOK: LOCAL PRODUCTION VERSUS IMPORT RELIANCE
5.3 VENDOR SELECTION CRITERIA DYNAMICS
5.4 IMPACT ON SUPPLY CHAIN
5.4.1 RAW MATERIAL PROCUREMENT
5.4.2 MANUFACTURING AND PRODUCTION
5.4.3 LOGISTICS AND DISTRIBUTION
5.4.4 PRICE PITCHING AND MARKET POSITION
5.5 INDUSTRY PARTICIPANTS: PROACTIVE MOVES
5.5.1 SUPPLY CHAIN OPTIMIZATION
5.6 IMPACT ON PRICES
6 REGULATION COVERAGE
6.1 PRODUCT CODES
6.2 CERTIFIED STANDARDS
6.3 SAFETY STANDARDS
6.3.1 MATERIAL HANDLING & STORAGE
6.3.2 TRANSPORT & PRECAUTIONS
6.3.3 HAZARD IDENTIFICATION
7 MARKET OVERVIEW
7.1 DRIVERS
7.1.1 RISING ADOPTION OF PRECISION FARMING TECHNOLOGIES
7.1.2 GROWING PRESSURE TO IMPROVE AGRICULTURAL PRODUCTIVITY ON LIMITED ARABLE LAND
7.1.3 INCREASING DIGITALIZATION OF FARM OPERATIONS
7.1.4 RISING DEMAND FOR SUSTAINABLE AND RESOURCE-EFFICIENT FARMING PRACTICES
7.2 RESTRAINTS
7.2.1 HIGH INITIAL INVESTMENT AND TECHNOLOGY ADOPTION COSTS
7.2.2 LIMITED DIGITAL LITERACY IN RURAL FARMING COMMUNITIES
7.3 OPPORTUNITIES
7.3.1 EXPANSION OF AGRITECH SOLUTIONS IN EMERGING AGRICULTURAL ECONOMIES
7.3.2 GROWING INTEGRATION OF ARTIFICIAL INTELLIGENCE AND ANALYTICS IN AGRICULTURE
7.3.3 INCREASING DEMAND FOR CLIMATE-RESILIENT FARMING TECHNOLOGIES
7.4 CHALLENGES
7.4.1 FRAGMENTED FARM LANDHOLDINGS AND DIVERSE FARMING PRACTICES
7.4.2 DATA PRIVACY AND OWNERSHIP CONCERNS IN DIGITAL AGRICULTURE
8 NORTH AMERICA AGRITECH MARKET, BY PRODUCT TYPE
8.1 OVERVIEW
8.2 PRECISION FARMING EQUIPMENT
8.2.1 PRECISION FARMING EQUIPMENT IN AGRITECH MARKET, BY TYPE, 2018-2033 (USD THOUSAND)
8.2.1.1 GPS/GNSS DEVICES
8.2.1.2 SENSORS
8.2.1.3 SOIL MONITORING DEVICES
8.2.1.3.1 SOIL MONITORING DEVICES IN AGRITECH MARKET, BY TYPE, 2018-2033 (USD THOUSAND)
8.2.1.3.1.1 MOISTURE SENSORS
8.2.1.3.1.1.1 MOISTURE SENSORS IN AGRITECH MARKET, BY TYPE, 2018-2033 (USD THOUSAND)
8.2.1.3.1.1.1.1 CAPACITIVE
8.2.1.3.1.1.1.2 RESISTIVE
8.2.1.3.1.2 PH SENSORS
8.2.1.3.1.3 TEMPERATURE SENSORS
8.2.2 PRECISION FARMING EQUIPMENT IN AGRITECH MARKET BY REGION, 2018-2033 (USD THOUSAND)
8.2.2.1 NORTH AMERICA
8.2.2.2 EUROPE
8.2.2.3 ASIA-PACIFIC
8.2.2.4 SOUTH AMERICA
8.2.2.5 MIDDLE EAST AND AFRICA
8.3 FARM MANAGEMENT SOFTWARE
8.3.1 FARM MANAGEMENT SOFTWARE IN AGRITECH MARKET, BY TYPE, 2018-2033 (USD THOUSAND)
8.3.1.1 CLOUD-BASED FARM SOFTWARE
8.3.1.2 ENTERPRISE FARM SOFTWARE
8.3.1.3 ON-PREMISE SOFTWARE
8.3.2 FARM MANAGEMENT SOFTWARE IN AGRITECH MARKET BY REGION, 2018-2033 (USD THOUSAND)
8.3.2.1 NORTH AMERICA
8.3.2.2 EUROPE
8.3.2.3 ASIA-PACIFIC
8.3.2.4 SOUTH AMERICA
8.3.2.5 MIDDLE EAST AND AFRICA
8.4 SMART IRRIGATION SYSTEMS
8.4.1 SMART IRRIGATION SYSTEMS IN AGRITECH MARKET, BY TYPE, 2018-2033 (USD THOUSAND)
8.4.1.1 SOIL MOISTURE SENSORS
8.4.1.2 DRIP IRRIGATION CONTROLLERS
8.4.1.2.1 DRIP IRRIGATION CONTROLLERS IN AGRITECH MARKET, BY TYPE, 2018-2033 (USD THOUSAND)
8.4.1.2.1.1 AUTOMATED DRIP SYSTEMS
8.4.1.2.1.1.1 AUTOMATED DRIP SYSTEMS IN AGRITECH MARKET, BY TYPE, 2018-2033 (USD THOUSAND)
8.4.1.2.1.1.1.1 REMOTE-CONTROLLED
8.4.1.2.1.1.1.2 SENSOR-CONTROLLED
8.4.1.2.1.2 MANUAL DRIP SYSTEMS
8.4.1.3 SPRINKLER CONTROL SYSTEMS
8.4.2 SMART IRRIGATION SYSTEMS IN NORTH AMERICA FARM MANAGEMENT SOFTWARE IN AGRITECH MARKET BY REGION, 2018-2033 (USD THOUSAND)
8.4.2.1 NORTH AMERICA
8.4.2.2 EUROPE
8.4.2.3 ASIA-PACIFIC
8.4.2.4 SOUTH AMERICA
8.4.2.5 MIDDLE EAST AND AFRICA
8.5 AGRICULTURAL DRONES
8.5.1 AGRICULTURAL DRONES IN AGRITECH MARKET, BY TYPE, 2018-2033 (USD THOUSAND)
8.5.1.1 ROTARY WING DRONES
8.5.1.2 FIXED-WING DRONES
8.5.1.2.1 FIXED-WING DRONES IN AGRITECH MARKET, BY TYPE, 2018-2033 (USD THOUSAND)
8.5.1.2.1.1 MAPPING DRONES
8.5.1.2.1.2 SPRAYING DRONES
8.5.1.3 HYBRID DRONES (VTOL)
8.5.2 AGRICULTURAL DRONES IN AGRITECH MARKET BY REGION, 2018-2033 (USD THOUSAND)
8.5.2.1 NORTH AMERICA
8.5.2.2 EUROPE
8.5.2.3 ASIA-PACIFIC
8.5.2.4 SOUTH AMERICA
8.5.2.5 MIDDLE EAST AND AFRICA
8.6 OTHERS
8.6.1 OTHERS IN AGRITECH MARKET BY REGION, 2018-2033 (USD THOUSAND)
8.6.1.1 NORTH AMERICA
8.6.1.2 EUROPE
8.6.1.3 ASIA-PACIFIC
8.6.1.4 SOUTH AMERICA
8.6.1.5 MIDDLE EAST AND AFRICA
9 NORTH AMERICA AGRITECH MARKET, BY PLANT SCIENCE
9.1 OVERVIEW
9.2 GENETIC ENGINEERING
9.2.1 GENETIC ENGINEERING IN NORTH AMERICA AGRITECH MARKET, BY REGION, 2018-2033 (USD THOUSAND)
9.2.1.1 NORTH AMERICA
9.2.1.2 EUROPE
9.2.1.3 ASIA-PACIFIC
9.2.1.4 SOUTH AMERICA
9.2.1.5 MIDDLE EAST AND AFRICA
9.3 MOLECULAR BREEDING
9.3.1 MOLECULAR BREEDING IN NORTH AMERICA AGRITECH MARKET, BY REGION, 2018-2033 (USD THOUSAND)
9.3.1.1 NORTH AMERICA
9.3.1.2 EUROPE
9.3.1.3 ASIA-PACIFIC
9.3.1.4 SOUTH AMERICA
9.3.1.5 MIDDLE EAST AND AFRICA
9.4 GENOMIC SELECTION AND MARKER-ASSISTED BREEDING
9.4.1 GENOMIC SELECTION AND MARKER-ASSISTED BREEDING IN NORTH AMERICA AGRITECH MARKET, BY REGION, 2018-2033 (USD THOUSAND)
9.4.1.1 NORTH AMERICA
9.4.1.2 EUROPE
9.4.1.3 ASIA-PACIFIC
9.4.1.4 SOUTH AMERICA
9.4.1.5 MIDDLE EAST AND AFRICA
9.5 GENE-EDITING TECHNOLOGIES
9.5.1 GENE-EDITING TECHNOLOGIES IN NORTH AMERICA AGRITECH MARKET, BY REGION, 2018-2033 (USD THOUSAND)
9.5.1.1 NORTH AMERICA
9.5.1.2 EUROPE
9.5.1.3 ASIA-PACIFIC
9.5.1.4 SOUTH AMERICA
9.5.1.5 MIDDLE EAST AND AFRICA
9.6 OTHERS
9.6.1 OTHERS IN NORTH AMERICA AGRITECH MARKET, BY PLANT SCIENCE, 2018-2033 (USD THOUSAND)
9.6.1.1 NORTH AMERICA
9.6.1.2 EUROPE
9.6.1.3 ASIA-PACIFIC
9.6.1.4 SOUTH AMERICA
9.6.1.5 MIDDLE EAST AND AFRICA
10 NORTH AMERICA AGRITECH MARKET, BY TECHNOLOGY
10.1 OVERVIEW
10.2 INTERNET OF THINGS (IOT)
10.2.1 INTERNET OF THINGS (IOT) IN AGRITECH MARKET, BY TYPE, 2018-2033 (USD THOUSAND)
10.2.1.1 SMART SENSORS
10.2.1.2 CONNECTED DEVICES
10.2.2 INTERNET OF THINGS (IOT) IN AGRITECH MARKET, BY REGION, 2018-2033 (USD THOUSAND)
10.2.2.1 NORTH AMERICA
10.2.2.2 EUROPE
10.2.2.3 ASIA-PACIFIC
10.2.2.4 SOUTH AMERICA
10.2.2.5 MIDDLE EAST AND AFRICA
10.3 ARTIFICIAL INTELLIGENCE (AI)
10.3.1 ARTIFICIAL INTELLIGENCE (AI) IN AGRITECH MARKET, BY TYPE, 2018-2033 (USD THOUSAND)
10.3.1.1 MACHINE LEARNING PLATFORMS
10.3.1.2 COMPUTER VISION IN AGRICULTURE
10.3.2 ARTIFICIAL INTELLIGENCE (AI) IN NORTH AMERICA AGRITECH MARKET, BY REGION, 2018-2033 (USD THOUSAND)
10.3.2.1 NORTH AMERICA
10.3.2.2 EUROPE
10.3.2.3 ASIA-PACIFIC
10.3.2.4 SOUTH AMERICA
10.3.2.5 MIDDLE EAST AND AFRICA
10.4 BIG DATA & ANALYTICS
10.4.1 BIG DATA & ANALYTICS IN NORTH AMERICA AGRITECH MARKET, BY TYPE, 2018-2033 (USD THOUSAND)
10.4.1.1 CROP MONITORING TOOLS
10.4.1.2 YIELD MAPPING SOFTWARE
10.4.2 BIG DATA & ANALYTICS IN NORTH AMERICA AGRITECH MARKET, BY REGION, 2018-2033 (USD THOUSAND)
10.4.2.1 NORTH AMERICA
10.4.2.2 EUROPE
10.4.2.3 ASIA-PACIFIC
10.4.2.4 SOUTH AMERICA
10.4.2.5 MIDDLE EAST AND AFRICA
10.5 REMOTE SENSING
10.5.1 REMOTE SENSING IN NORTH AMERICA AGRITECH MARKET, BY REGION, 2018-2033 (USD THOUSAND)
10.5.1.1 NORTH AMERICA
10.5.1.2 EUROPE
10.5.1.3 ASIA-PACIFIC
10.5.1.4 SOUTH AMERICA
10.5.1.5 MIDDLE EAST AND AFRICA
10.6 BLOCKCHAIN
10.6.1 BLOCKCHAIN IN NORTH AMERICA AGRITECH MARKET, BY REGION, 2018-2033 (USD THOUSAND)
10.6.1.1 NORTH AMERICA
10.6.1.2 EUROPE
10.6.1.3 ASIA-PACIFIC
10.6.1.4 SOUTH AMERICA
10.6.1.5 MIDDLE EAST AND AFRICA
10.7 OTHERS
10.7.1 OTHERS IN NORTH AMERICA FARM MANAGEMENT SOFTWARE IN AGRITECH MARKET BY REGION, 2018-2033 (USD THOUSAND)
10.7.1.1 NORTH AMERICA
10.7.1.2 EUROPE
10.7.1.3 ASIA-PACIFIC
10.7.1.4 SOUTH AMERICA
10.7.1.5 MIDDLE EAST AND AFRICA
11 NORTH AMERICA AGRITECH MARKET, BY APPLICATION
11.1 OVERVIEW
11.2 CROP MONITORING
11.2.1 CROP MONITORING IN NORTH AMERICA AGRITECH MARKET, BY REGION, 2018-2033 (USD THOUSAND)
11.2.1.1 NORTH AMERICA
11.2.1.2 EUROPE
11.2.1.3 ASIA-PACIFIC
11.2.1.4 SOUTH AMERICA
11.2.1.5 MIDDLE EAST AND AFRICA
11.3 IRRIGATION MANAGEMENT
11.3.1 IRRIGATION MANAGEMENT IN NORTH AMERICA AGRITECH MARKET, BY REGION, 2018-2033 (USD THOUSAND)
11.3.1.1 NORTH AMERICA
11.3.1.2 EUROPE
11.3.1.3 ASIA-PACIFIC
11.3.1.4 SOUTH AMERICA
11.3.1.5 MIDDLE EAST AND AFRICA
11.4 FIELD MAPPING
11.4.1 FIELD MAPPING IN NORTH AMERICA AGRITECH MARKET, BY REGION, 2018-2033 (USD THOUSAND)
11.4.1.1 NORTH AMERICA
11.4.1.2 EUROPE
11.4.1.3 ASIA-PACIFIC
11.4.1.4 SOUTH AMERICA
11.4.1.5 MIDDLE EAST AND AFRICA
11.5 SOIL MANAGEMENT
11.5.1 SOIL MANAGEMENT IN NORTH AMERICA AGRITECH MARKET, BY REGION, 2018-2033 (USD THOUSAND)
11.5.2 NORTH AMERICA
11.5.3 EUROPE
11.5.4 ASIA-PACIFIC
11.5.5 SOUTH AMERICA
11.5.6 MIDDLE EAST AND AFRICA
11.6 WEATHER PREDICTION
11.6.1 WEATHER PREDICTION IN NORTH AMERICA AGRITECH MARKET, BY REGION, 2018-2033 (USD THOUSAND)
11.6.1.1 NORTH AMERICA
11.6.1.2 EUROPE
11.6.1.3 ASIA-PACIFIC
11.6.1.4 SOUTH AMERICA
11.6.1.5 MIDDLE EAST AND AFRICA
11.7 LIVESTOCK MONITORING
11.7.1 LIVESTOCK MONITORING IN AGRITECH MARKET, BY TYPE, 2018-2033 (USD THOUSAND)
11.7.1.1 RFID-BASED TRACKING
11.7.1.2 HEALTH MONITORING
11.7.2 LIVESTOCK MONITORING IN NORTH AMERICA AGRITECH MARKET, BY REGION, 2018-2033 (USD THOUSAND)
11.7.2.1 NORTH AMERICA
11.7.2.2 EUROPE
11.7.2.3 ASIA-PACIFIC
11.7.2.4 SOUTH AMERICA
11.7.2.5 MIDDLE EAST AND AFRICA
11.8 SUPPLY CHAIN MANAGEMENT
11.8.1 SUPPLY CHAIN MANAGEMENT IN NORTH AMERICA AGRITECH MARKET, BY REGION, 2018-2033 (USD THOUSAND)
11.8.1.1 NORTH AMERICA
11.8.1.2 EUROPE
11.8.1.3 ASIA-PACIFIC
11.8.1.4 SOUTH AMERICA
11.8.1.5 MIDDLE EAST AND AFRICA
11.9 OTHERS
11.9.1 OTHERS IN NORTH AMERICA AGRITECH MARKET, BY REGION, 2018-2033 (USD THOUSAND)
11.9.1.1 NORTH AMERICA
11.9.1.2 EUROPE
11.9.1.3 ASIA-PACIFIC
11.9.1.4 SOUTH AMERICA
11.9.1.5 MIDDLE EAST AND AFRICA
12 NORTH AMERICA AGRITECH MARKET, BY FARM SIZE
12.1 OVERVIEW
12.2 LARGE FARMS
12.2.1 LARGE FARMS IN NORTH AMERICA AGRITECH MARKET, BY REGION, 2018-2033 (USD THOUSAND)
12.2.1.1 NORTH AMERICA
12.2.1.2 EUROPE
12.2.1.3 ASIA-PACIFIC
12.2.1.4 SOUTH AMERICA
12.2.1.5 MIDDLE EAST AND AFRICA
12.3 MEDIUM FARMS
12.3.1 MEDIUM FARMS IN NORTH AMERICA AGRITECH MARKET, BY REGION, 2018-2033 (USD THOUSAND)
12.3.1.1 NORTH AMERICA
12.3.1.2 EUROPE
12.3.1.3 ASIA-PACIFIC
12.3.1.4 SOUTH AMERICA
12.3.1.5 MIDDLE EAST AND AFRICA
12.4 SMALL FARMS
12.4.1 SMALL FARMS IN NORTH AMERICA AGRITECH MARKET, BY REGION, 2018-2033 (USD THOUSAND)
12.4.1.1 NORTH AMERICA
12.4.1.2 EUROPE
12.4.1.3 ASIA-PACIFIC
12.4.1.4 SOUTH AMERICA
12.4.1.5 MIDDLE EAST AND AFRICA
13 NORTH AMERICA AGRITECH MARKET, BY END USER
13.1 OVERVIEW
13.2 INDIVIDUAL FARMERS
13.2.1 INDIVIDUAL FARMERS IN NORTH AMERICA AGRITECH MARKET, BY REGION, 2018-2033 (USD THOUSAND)
13.2.1.1 NORTH AMERICA
13.2.1.2 EUROPE
13.2.1.3 ASIA-PACIFIC
13.2.1.4 SOUTH AMERICA
13.2.1.5 MIDDLE EAST AND AFRICA
13.3 CORPORATE AGRIBUSINESSES
13.3.1 CORPORATE AGRIBUSINESSES IN NORTH AMERICA AGRITECH MARKET, BY REGION, 2018-2033 (USD THOUSAND)
13.3.1.1 NORTH AMERICA
13.3.1.2 EUROPE
13.3.1.3 ASIA-PACIFIC
13.3.1.4 SOUTH AMERICA
13.3.1.5 MIDDLE EAST AND AFRICA
13.4 AGRICULTURAL COOPERATIVES
13.4.1 AGRICULTURAL COOPERATIVES IN NORTH AMERICA AGRITECH MARKET, BY REGON, 2018-2033 (USD THOUSAND)
13.4.1.1 NORTH AMERICA
13.4.1.2 EUROPE
13.4.1.3 ASIA-PACIFIC
13.4.1.4 SOUTH AMERICA
13.4.1.5 MIDDLE EAST AND AFRICA
13.5 GOVERNMENT & NGO INITIATIVES
13.5.1 GOVERNMENT & NGO INITIATIVES IN NORTH AMERICA AGRITECH MARKET, BY REGION, 2018-2033 (USD THOUSAND)
13.5.1.1 NORTH AMERICA
13.5.1.2 EUROPE
13.5.1.3 ASIA-PACIFIC
13.5.1.4 SOUTH AMERICA
13.5.1.5 MIDDLE EAST AND AFRICA
13.6 RESEARCH ORGANIZATIONS
13.6.1 RESEARCH ORGANIZATIONS IN NORTH AMERICA AGRITECH MARKET, BY REGION, 2018-2033 (USD THOUSAND)
13.6.1.1 NORTH AMERICA
13.6.1.2 EUROPE
13.6.1.3 ASIA-PACIFIC
13.6.1.4 SOUTH AMERICA
13.6.1.5 MIDDLE EAST AND AFRICA
13.7 OTHERS
13.7.1 OTHERS IN NORTH AMERICA AGRITECH MARKET, BY REGION, 2018-2033 (USD THOUSAND)
13.7.1.1 NORTH AMERICA
13.7.1.2 EUROPE
13.7.1.3 ASIA-PACIFIC
13.7.1.4 SOUTH AMERICA
13.7.1.5 MIDDLE EAST AND AFRICA
14 NORTH AMERICA AGRITECH MARKET, BY DISTRIBUTION CHANNEL
14.1 OVERVIEW
14.2 INDIRECT
14.2.1 INDIRECT IN NORTH AMERICA AGRITECH MARKET, BY REGION, 2018-2033 (USD THOUSAND)
14.2.1.1 NORTH AMERICA
14.2.1.2 EUROPE
14.2.1.3 ASIA-PACIFIC
14.2.1.4 SOUTH AMERICA
14.2.1.5 MIDDLE EAST AND AFRICA
14.3 DIRECT
14.3.1 DIRECT IN NORTH AMERICA AGRITECH MARKET, BY REGION, 2018-2033 (USD THOUSAND)
14.3.1.1 NORTH AMERICA
14.3.1.2 EUROPE
14.3.1.3 ASIA-PACIFIC
14.3.1.4 SOUTH AMERICA
14.3.1.5 MIDDLE EAST AND AFRICA
15 NORTH AMERICA AGRITECH MARKET, BY REGION
15.1 NORTH AMERICA
15.1.1 U.S.
15.1.2 CANADA
15.1.3 MEXICO
16 NORTH AMERICA AGRITECH MARKET: COMPANY LANDSCAPE
16.1 MANUFACTURER COMPANY SHARE ANALYSIS: GLOBAL
17 SWOT ANALYSIS
18 COMPANY PROFILES
18.1 DEERE & COMPANY
18.1.1 COMPANY SNAPSHOT
18.1.2 REVENUE ANALYSIS
18.1.3 COMPANY SHARE ANALYSIS
18.1.4 PRODUCT PORTFOLIO
18.1.5 RECENT DEVELOPMENT
18.2 AGCO CORPORATION
18.2.1 COMPANY SNAPSHOT
18.2.2 REVENUE ANALYSIS
18.2.3 COMPANY SHARE ANALYSIS
18.2.4 PRODUCT PORTFOLIO
18.2.5 RECENT DEVELOPMENT
18.3 BAYER CROPSCIENCE
18.3.1 COMPANY SNAPSHOT
18.3.2 REVENUE ANALYSIS
18.3.3 COMPANY SHARE ANALYSIS
18.3.4 PRODUCT PORTFOLIO
18.3.5 RECENT DEVELOPMENT
18.4 SYNGENTA AG
18.4.1 COMPANY SNAPSHOT
18.4.2 COMPANY SHARE ANALYSIS
18.4.3 RODUCT PORTFOLIO
18.4.4 RECENT DEVELOPMENT
18.5 CNH INDUSTRIAL N.V.
18.5.1 COMPANY SNAPSHOT
18.5.2 REVENUE ANALYSIS
18.5.3 COMPANY SHARE ANALYSIS
18.5.4 BRAND PORTFOLIO
18.5.5 RECENT DEVELOPMENT
18.6 AG LEADER TECHNOLOGY
18.6.1 COMPANY SNAPSHOT
18.6.2 PRODUCT PORTFOLIO
18.6.3 RECENT DEVELOPMENT
18.7 CROPIN TECHNOLOGY SOLUTIONS PRIVATE LIMITED
18.7.1 COMPANY SNAPSHOT
18.7.2 PRODUCT/SERVICE PORTFOLIO
18.7.3 RECENT DEVELOPMENT
18.8 CORTEVA
18.8.1 COMPANY SNAPSHOT
18.8.2 REVENUE ANALYSIS
18.8.3 PRODUCT PORTFOLIO
18.8.4 RECENT DEVELOPMENT
18.9 CROPX INC.
18.9.1 COMPANY SNAPSHOT
18.9.2 PRODUCT PORTFOLIO
18.9.3 RECENT DEVELOPMENT
18.1 DJI
18.10.1 COMPANY SNAPSHOT
18.10.2 PRODUCT PORTFOLIO
18.10.3 RECENT DEVELOPMENT
18.11 FARMERS EDGE (CORVIAN)
18.11.1 COMPANY SNAPSHOT
18.11.2 PRODUCT/SERVICE PORTFOLIO
18.11.3 RECENT DEVELOPMENT
18.12 JIYI ROBOTICS
18.12.1 COMPANY SNAPSHOT
18.12.2 PRODUCT PORTFOLIO
18.12.3 RECENT DEVELOPMENT
18.13 TARANIS.
18.13.1 COMPANY SNAPSHOT
18.13.2 PRODUCT PORTFOLIO
18.13.3 RECENT DEVELOPMENT
18.14 TOPCON AGRICULTURE
18.14.1 COMPANY SNAPSHOT
18.14.2 PRODUCT/SERVICE PORTFOLIO
18.14.3 RECENT DEVELOPMENT
18.15 THE WEATHER COMPANY LLC
18.15.1 COMPANY SNAPSHOT
18.15.2 PRODUCT/SERVICE PORTFOLIO
18.15.3 RECENT DEVELOPMENT
18.16 XAG CO., LTD.
18.16.1 COMPANY SNAPSHOT
18.16.2 PRODUCT/SERVICE PORTFOLIO
18.16.3 RECENT DEVELOPMENT
18.17 YARA
18.17.1 COMPANY SNAPSHOT
18.17.2 REVENUE ANALYSIS
18.17.3 PRODUCT PORTFOLIO
18.17.4 RECENT DEVELOPMENT
19 QUESTIONNAIRE
20 RELATED REPORTS
List of Table
TABLE 1 STRATEGIC OVERVIEW OF COMPETITIVE FORCES IN THE NORTH AMERICA AGRITECH MARKET
TABLE 2 SUPPLY CHAIN ANALYSIS OF THE NORTH AMERICA AGRITECH MARKET
TABLE 3 NORTH AMERICA AGRITECH MARKET, BY PRODUCT TYPE, 2018-2033 (USD THOUSAND)
TABLE 4 NORTH AMERICA PRECISION FARMING EQUIPMENT IN AGRITECH MARKET, BY TYPE, 2018-2033 (USD THOUSAND)
TABLE 5 NORTH AMERICA SOIL MONITORING DEVICES IN AGRITECH MARKET, BY TYPE, 2018-2033 (USD THOUSAND)
TABLE 6 NORTH AMERICA MOISTURE SENSORS IN AGRITECH MARKET, BY TYPE, 2018-2033 (USD THOUSAND)
TABLE 7 PRECISION FARMING EQUIPMENT IN AGRITECH MARKET BY REGION, 2018-2033 (USD THOUSAND)
TABLE 8 NORTH AMERICA FARM MANAGEMENT SOFTWARE IN AGRITECH MARKET, BY TYPE, 2018-2033 (USD THOUSAND)
TABLE 9 FARM MANAGEMENT SOFTWARE IN AGRITECH MARKET BY REGION, 2018-2033 (USD THOUSAND)
TABLE 10 NORTH AMERICA SMART IRRIGATION SYSTEMS IN AGRITECH MARKET, BY TYPE, 2018-2033 (USD THOUSAND)
TABLE 11 NORTH AMERICA DRIP IRRIGATION CONTROLLERS IN AGRITECH MARKET, BY TYPE, 2018-2033 (USD THOUSAND)
TABLE 12 NORTH AMERICA AUTOMATED DRIP SYSTEMS IN AGRITECH MARKET, BY TYPE, 2018-2033 (USD THOUSAND)
TABLE 13 SMART IRRIGATION SYSTEMS IN NORTH AMERICA FARM MANAGEMENT SOFTWARE IN AGRITECH MARKET BY REGION, 2018-2033 (USD THOUSAND)
TABLE 14 NORTH AMERICA AGRICULTURAL DRONES IN AGRITECH MARKET, BY TYPE, 2018-2033 (USD THOUSAND)
TABLE 15 NORTH AMERICA FIXED-WING DRONES IN AGRITECH MARKET, BY TYPE, 2018-2033 (USD THOUSAND)
TABLE 16 AGRICULTURAL DRONES IN AGRITECH MARKET BY REGION, 2018-2033 (USD THOUSAND)
TABLE 17 OTHERS IN AGRITECH MARKET BY REGION, 2018-2033 (USD THOUSAND)
TABLE 18 NORTH AMERICA AGRITECH MARKET, BY PLANT SCIENCE, 2018-2033 (USD THOUSAND)
TABLE 19 GENETIC ENGINEERING IN NORTH AMERICA AGRITECH MARKET, BY REGION, 2018-2033 (USD THOUSAND)
TABLE 20 MOLECULAR BREEDING IN NORTH AMERICA AGRITECH MARKET, BY REGION, 2018-2033 (USD THOUSAND)
TABLE 21 GENOMIC SELECTION AND MARKER-ASSISTED BREEDING IN NORTH AMERICA AGRITECH MARKET, BY REGION, 2018-2033 (USD THOUSAND)
TABLE 22 GENE-EDITING TECHNOLOGIES IN NORTH AMERICA AGRITECH MARKET, BY REGION, 2018-2033 (USD THOUSAND)
TABLE 23 OTHERS IN NORTH AMERICA AGRITECH MARKET, BY PLANT SCIENCE, 2018-2033 (USD THOUSAND)
TABLE 24 NORTH AMERICA AGRITECH MARKET, BY TECHNOLOGY, 2018-2033 (USD THOUSAND)
TABLE 25 NORTH AMERICA INTERNET OF THINGS (IOT) IN AGRITECH MARKET, BY TYPE, 2018-2033 (USD THOUSAND)
TABLE 26 NORTH AMERICA INTERNET OF THINGS (IOT) IN AGRITECH MARKET, BY REGION, 2018-2033 (USD THOUSAND)
TABLE 27 NORTH AMERICA ARTIFICIAL INTELLIGENCE (AI) IN AGRITECH MARKET, BY TYPE, 2018-2033 (USD THOUSAND)
TABLE 28 ARTIFICIAL INTELLIGENCE (AI) IN NORTH AMERICA AGRITECH MARKET, BY REGION, 2018-2033 (USD THOUSAND)
TABLE 29 BIG DATA & ANALYTICS IN NORTH AMERICA AGRITECH MARKET, BY TYPE, 2018-2033 (USD THOUSAND)
TABLE 30 BIG DATA & ANALYTICS IN NORTH AMERICA AGRITECH MARKET, BY REGION, 2018-2033 (USD THOUSAND)
TABLE 31 REMOTE SENSING IN NORTH AMERICA AGRITECH MARKET, BY REGION, 2018-2033 (USD THOUSAND)
TABLE 32 BLOCKCHAIN IN NORTH AMERICA AGRITECH MARKET, BY REGION, 2018-2033 (USD THOUSAND)
TABLE 33 OTHERS IN NORTH AMERICA FARM MANAGEMENT SOFTWARE IN AGRITECH MARKET BY REGION, 2018-2033 (USD THOUSAND)
TABLE 34 NORTH AMERICA AGRITECH MARKET, BY APPLICATION, 2018-2033 (USD THOUSAND)
TABLE 35 CROP MONITORING IN NORTH AMERICA AGRITECH MARKET, BY REGION 2018-2033 (USD THOUSAND)
TABLE 36 IRRIGATION MANAGEMENT IN NORTH AMERICA AGRITECH MARKET, BY REGION, 2018-2033 (USD THOUSAND)
TABLE 37 FIELD MAPPING IN NORTH AMERICA AGRITECH MARKET, BY REGION, 2018-2033 (USD THOUSAND)
TABLE 38 SOIL MANAGEMENT IN NORTH AMERICA AGRITECH MARKET, BY REGION 2018-2033 (USD THOUSAND)
TABLE 39 WEATHER PREDICTION IN NORTH AMERICA AGRITECH MARKET, BY REGION 2018-2033 (USD THOUSAND)
TABLE 40 NORTH AMERICA LIVESTOCK MONITORING IN AGRITECH MARKET, BY TYPE, 2018-2033 (USD THOUSAND)
TABLE 41 LIVESTOCK MONITORING IN NORTH AMERICA AGRITECH MARKET, BY REGION 2018-2033 (USD THOUSAND)
TABLE 42 SUPPLY CHAIN MANAGEMENT IN NORTH AMERICA AGRITECH MARKET, BY REGION, 2018-2033 (USD THOUSAND)
TABLE 43 OTHERS IN NORTH AMERICA AGRITECH MARKET, BY REGION, 2018-2033 (USD THOUSAND)
TABLE 44 NORTH AMERICA AGRITECH MARKET, BY FARM SIZE, 2018-2033 (USD THOUSAND)
TABLE 45 LARGE FARMS IN NORTH AMERICA AGRITECH MARKET, BY REGION, 2018-2033 (USD THOUSAND)
TABLE 46 MEDIUM FARMS IN NORTH AMERICA AGRITECH MARKET, BY REGION, 2018-2033 (USD THOUSAND)
TABLE 47 SMALL FARMS IN NORTH AMERICA AGRITECH MARKET, BY REGION, 2018-2033 (USD THOUSAND)
TABLE 48 NORTH AMERICA AGRITECH MARKET, BY END USER, 2018-2033 (USD THOUSAND)
TABLE 49 INDIVIDUAL FARMERS IN NORTH AMERICA AGRITECH MARKET, BY REGION, 2018-2033 (USD THOUSAND)
TABLE 50 CORPORATE AGRIBUSINESSES IN NORTH AMERICA AGRITECH MARKET, BY REGION, 2018-2033 (USD THOUSAND)
TABLE 51 AGRICULTURAL COOPERATIVES IN NORTH AMERICA AGRITECH MARKET, BY REGION, 2018-2033 (USD THOUSAND)
TABLE 52 GOVERNMENT & NGO INITIATIVES IN NORTH AMERICA AGRITECH MARKET, BY REGION 2018-2033 (USD THOUSAND)
TABLE 53 RESEARCH ORGANIZATIONS IN NORTH AMERICA AGRITECH MARKET, BY REGION, 2018-2033 (USD THOUSAND)
TABLE 54 OTHERS IN NORTH AMERICA AGRITECH MARKET, BY REGION, 2018-2033 (USD THOUSAND)
TABLE 55 NORTH AMERICA AGRITECH MARKET, BY DISTRIBUTION CHANNEL, 2018-2033 (USD THOUSAND)
TABLE 56 INDIRECT IN NORTH AMERICA AGRITECH MARKET, BY REGION 2018-2033 (USD THOUSAND)
TABLE 57 DIRECT IN NORTH AMERICA AGRITECH MARKET, BY REGION, 2018-2033 (USD THOUSAND)
TABLE 58 NORTH AMERICA AGRITECH MARKET, BY COUNTRY, 2018-2033 (USD THOUSAND)
TABLE 59 NORTH AMERICA AGRITECH MARKET, BY PRODUCT TYPE, 2018-2033 (USD THOUSAND)
TABLE 60 NORTH AMERICA PRECISION FARMING EQUIPMENT IN AGRITECH MARKET, BY TYPE, 2018-2033 (USD THOUSAND)
TABLE 61 NORTH AMERICA SOIL MONITORING DEVICES IN AGRITECH MARKET, BY TYPE, 2018-2033 (USD THOUSAND)
TABLE 62 NORTH AMERICA MOISTURE SENSORS IN AGRITECH MARKET, BY TYPE, 2018-2033 (USD THOUSAND)
TABLE 63 NORTH AMERICA FARM MANAGEMENT SOFTWARE IN AGRITECH MARKET, BY TYPE, 2018-2033 (USD THOUSAND)
TABLE 64 NORTH AMERICA SMART IRRIGATION SYSTEMS IN AGRITECH MARKET, BY TYPE, 2018-2033 (USD THOUSAND)
TABLE 65 NORTH AMERICA DRIP IRRIGATION CONTROLLERS IN AGRITECH MARKET, BY TYPE, 2018-2033 (USD THOUSAND)
TABLE 66 NORTH AMERICA AUTOMATED DRIP SYSTEMS IN AGRITECH MARKET, BY TYPE, 2018-2033 (USD THOUSAND)
TABLE 67 NORTH AMERICA AGRICULTURAL DRONES IN AGRITECH MARKET, BY TYPE, 2018-2033 (USD THOUSAND)
TABLE 68 NORTH AMERICA FIXED-WING DRONES IN AGRITECH MARKET, BY TYPE, 2018-2033 (USD THOUSAND)
TABLE 69 NORTH AMERICA AGRITECH MARKET, BY PLANT SCIENCE, 2018-2033 (USD THOUSAND)
TABLE 70 NORTH AMERICA AGRITECH MARKET, BY TECHNOLOGY, 2018-2033 (USD THOUSAND)
TABLE 71 NORTH AMERICA INTERNET OF THINGS (IOT) IN AGRITECH MARKET, BY TYPE, 2018-2033 (USD THOUSAND)
TABLE 72 NORTH AMERICA ARTIFICIAL INTELLIGENCE (AI) IN AGRITECH MARKET, BY TYPE, 2018-2033 (USD THOUSAND)
TABLE 73 NORTH AMERICA BIG DATA & ANALYTICS IN AGRITECH MARKET, BY TYPE, 2018-2033 (USD THOUSAND)
TABLE 74 NORTH AMERICA AGRITECH MARKET, BY APPLICATION, 2018-2033 (USD THOUSAND)
TABLE 75 NORTH AMERICA LIVESTOCK MONITORING IN AGRITECH MARKET, BY TYPE, 2018-2033 (USD THOUSAND)
TABLE 76 NORTH AMERICA AGRITECH MARKET, BY FARM SIZE, 2018-2033 (USD THOUSAND)
TABLE 77 NORTH AMERICA AGRITECH MARKET, BY END USER, 2018-2033 (USD THOUSAND)
TABLE 78 NORTH AMERICA AGRITECH MARKET, BY DISTRIBUTION CHANNEL, 2018-2033 (USD THOUSAND)
TABLE 79 U.S. AGRITECH MARKET, BY PRODUCT TYPE, 2018-2033 (USD THOUSAND)
TABLE 80 U.S. PRECISION FARMING EQUIPMENT IN AGRITECH MARKET, BY TYPE, 2018-2033 (USD THOUSAND)
TABLE 81 U.S. SOIL MONITORING DEVICES IN AGRITECH MARKET, BY TYPE, 2018-2033 (USD THOUSAND)
TABLE 82 U.S. MOISTURE SENSORS IN AGRITECH MARKET, BY TYPE, 2018-2033 (USD THOUSAND)
TABLE 83 U.S. FARM MANAGEMENT SOFTWARE IN AGRITECH MARKET, BY TYPE, 2018-2033 (USD THOUSAND)
TABLE 84 U.S. SMART IRRIGATION SYSTEMS IN AGRITECH MARKET, BY TYPE, 2018-2033 (USD THOUSAND)
TABLE 85 U.S. DRIP IRRIGATION CONTROLLERS IN AGRITECH MARKET, BY TYPE, 2018-2033 (USD THOUSAND)
TABLE 86 U.S. AUTOMATED DRIP SYSTEMS IN AGRITECH MARKET, BY TYPE, 2018-2033 (USD THOUSAND)
TABLE 87 U.S. AGRICULTURAL DRONES IN AGRITECH MARKET, BY TYPE, 2018-2033 (USD THOUSAND)
TABLE 88 U.S. FIXED-WING DRONES IN AGRITECH MARKET, BY TYPE, 2018-2033 (USD THOUSAND)
TABLE 89 U.S. AGRITECH MARKET, BY PLANT SCIENCE, 2018-2033 (USD THOUSAND)
TABLE 90 U.S. AGRITECH MARKET, BY TECHNOLOGY, 2018-2033 (USD THOUSAND)
TABLE 91 U.S. INTERNET OF THINGS (IOT) IN AGRITECH MARKET, BY TYPE, 2018-2033 (USD THOUSAND)
TABLE 92 U.S. ARTIFICIAL INTELLIGENCE (AI) IN AGRITECH MARKET, BY TYPE, 2018-2033 (USD THOUSAND)
TABLE 93 U.S. BIG DATA & ANALYTICS IN AGRITECH MARKET, BY TYPE, 2018-2033 (USD THOUSAND)
TABLE 94 U.S. AGRITECH MARKET, BY APPLICATION, 2018-2033 (USD THOUSAND)
TABLE 95 U.S. LIVESTOCK MONITORING IN AGRITECH MARKET, BY TYPE, 2018-2033 (USD THOUSAND)
TABLE 96 U.S. AGRITECH MARKET, BY FARM SIZE, 2018-2033 (USD THOUSAND)
TABLE 97 U.S. AGRITECH MARKET, BY END USER, 2018-2033 (USD THOUSAND)
TABLE 98 U.S. AGRITECH MARKET, BY DISTRIBUTION CHANNEL, 2018-2033 (USD THOUSAND)
TABLE 99 CANADA AGRITECH MARKET, BY PRODUCT TYPE, 2018-2033 (USD THOUSAND)
TABLE 100 CANADA PRECISION FARMING EQUIPMENT IN AGRITECH MARKET, BY TYPE, 2018-2033 (USD THOUSAND)
TABLE 101 CANADA SOIL MONITORING DEVICES IN AGRITECH MARKET, BY TYPE, 2018-2033 (USD THOUSAND)
TABLE 102 CANADA MOISTURE SENSORS IN AGRITECH MARKET, BY TYPE, 2018-2033 (USD THOUSAND)
TABLE 103 CANADA FARM MANAGEMENT SOFTWARE IN AGRITECH MARKET, BY TYPE, 2018-2033 (USD THOUSAND)
TABLE 104 CANADA SMART IRRIGATION SYSTEMS IN AGRITECH MARKET, BY TYPE, 2018-2033 (USD THOUSAND)
TABLE 105 CANADA DRIP IRRIGATION CONTROLLERS IN AGRITECH MARKET, BY TYPE, 2018-2033 (USD THOUSAND)
TABLE 106 CANADA AUTOMATED DRIP SYSTEMS IN AGRITECH MARKET, BY TYPE, 2018-2033 (USD THOUSAND)
TABLE 107 CANADA AGRICULTURAL DRONES IN AGRITECH MARKET, BY TYPE, 2018-2033 (USD THOUSAND)
TABLE 108 CANADA FIXED-WING DRONES IN AGRITECH MARKET, BY TYPE, 2018-2033 (USD THOUSAND)
TABLE 109 CANADA AGRITECH MARKET, BY PLANT SCIENCE, 2018-2033 (USD THOUSAND)
TABLE 110 CANADA AGRITECH MARKET, BY TECHNOLOGY, 2018-2033 (USD THOUSAND)
TABLE 111 CANADA INTERNET OF THINGS (IOT) IN AGRITECH MARKET, BY TYPE, 2018-2033 (USD THOUSAND)
TABLE 112 CANADA ARTIFICIAL INTELLIGENCE (AI) IN AGRITECH MARKET, BY TYPE, 2018-2033 (USD THOUSAND)
TABLE 113 CANADA BIG DATA & ANALYTICS IN AGRITECH MARKET, BY TYPE, 2018-2033 (USD THOUSAND)
TABLE 114 CANADA AGRITECH MARKET, BY APPLICATION, 2018-2033 (USD THOUSAND)
TABLE 115 CANADA LIVESTOCK MONITORING IN AGRITECH MARKET, BY TYPE, 2018-2033 (USD THOUSAND)
TABLE 116 CANADA AGRITECH MARKET, BY FARM SIZE, 2018-2033 (USD THOUSAND)
TABLE 117 CANADA AGRITECH MARKET, BY END USER, 2018-2033 (USD THOUSAND)
TABLE 118 CANADA AGRITECH MARKET, BY DISTRIBUTION CHANNEL, 2018-2033 (USD THOUSAND)
TABLE 119 MEXICO AGRITECH MARKET, BY PRODUCT TYPE, 2018-2033 (USD THOUSAND)
TABLE 120 MEXICO PRECISION FARMING EQUIPMENT IN AGRITECH MARKET, BY TYPE, 2018-2033 (USD THOUSAND)
TABLE 121 MEXICO SOIL MONITORING DEVICES IN AGRITECH MARKET, BY TYPE, 2018-2033 (USD THOUSAND)
TABLE 122 MEXICO MOISTURE SENSORS IN AGRITECH MARKET, BY TYPE, 2018-2033 (USD THOUSAND)
TABLE 123 MEXICO FARM MANAGEMENT SOFTWARE IN AGRITECH MARKET, BY TYPE, 2018-2033 (USD THOUSAND)
TABLE 124 MEXICO SMART IRRIGATION SYSTEMS IN AGRITECH MARKET, BY TYPE, 2018-2033 (USD THOUSAND)
TABLE 125 MEXICO DRIP IRRIGATION CONTROLLERS IN AGRITECH MARKET, BY TYPE, 2018-2033 (USD THOUSAND)
TABLE 126 MEXICO AUTOMATED DRIP SYSTEMS IN AGRITECH MARKET, BY TYPE, 2018-2033 (USD THOUSAND)
TABLE 127 MEXICO AGRICULTURAL DRONES IN AGRITECH MARKET, BY TYPE, 2018-2033 (USD THOUSAND)
TABLE 128 MEXICO FIXED-WING DRONES IN AGRITECH MARKET, BY TYPE, 2018-2033 (USD THOUSAND)
TABLE 129 MEXICO AGRITECH MARKET, BY PLANT SCIENCE, 2018-2033 (USD THOUSAND)
TABLE 130 MEXICO AGRITECH MARKET, BY TECHNOLOGY, 2018-2033 (USD THOUSAND)
TABLE 131 MEXICO INTERNET OF THINGS (IOT) IN AGRITECH MARKET, BY TYPE, 2018-2033 (USD THOUSAND)
TABLE 132 MEXICO ARTIFICIAL INTELLIGENCE (AI) IN AGRITECH MARKET, BY TYPE, 2018-2033 (USD THOUSAND)
TABLE 133 MEXICO BIG DATA & ANALYTICS IN AGRITECH MARKET, BY TYPE, 2018-2033 (USD THOUSAND)
TABLE 134 MEXICO AGRITECH MARKET, BY APPLICATION, 2018-2033 (USD THOUSAND)
TABLE 135 MEXICO LIVESTOCK MONITORING IN AGRITECH MARKET, BY TYPE, 2018-2033 (USD THOUSAND)
TABLE 136 MEXICO AGRITECH MARKET, BY FARM SIZE, 2018-2033 (USD THOUSAND)
TABLE 137 MEXICO AGRITECH MARKET, BY END USER, 2018-2033 (USD THOUSAND)
TABLE 138 MEXICO AGRITECH MARKET, BY DISTRIBUTION CHANNEL, 2018-2033 (USD THOUSAND)
List of Figure
FIGURE 1 NORTH AMERICA AGRITECH MARKET : SEGMENTATION
FIGURE 2 NORTH AMERICA AGRITECH MARKET : DATA TRIANGULATION
FIGURE 3 NORTH AMERICA AGRITECH MARKET: DROC ANALYSIS
FIGURE 4 NORTH AMERICA AGRITECH MARKET: NORTH AMERICA VS REGIONAL ANALYSIS
FIGURE 5 NORTH AMERICA AGRITECH MARKET : COMPANY RESEARCH ANALYSIS
FIGURE 6 NORTH AMERICA AGRITECH MARKET: INTERVIEW DEMOGRAPHICS
FIGURE 7 NORTH AMERICA AGRITECH MARKET: DBMR MARKET POSITION GRID
FIGURE 8 NORTH AMERICA AGRITECH MARKET: MARKET END USER COVERAGE GRID
FIGURE 9 NORTH AMERICA AGRITECH MARKET : VENDOR SHARE ANALYSIS
FIGURE 10 EXECUTIVE SUMMARY
FIGURE 11 STRATEGIC DECISION
FIGURE 12 NORTH AMERICA AGRITECH MARKET: SEGMENTATION
FIGURE 13 RISING ADOPTION OF PRECISION FARMING TECHNOLOGIES EXPECTED TO DRIVE THE NORTH AMERICA AGRITECH MARKET IN THE FORECAST PERIOD OF 2026 TO 2033
FIGURE 14 PRECISION FARMING EQUIPMENT SEGMENT IS EXPECTED TO ACCOUNT FOR THE LARGEST SHARE OF THE NORTH AMERICA AGRITECH MARKET IN 2026 & 2033
FIGURE 15 ASIA PACIFIC IS EXPECTED TO DOMINATE THE NORTH AMERICA AGRITECH MARKET AND EUROPE TO GROW WITH THE HIGHEST CAGR IN THE FORECAST PERIOD OF 2026 TO 2033
FIGURE 16 ASIA PACIFIC IS THE FASTEST GROWING MARKET FOR AGRITECH MANUFACTURERS IN THE FORECAST PERIOD OF 2026 TO 2033
FIGURE 17 VENDOR SELECTION CRITERIA
FIGURE 18 VALUE CHAIN ANALYSIS
FIGURE 19 PORTER’S FIVE FORCES ANALYSIS
FIGURE 20 SUPPLY CHAIN ANALYSIS
FIGURE 21 DROC ANALYSIS
FIGURE 23 NORTH AMERICA AGRITECH MARKET, BY PLANT SCIENCE, 2025
FIGURE 24 NORTH AMERICA AGRITECH MARKET, BY TECHNOLOGY, 2025
FIGURE 25 NORTH AMERICA AGRITECH MARKET, BY APPLICATION, 2025
FIGURE 26 NORTH AMERICA AGRITECH MARKET, BY FARM SIZE, 2025
FIGURE 27 NORTH AMERICA AGRITECH MARKET, BY END USER, 2025
FIGURE 28 NORTH AMERICA AGRITECH MARKET, BY DISTRIBUTION CHANNEL, 2025
FIGURE 29 NORTH AMERICA AGRITECH MARKET: SNAPSHOT (2025)
FIGURE 30 NORTH AMERICA AGRITECH MARKET: COMPANY SHARE 2025 (%)
Data collection and base year analysis are done using data collection modules with large sample sizes. The stage includes obtaining market information or related data through various sources and strategies. It includes examining and planning all the data acquired from the past in advance. It likewise envelops the examination of information inconsistencies seen across different information sources. The market data is analysed and estimated using market statistical and coherent models. Also, market share analysis and key trend analysis are the major success factors in the market report. To know more, please request an analyst call or drop down your inquiry.
The key research methodology used by DBMR research team is data triangulation which involves data mining, analysis of the impact of data variables on the market and primary (industry expert) validation. Data models include Vendor Positioning Grid, Market Time Line Analysis, Market Overview and Guide, Company Positioning Grid, Patent Analysis, Pricing Analysis, Company Market Share Analysis, Standards of Measurement, Global versus Regional and Vendor Share Analysis. To know more about the research methodology, drop in an inquiry to speak to our industry experts.
Data Bridge Market Research is a leader in advanced formative research. We take pride in servicing our existing and new customers with data and analysis that match and suits their goal. The report can be customized to include price trend analysis of target brands understanding the market for additional countries (ask for the list of countries), clinical trial results data, literature review, refurbished market and product base analysis. Market analysis of target competitors can be analyzed from technology-based analysis to market portfolio strategies. We can add as many competitors that you require data about in the format and data style you are looking for. Our team of analysts can also provide you data in crude raw excel files pivot tables (Fact book) or can assist you in creating presentations from the data sets available in the report.


