
North America Alpha And Beta Emitters Based Radiopharmaceuticals Market
Market Size in USD Million
 USD
339.33 Million
USD
783.52 Million
2024
2032
USD
339.33 Million
USD
783.52 Million
2024
2032
| 2025 - 2032 | |
| USD 339.33 Million | |
| USD 783.52 Million | |
| % | |
|
Alpha and Beta Emitters Based Radiopharmaceuticals Market Size
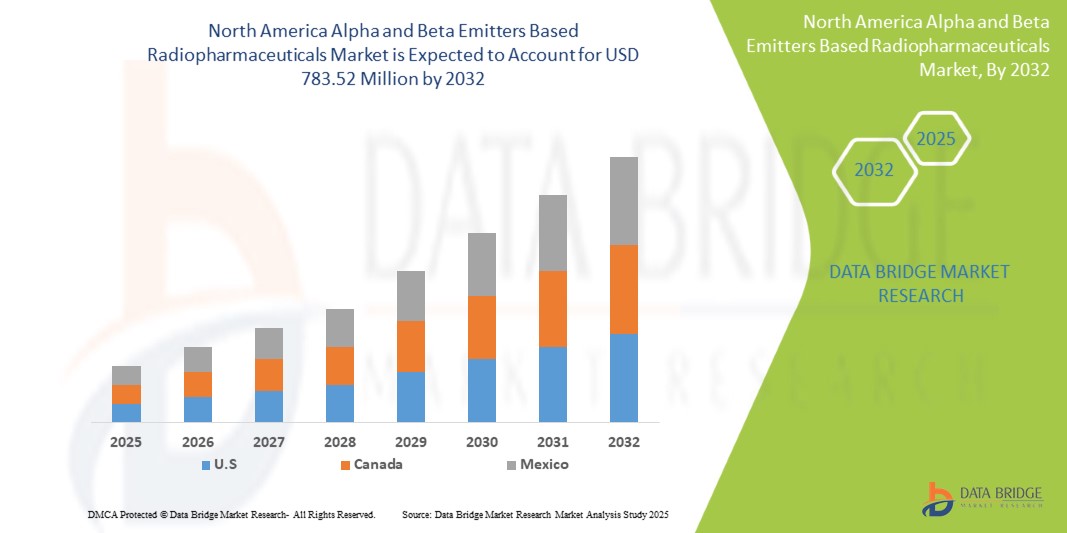
- The North America alpha and beta emitters based radiopharmaceuticals market size was valued at USD 339.33 million in 2024 and is expected to reach USD 783.52 million by 2032, at a CAGR of 11.1% during the forecast period
- The market growth is largely fueled by the increased efficacy of targeted alpha and beta therapies
- Furthermore, growing adoption of theranostics in personalized medicine. These converging factors are accelerating the uptake of alpha and beta emitters based radiopharmaceuticals solutions, thereby significantly boosting the industry's growth
Alpha and Beta Emitters Based Radiopharmaceuticals Market Analysis
- Alpha and beta emitters based radiopharmaceuticals are increasingly recognized for their precision in targeted therapy, especially in oncology and nuclear medicine, providing effective diagnosis and treatment options with minimal side effects
- The rising incidence of cancer worldwide, along with growing awareness about personalized medicine and advancements in radiopharmaceutical technology, is driving North America demand for alpha and beta emitters based radiopharmaceuticals
- U.S. holds a significant share in the alpha and beta emitters based radiopharmaceuticals market, accounting for approximately 44.52% of the revenue in 2025, supported by advanced healthcare infrastructure, extensive R&D activities, and early adoption of novel therapeutic technologies
- U.S. is anticipated to be the fastest-growing market for alpha and beta emitters based radiopharmaceuticals during the forecast period, propelled by expanding healthcare infrastructure, increasing cancer prevalence, government initiatives for healthcare improvement
- The beta emitters segment is expected to dominate the market with a share of 83.70% in 2025, driven by their high efficacy in Targeted Alpha Therapy (TAT), improved patient outcomes, and rising research focused on alpha-emitting isotopes like Actinium-225 and Radium-223 for cancer treatment
Report Scope and Alpha and Beta Emitters Based Radiopharmaceuticals Market Segmentation
|
Attributes |
Alpha and Beta Emitters Based Radiopharmaceuticals Key Market Insights |
|
Segments Covered |
|
|
Countries Covered |
North America
|
|
Key Market Players |
|
|
Market Opportunities |
|
|
Value Added Data Infosets |
In addition to the insights on market scenarios such as market value, growth rate, segmentation, geographical coverage, and major players, the market reports curated by the Data Bridge Market Research also include depth expert analysis, patient epidemiology, pipeline analysis, pricing analysis, and regulatory framework. |
Alpha and Beta Emitters Based Radiopharmaceuticals Market Trends
“Increased Efficacy of Targeted Alpha and Beta Therapies”
- A major driving force behind the North America alpha and beta emitters based radiopharmaceuticals market is the increasing clinical adoption of targeted radionuclide therapies, owing to their proven efficacy in treating advanced cancers such as neuroendocrine tumors and metastatic castration-resistant prostate cancer (mCRPC)
- For instance, in May 2023, according to the article published by NCBI, the approved [177Lu]Lu-PSMA-617 regimen (7.4 GBq per cycle every 6 weeks for up to 6 cycles) has shown strong safety and anti-tumor efficacy in real-world use, with flexible dosing (6–9.3 GBq) and treatment intervals (4–10 weeks). This consistent clinical performance enhances physician confidence and accelerates market adoption
- Radiopharmaceuticals like Lu-177, particularly when used in peptide receptor radionuclide therapy (PRRT), have demonstrated remarkable success in the treatment of neuroendocrine tumors, delivering potent beta radiation directly to tumor sites while preserving healthy tissues—leading to improved outcomes and increased demand
- Technological advancements and clinical validation of alpha-emitting isotopes, such as Ac-225, have further propelled the market. Ac-225 has proven highly effective in targeting prostate cancer cells resistant to traditional therapies, with minimal side effects and strong therapeutic impact
Alpha and Beta Emitters Based Radiopharmaceuticals Market Dynamics
Driver
“Growing Adoption of Theranostics in Personalized Medicine”
- The increasing adoption of theranostic alpha- and beta-emitter radiopharmaceuticals—such as Lutetium-177 (Lu-177) and Terbium-161 (Tb-161)—is a major driver propelling the North America radiopharmaceuticals market. By pairing diagnostic imaging with targeted therapy in a single clinical workflow, these agents deliver precise, patient-specific care that improves outcomes and streamlines treatment planning
- For instance, in July 2023, a review published in NCBI reported rising clinical use of Lu-177–based theranostic regimens (e.g., ¹⁷⁷Lu-DOTATATE for neuroendocrine tumors and ¹⁷⁷Lu-PSMA for prostate cancer). FDA approvals for these agents validated their safety and efficacy, accelerating adoption and highlighting the powerful synergy of matched diagnostic–therapeutic pairs
- Growing awareness among oncologists and nuclear-medicine specialists of the workflow efficiency, treatment accuracy, and reduced toxicity associated with theranostic approaches is driving demand, as clinicians seek reliable tools for personalized cancer management.
- Furthermore, as healthcare systems face mounting pressures to improve survival rates and control costs, integrated imaging-therapy solutions like Lu-177 and Tb-161 reduce time to treatment, avoid ineffective interventions, and enhance quality of life—solidifying their value proposition
- The rising preference for precision oncology, coupled with ongoing R&D in next-generation isotopes such as Tb-149, Tb-152/155, and Ac-225, positions theranostic radiopharmaceuticals as a cornerstone of modern cancer care and a key growth engine for the North America market
Restraint/Challenge
“Supply Chain and Scalability Challenges from Short Isotope Half-Lives”
- The short half-life of radionuclides such as Lead-212 (~10.6 hours) creates major logistical and operational hurdles: production must occur close to treatment sites, transport windows are only a few hours, and highly coordinated “just-in-time” supply chains are required—collectively constraining large-scale manufacturing and market reach
- For instance, in April 2025 L.E.K. Consulting noted that Pb-212’s 10.6-hour half-life forces decentralized, near-patient production and on-site generator infrastructure, limiting economies of scale and complicating distribution logistics
- Furthermore, the intricate generator systems needed to extract Pb-212 (and other short-lived isotopes) add layers of regulatory compliance, radiation-safety requirements, and capital expenditure, making broad deployment difficult for hospitals and radiopharmacies
- While advances in compact generators, faster purification methods, and regional production hubs could eventually ease these pressures, the fundamental time-sensitive nature of short-lived isotopes remains a significant restraint on the widespread adoption and growth of the radiopharmaceuticals market
Alpha and Beta Emitters Based Radiopharmaceuticals Market Scope
The market is segmented on the basis isotope, sources, therapeutic application, vector type, and end user.
- By Isotope
On the basis of isotope type, the market is segmented into beta emitters and alpha emitters. In 2025, the beta emitters segment is expected to dominate the market with the 83.70% market share, owing to the widespread clinical adoption of isotopes such as Lutetium-177 (Lu-177) and Yttrium-90 (Y-90) for treating neuroendocrine tumors, liver cancer, and prostate cancer. Beta emitters are preferred for their relatively longer half-lives, established safety profiles, and compatibility with existing clinical workflows.
The beta emitters segment is projected to witness the fastest growth rate of 11.1% from 2025 to 2032, driven by increasing usage of Actinium-225 (Ac-225) and Lead-212 (Pb-212) in advanced cancer treatments. Alpha emitters offer high linear energy transfer (LET) and greater tumor-killing efficacy with minimal collateral damage, making them highly suitable for resistant and metastatic cancers.
- By Sources
On the basis of sources, the market is categorized into reactor-produced isotopes, generator-produced isotopes, and others. In 2025, reactor-produced isotopes will lead the market due to the high-volume supply and broad availability of key beta emitters such as Lu-177 and Iodine-131.
However, reactor-produced isotopes are expected to be the fastest-growing segment, propelled by increasing demand for isotopes like Pb-212 and Ra-223, which require decentralized and near-patient production. The rise of on-site generators also aligns with the growing interest in alpha therapies and short-lived radiopharmaceuticals.
- By Therapeutic Application
On therapeutic application, the market is segmented into oncology and others. In 2025, oncology dominates the market, as radiopharmaceuticals play a central role in targeted therapies for prostate cancer, neuroendocrine tumors, and lymphoma. The increasing success of PSMA-targeted and PRRT-based therapies reinforces the leadership of oncology in this space.
The oncology segment includes cardiovascular, endocrine, and neurological disorders and is anticipated to witness steady growth with the development of novel radioligands and expansion into non-oncologic indications.
- By Vector Type
On the basis of vector type, the market is segmented into small molecule ligands, peptides, monoclonal antibodies, and others. In 2025, small molecule ligands are expected to hold the largest market share due to their rapid tissue penetration and widespread use in PSMA and somatostatin-targeted therapies.
Small molecule ligands are poised for significant growth during the forecast period due to advances in conjugation technologies and their ability to offer enhanced tumor selectivity, longer circulation times, and improved binding efficiency. These vectors are especially critical for alpha emitter therapies where precision is paramount.
- By End User
On the basis of, the market is segmented by end user into hospitals, radiopharmacies, and research institutes. In 2025, hospitals will account for the largest share, driven by increasing patient access to nuclear medicine, growth of theranostic departments, and strong reimbursement frameworks in developed countries.
The radiopharmacies segment is expected to grow rapidly due to the rising demand for centralized and decentralized compounding of radiopharmaceuticals, especially those with short half-lives. Research institutes will continue to play a vital role in innovation and clinical trials, particularly for next-generation isotopes like Terbium-161 and Actinium-225.
Alpha and Beta Emitters Based Radiopharmaceuticals Market Regional Analysis
- U.S. remains a global leader in the Alpha and Beta Emitters Based Radiopharmaceuticals Market, with a projected CAGR of 12.8% in 2025. Growth is driven by the country’s high incidence of cancer, rapid adoption of targeted radionuclide therapies, and ongoing advancements in precision medicine.
- Robust federal funding for nuclear medicine research, strong clinical trial infrastructure, and strategic collaborations between leading biotech firms, academic institutions, and the Department of Energy are accelerating innovation in therapeutic isotopes. Additionally, domestic production of key isotopes like Actinium-225 and Lutetium-177 is being scaled to ensure supply-chain resilience. These dynamics firmly position the U.S. as a dominant force in both the development and commercialization of alpha and beta emitter-based radiopharmaceuticals globally
Canada Alpha and Beta Emitters Based Radiopharmaceuticals Market Insight
Canada posts double-digit growth as new cyclotron and reactor upgrades support domestic Lu-177 output, while a widening network of outpatient theranostic centres meets rising demand for precision oncology.
Mexico Alpha and Beta Emitters Based Radiopharmaceuticals Market Insight
Mexico is emerging as a promising player in the North American radiopharmaceuticals market, supported by expanding nuclear medicine capabilities and increased demand for advanced cancer therapies. The country’s growing public-private investments in oncology care, adoption of targeted alpha and beta emitter technologies, and initiatives to enhance domestic isotope production are driving market momentum. With strategic support from institutions like the Instituto Nacional de Investigaciones Nucleares (ININ), Mexico is positioning itself as a key regional hub for accessible and cost-effective radiopharmaceutical solutions
Alpha and Beta Emitters Based Radiopharmaceuticals Market Share
The alpha and beta emitters based radiopharmaceuticals market is primarily led by well-established companies, including:
- Novartis AG (Switzerland)
- Eckert & Ziegler Germany)
- ITM Isotope Technologies Munich SE (Germany)
- SHINE Technologies, LLC (U.S.)
- Actinium Pharmaceuticals, Inc. (U.S.)
- Alpha Tau Medical Ltd. (Israel)
- ARICEUM THERAPEUTICS (Germany)
- Bayer AG (Germany)
- Curium (U.S.)
- IONETIX Corporation (U.S.)
- Isotopia (Israel)
- Lantheus (U.S.)
- Lilly (U.S.)
- Niowave (U.S.)
- NMR (U.S.)
- Orano Group (Paris)
- Telix Pharmaceuticals Limited (Australia)
Latest Developments in Alpha and Beta Emitters Based Radiopharmaceuticals Market
- In May 2025, ITM Isotope Technologies Munich SE and Radiopharm Theranostics announced a supply agreement for non-carrier-added Lutetium-177 (n.c.a. 177Lu). The partnership supports Radiopharm’s clinical development of Lu-177-based therapies, including RAD 204, RAD 202, and RV01, ensuring high-quality isotope access for targeted radiopharmaceutical treatment of solid tumors in ongoing and future clinical trials
- In March 2025, the FDA approved Novartis’ Pluvicto (Lu-177 vipivotide tetraxetan) for earlier use in PSMA-positive metastatic castration-resistant prostate cancer, allowing administration after one ARPI and before chemotherapy. Based on Phase III PSMAfore trial results, Pluvicto reduced progression or death risk by 59%, doubling median radiographic progression-free survival while maintaining a favorable safety profile and expanding patient access significantly
- In March 2025, Eckert & Ziegler and AtomVie North America Radiopharma signed a North America supply agreement for non-carrier added Lutetium-177 (Theralugand). The partnership ensures a stable, high-quality Lu-177 supply for AtomVie’s CDMO radiopharmaceutical operations, supporting early-to-late-stage development worldwide and enhancing both companies' capabilities in radiopharmaceutical innovation, regulatory compliance, and patient-centered nuclear medicine solutions
- In March 2025, Eckert & Ziegler and Actinium Pharmaceuticals signed a supply agreement for high-purity Actinium-225 (Ac-225). The partnership ensures a reliable Ac-225 source to support the development of Actimab-A and other radiotherapeutic candidates targeting AML and solid tumors, strengthening Actinium’s clinical pipeline and addressing North America isotope supply challenges in precision radiopharmaceutical therapy
- In May 2024, Novartis AG announced its agreement to acquire Mariana Oncology for USD 1 billion upfront and up to USD 750 million in milestone payments. The acquisition strengthens Novartis’ radioligand therapy (RLT) pipeline with preclinical assets targeting solid tumors, including actinium-based candidate MC-339 for small cell lung cancer, and enhances its RLT research, supply, and innovation capabilities
SKU-

- Interactive Data Analysis Dashboard
- Company Analysis Dashboard for high growth potential opportunities
- Research Analyst Access for customization & queries
- Competitor Analysis with Interactive dashboard
- Latest News, Updates & Trend analysis
- Harness the Power of Benchmark Analysis for Comprehensive Competitor Tracking
Table of Content
1 INTRODUCTION
1.1 OBJECTIVES OF THE STUDY
1.2 MARKET DEFINITION
1.3 OVERVIEW OF NORTH AMERICA ALPHA AND BETA EMITTERS BASED RADIOPHARMACEUTICALS MARKET
1.4 MARKETS COVERED
2 MARKET SEGMENTATION
2.1 MARKETS COVERED
2.2 GEOGRAPHICAL SCOPE
2.3 YEARS CONSIDERED FOR THE STUDY
2.4 CURRENCY AND PRICING
2.5 DBMR TRIPOD DATA VALIDATION MODEL
2.6 MULTIVARIATE MODELLING
2.7 PRIMARY INTERVIEWS WITH KEY OPINION LEADERS
2.8 DBMR MARKET POSITION GRID
2.9 VENDOR SHARE ANALYSIS
2.1 END USER MARKET COVERAGE GRID
2.11 SECONDARY SOURCES
2.12 ASSUMPTIONS
3 EXECUTIVE SUMMARY
4 PREMIUM INSIGHT
4.1 PORTER’S FIVE FORCES
4.2 PESTEL ANALYSIS
4.3 PIPELINE
4.4 SUPPLY CHAIN ECOSYSTEM
4.4.1 PROMINENT COMPANIES
4.4.2 SMALL & MEDIUM SIZE COMPANIES
4.4.3 END USERS
4.5 INDUSTRY INSIGHTS
4.5.1 MICRO AND MACRO ECONOMIC FACTORS
4.5.2 KEY PRICING STRATEGIES
4.6 MARKETED DRUG ANALYSIS
4.6.1 DRUG
4.6.1.1 BRAND NAME
4.6.1.2 GENERIC NAME
4.6.2 THERAPEUTIC INDICATION
4.6.3 PHARMACOLOGICAL CLASS OF THE DRUG
4.6.4 DRUG PRIMARY INDICATION
4.6.5 MARKET STATUS
4.6.6 MEDICATION TYPE
4.6.7 DRUG DOSAGE FORM
4.6.8 DOSAGES AVAILABILITY
4.6.9 PACKAGING TYPE
4.6.10 DRUG ROUTE OF ADMINISTRATION
4.6.11 DOSING FREQUENCY
4.6.12 DRUG INSIGHT
4.6.13 OVERVIEW OF DRUG DEVELOPMENT ACTIVITIES
4.6.13.1 FORECAST MARKET OUTLOOK
4.6.13.2 CROSS COMPETITION
4.6.13.3 THERAPEUTIC PORTFOLIO
4.6.13.4 CURRENT DEVELOPMENT SCENARIO
4.7 HEALTHCARE TARIFFS IMPACT ANALYSIS
4.7.1 OVERVIEW
4.7.2 TARIFF STRUCTURES
4.7.2.1 NORTH AMERICA VS. REGIONAL TARIFF STRUCTURES
4.7.2.2 UNITED STATES: MEDICARE/MEDICAID TARIFF POLICIES, CMS PRICING MODELS
4.7.2.3 EUROPEAN UNION: CROSS-BORDER TARIFF REGULATIONS, REIMBURSEMENT POLICIES
4.7.2.4 ASIA-PACIFIC: GOVERNMENT-IMPOSED TARIFFS ON IMPORTED MEDICAL PRODUCTS
4.7.2.5 EMERGING MARKETS: CHALLENGES IN TARIFF IMPLEMENTATION
4.7.3 PHARMACEUTICAL TARIFFS AND TRADE BARRIERS
4.7.3.1 IMPORT DUTIES ON PRESCRIPTION DRUGS VS. GENERICS
4.7.3.2 IMPACT ON DRUG AFFORDABILITY AND ACCESS
4.7.3.3 KEY TRADE AGREEMENTS AFFECTING PHARMACEUTICAL TARIFFS
4.8 IMPACT OF HEALTHCARE TARIFFS ON PROVIDERS AND PATIENTS
4.8.1.1 COST BURDEN ON HOSPITALS AND HEALTHCARE FACILITIES
4.8.1.2 EFFECT ON PATIENT AFFORDABILITY AND INSURANCE COVERAGE
4.8.1.3 TARIFFS AND THEIR ROLE IN MEDICAL TOURISM
4.8.2 TRADE AGREEMENTS AND HEALTHCARE TARIFFS
4.8.2.1 WTO REGULATIONS ON HEALTHCARE TARIFFS
4.8.2.2 IMPACT OF TRADE WARS ON THE HEALTHCARE SUPPLY CHAIN
4.8.2.3 ROLE OF FREE TRADE AGREEMENTS (FTAS) IN REDUCING TARIFFS
4.8.3 IMPACT OF TARIFFS ON HEALTHCARE COSTS AND ACCESSIBILITY
4.8.4 IMPORTANCE OF TARIFFS IN THE HEALTHCARE SECTOR
4.9 EPIDEMIOLOGY OVERVIEW
4.9.1 INCIDENCE OF ALL CANCERS BY GENDER
4.9.2 TREATMENT RATE
4.9.3 MORTALITY RATE
4.9.4 DRUG ADHERENCE AND THERAPY SWITCH MODEL
4.9.5 PATIENT TREATMENT SUCCESS RATES
5 REGULATORY FRAMEWORK
5.1 REGULATORY FRAMEWORK OVERVIEW FOR THE NORTH AMERICA ALPHA AND BETA EMITTERS BASED RADIOPHARMACEUTICALS MARKET
5.1.1 GEOGRAPHIES’ EASE OF REGULATORY APPROVAL
5.1.2 REGULATORY APPROVAL PATHWAYS
5.1.3 LICENSING AND REGISTRATION
5.1.4 POST-MARKETING SURVEILLANCE
5.1.5 GOOD MANUFACTURING PRACTICES (GMPS) GUIDELINES
6 MARKET OVERVIEW
6.1 DRIVERS
6.1.1 INCREASED EFFICACY OF TARGETED ALPHA AND BETA THERAPIES
6.1.2 GROWING ADOPTION OF THERANOSTICS IN PERSONALIZED MEDICINE
6.1.3 RISING CLINICAL DEMAND FOR ALPHA-BASED RADIOTHERAPIES
6.1.4 RISING CHRONIC DISEASE BURDEN DRIVING RADIOPHARMACEUTICAL DEMAND
6.2 RESTRAINTS
6.2.1 SUPPLY CHAIN AND SCALABILITY CHALLENGES FROM SHORT ISOTOPE HALF-LIVES
6.2.2 STRINGENT REGULATORY LANDSCAPE LIMITING MARKET FLEXIBILITY
6.2.3 SAFETY AND EXPOSURE RISKS IN RADIOPHARMACEUTICAL USE
6.3 OPPORTUNITIES
6.3.1 SURGE IN R&D ACTIVITY EXPANDING RADIOPHARMACEUTICAL APPLICATIONS
6.3.2 EXPANSION OF LU-177-PSMA THERAPY IN PROSTATE CANCER TREATMENT
6.3.3 STRATEGIC COLLABORATIONS DRIVING RADIOPHARMACEUTICAL INNOVATION
6.4 CHALLENGES
6.4.1 HIGH COST OF DEVELOPMENT AND IMPLEMENTATION OF RADIOPHARMACEUTICALS
6.4.2 SHORTAGE OF SKILLED WORKFORCE IN NUCLEAR MEDICINE AND RADIOCHEMISTRY
7 NORTH AMERICA ALPHA AND BETA EMITTERS BASED RADIOPHARMACEUTICALS MARKET, BY ISOTOPE
7.1 OVERVIEW
7.2 BETA EMITTERS
7.2.1 LUTETIUM-177
7.2.2 TERBIUM-161
7.3 ALPHA EMITTERS
7.3.1 ACTINIUM-225
7.3.2 LEAD -212
8 NORTH AMERICA ALPHA AND BETA EMITTERS BASED RADIOPHARMACEUTICALS MARKET, BY SOURCES
8.1 OVERVIEW
8.2 REACTOR-PRODUCED ISOTOPES
8.3 GENERATOR-PRODUCED ISOTOPES
8.4 OTHERS
9 NORTH AMERICA ALPHA AND BETA EMITTERS BASED RADIOPHARMACEUTICALS MARKET, BY THERAPEUTIC APPLICATION
9.1 OVERVIEW
9.2 ONCOLOGY
9.2.1 PROSTATE CANCER
9.2.2 NEUROENDOCRINE TUMORS
9.2.3 LIVER CANCER
9.2.4 BRAIN TUMORS
9.2.5 BREAST CANCER
9.2.6 LEUKEMIA
9.3 OTHERS
10 NORTH AMERICA ALPHA AND BETA EMITTERS BASED RADIOPHARMACEUTICALS MARKET, BY VECTOR TYPE
10.1 OVERVIEW
10.2 SMALL MOLECULE LIGANDS
10.3 PEPTIDES
10.4 MONOCLONAL ANTIBODIES
10.5 OTHERS
11 NORTH AMERICA ALPHA AND BETA EMITTERS BASED RADIOPHARMACEUTICALS MARKET, BY END USER
11.1 OVERVIEW
11.2 HOSPITALS
11.2.1 ONCOLOGY CENTERS
11.2.2 NUCLEAR MEDICINE DEPARTMENTS
11.3 RADIOPHARMACIES
11.4 RESEARCH INSTITUTES
12 NORTH AMERICA ALPHA AND BETA EMITTERS BASED RADIOPHARMACEUTICALS MARKET, BY REGION
12.1 NORTH AMERICA
12.1.1 U.S.
12.1.2 CANADA
12.1.3 MEXICO
13 NORTH AMERICA ALPHA AND BETA EMITTERS BASED RADIOPHARMACEUTICALS MARKET: COMPANY LANDSCAPE
13.1 COMPANY SHARE ANALYSIS: NORTH AMERICA
14 SWOT ANALYSIS
15 COMPANY PROFILES
15.1 NOVARTIS AG
15.1.1 COMPANY SNAPSHOT
15.1.2 REVENUE ANALYSIS
15.1.3 COMPANY SHARE ANALYSIS
15.1.4 PRODUCT PORTFOLIO
15.1.5 RECENT DEVELOPMENTS
15.2 ECKERT & ZIEGLER
15.2.1 COMPANY SNAPSHOT
15.2.2 REVENUE ANALYSIS
15.2.3 COMPANY SHARE ANALYSIS
15.2.4 PRODUCT PORTFOLIO
15.2.5 RECENT DEVELOPMENTS
15.3 ITM ISOTOPE TECHNOLOGIES MUNICH SE
15.3.1 COMPANY SNAPSHOT
15.3.2 COMPANY SHARE ANALYSIS
15.3.3 PRODUCT PORTFOLIO
15.3.4 RECENT DEVELOPMENT
15.4 SHINE TECHNOLOGIES, LLC
15.4.1 COMPANY SNAPSHOT
15.4.2 COMPANY SHARE ANALYSIS
15.4.3 PRODUCT PORTFOLIO
15.4.4 RECENT DEVELOPMENT
15.5 ACTINIUM PHARMACEUTICALS, INC.
15.5.1 COMPANY SNAPSHOT
15.5.2 PIPELINE PRODUCT PORTFOLIO
15.5.3 RECENT DEVELOPMENTS
15.6 ALPHA TAU MEDICAL LTD.
15.6.1 COMPANY SNAPSHOT
15.6.2 PIPELINE PRODUCT PORTFOLIO
15.6.3 RECENT DEVELOPMENT
15.7 ARICEUM THERAPEUTICS
15.7.1 COMPANY SNAPSHOT
15.7.2 PIPELINE PRODUCT PORTFOLIO
15.7.3 RECENT DEVELOPMENT
15.8 BAYER AG
15.8.1 COMPANY SNAPSHOT
15.8.2 REVENUE ANALYSIS
15.8.3 PIPELINE PRODUCT PORTFOLIO
15.8.4 RECENT DEVELOPMENT
15.9 CURIUM
15.9.1 COMPANY SNAPSHOT
15.9.2 PIPELINE PRODUCT PORTFOLIO
15.9.3 RECENT DEVELOPMENT
15.1 IONETIX CORPORATION
15.10.1 COMPANY SNAPSHOT
15.10.2 PIPELINE PRODUCT PORTFOLIO
15.10.3 RECENT DEVELOPMENT
15.11 ISOTOPIA
15.11.1 COMPANY SNAPSHOT
15.11.2 PIPELINE PRODUCT PORTFOLIO
15.11.3 RECENT DEVELOPMENT
15.12 LANTHEUS
15.12.1 COMPANY SNAPSHOT
15.12.2 REVENUE ANALYSIS
15.12.3 PIPELINE PRODUCT PORTFOLIO
15.12.4 RECENT DEVELOPMENT
15.13 LILLY
15.13.1 COMPANY SNAPSHOT
15.13.2 REVENUE ANALYSIS
15.13.3 PIPELINE PRODUCT PORTFOLIO
15.14 NIOWAVE
15.14.1 COMPANY SNAPSHOT
15.14.2 PIPELINE PRODUCT PORTFOLIO
15.14.3 RECENT DEVELOPMENT
15.15 NMR
15.15.1 COMPANY SNAPSHOT
15.15.2 PIPELINE PRODUCT PORTFOLIO
15.15.3 RECENT DEVELOPMENT
15.16 ONCOINVENT
15.16.1 COMPANY SNAPSHOT
15.16.2 PIPELINE PRODUCT PORTFOLIO
15.16.3 RECENT DEVELOPMENT
15.17 ORANO GROUP
15.17.1 COMPANY SNAPSHOT
15.17.2 REVENUE ANALYSIS
15.17.3 PIPELINE PRODUCT PORTFOLIO
15.17.4 RECENT DEVELOPMENT
15.18 RADIOPHARM THERANOSTICS LIMITED
15.18.1 COMPANY SNAPSHOT
15.18.2 PIPELINE PRODUCT PORTFOLIO
15.18.3 RECENT DEVELOPMENT
15.19 TELIX PHARMACEUTICALS LIMITED
15.19.1 COMPANY SNAPSHOT
15.19.2 REVENUE ANALYSIS
15.19.3 PIPELINE PRODUCT PORTFOLIO
15.19.4 RECENT DEVELOPMENT
15.2 TERTHERA
15.20.1 COMPANY SNAPSHOT
15.20.2 PIPELINE PRODUCT PORTFOLIO
15.20.3 RECENT DEVELOPMENT
15.20.4 RECENT DEVELOPMENT
16 QUESTIONNAIRE
17 RELATED REPORTS
List of Table
TABLE 1 NORTH AMERICA CLINICAL TRIAL MARKET FOR NORTH AMERICA ALPHA AND BETA EMITTERS BASED RADIOPHARMACEUTICALS MARKET
TABLE 2 DISTRIBUTION OF PRODUCTS AND PROJECTS BY PHASE NORTH AMERICA ALPHA AND BETA EMITTERS BASED RADIOPHARMACEUTICALS MARKET
TABLE 3 DISTRIBUTION OF PROJECTS BY THERAPEUTIC AREA AND PHASE NORTH AMERICA ALPHA AND BETA EMITTERS BASED RADIOPHARMACEUTICALS MARKET
TABLE 4 DISTRIBUTION OF PROJECTS BY SCIENTIFIC APPROACH AND PHASE NORTH AMERICA ALPHA AND BETA EMITTERS BASED RADIOPHARMACEUTICALS MARKET
TABLE 5 PENETRATION AND GROWTH PROSPECT MAPPING
TABLE 6 INCIDENCE OF CANCER BY GENDER
TABLE 7 CANCER MORTALITY RATE
TABLE 8 CANCER TREATMENT SUCCESS RATE
TABLE 9 NORTH AMERICA ALPHA AND BETA EMITTERS BASED RADIOPHARMACEUTICALS MARKET, BY ISOTOPE, 2018-2032 (USD THOUSAND)
TABLE 10 NORTH AMERICA BETA EMITTERS IN ALPHA AND BETA EMITTERS BASED RADIOPHARMACEUTICALS MARKET, BY REGION, 2018-2032 (USD THOUSAND)
TABLE 11 NORTH AMERICA BETA EMITTERS IN ALPHA AND BETA EMITTERS BASED RADIOPHARMACEUTICALS MARKET, BY TYPE, 2018-2032 (USD THOUSAND)
TABLE 12 NORTH AMERICA ALPHA EMITTERS IN ALPHA AND BETA EMITTERS BASED RADIOPHARMACEUTICALS MARKET, BY REGION, 2018-2032 (USD THOUSAND)
TABLE 13 NORTH AMERICA ALPHA EMITTERS IN ALPHA AND BETA EMITTERS BASED RADIOPHARMACEUTICALS MARKET, BY TYPE, 2018-2032 (USD THOUSAND)
TABLE 14 NORTH AMERICA ALPHA AND BETA EMITTERS BASED RADIOPHARMACEUTICALS MARKET, BY SOURCES, 2018-2032 (USD THOUSAND)
TABLE 15 NORTH AMERICA REACTOR-PRODUCED ISOTOPES IN ALPHA AND BETA EMITTERS BASED RADIOPHARMACEUTICALS MARKET, BY REGION, 2018-2032 (USD THOUSAND)
TABLE 16 NORTH AMERICA GENERATOR-PRODUCED ISOTOPES IN ALPHA AND BETA EMITTERS BASED RADIOPHARMACEUTICALS MARKET, BY REGION, 2018-2032 (USD THOUSAND)
TABLE 17 NORTH AMERICA OTHERS IN ALPHA AND BETA EMITTERS BASED RADIOPHARMACEUTICALS MARKET, BY REGION, 2018-2032 (USD THOUSAND)
TABLE 18 NORTH AMERICA ALPHA AND BETA EMITTERS BASED RADIOPHARMACEUTICALS MARKET, BY THERAPEUTIC APPLICATION, 2018-2032 (USD THOUSAND)
TABLE 19 NORTH AMERICA ONCOLOGY IN ALPHA AND BETA EMITTERS BASED RADIOPHARMACEUTICALS MARKET, BY REGION, 2018-2032 (USD THOUSAND)
TABLE 20 NORTH AMERICA ONCOLOGY IN ALPHA AND BETA EMITTERS BASED RADIOPHARMACEUTICALS MARKET, BY TYPE, 2018-2032 (USD THOUSAND)
TABLE 21 NORTH AMERICA OTHERS IN ALPHA AND BETA EMITTERS BASED RADIOPHARMACEUTICALS MARKET, BY REGION, 2018-2032 (USD THOUSAND)
TABLE 22 NORTH AMERICA ALPHA AND BETA EMITTERS BASED RADIOPHARMACEUTICALS MARKET, BY VECTOR TYPE, 2018-2032 (USD THOUSAND)
TABLE 23 NORTH AMERICA SMALL MOLECULE LIGANDS IN ALPHA AND BETA EMITTERS BASED RADIOPHARMACEUTICALS MARKET, BY REGION, 2018-2032 (USD THOUSAND)
TABLE 24 NORTH AMERICA PEPTIDES IN ALPHA AND BETA EMITTERS BASED RADIOPHARMACEUTICALS MARKET, BY REGION, 2018-2032 (USD THOUSAND)
TABLE 25 NORTH AMERICA MONOCLONAL ANTIBODIES IN ALPHA AND BETA EMITTERS BASED RADIOPHARMACEUTICALS MARKET, BY REGION, 2018-2032 (USD THOUSAND)
TABLE 26 NORTH AMERICA OTHERS IN ALPHA AND BETA EMITTERS BASED RADIOPHARMACEUTICALS MARKET, BY REGION, 2018-2032 (USD THOUSAND)
TABLE 27 NORTH AMERICA ALPHA AND BETA EMITTERS BASED RADIOPHARMACEUTICALS MARKET, BY END USER, 2018-2032 (USD THOUSAND)
TABLE 28 NORTH AMERICA HOSPITALS IN ALPHA AND BETA EMITTERS BASED RADIOPHARMACEUTICALS MARKET, BY REGION, 2018-2032 (USD THOUSAND)
TABLE 29 NORTH AMERICA HOSPITALS IN ALPHA AND BETA EMITTERS BASED RADIOPHARMACEUTICALS MARKET, BY TYPE, 2018-2032 (USD THOUSAND)
TABLE 30 NORTH AMERICA RADIOPHARMACIES IN ALPHA AND BETA EMITTERS BASED RADIOPHARMACEUTICALS MARKET, BY REGION, 2018-2032 (USD THOUSAND)
TABLE 31 NORTH AMERICA RESEARCH INSTITUTES IN ALPHA AND BETA EMITTERS BASED RADIOPHARMACEUTICALS MARKET, BY REGION, 2018-2032 (USD THOUSAND)
TABLE 32 NORTH AMERICA ALPHA AND BETA EMITTERS BASED RADIOPHARMACEUTICALS MARKET, BY COUNTRY, 2018-2032 (USD THOUSAND)
TABLE 33 NORTH AMERICA ALPHA AND BETA EMITTERS BASED RADIOPHARMACEUTICALS MARKET, BY ISOTOPE, 2018-2032 (USD THOUSAND)
TABLE 34 NORTH AMERICA BETA EMITTERS IN ALPHA AND BETA EMITTERS BASED RADIOPHARMACEUTICALS MARKET, BY TYPE, 2018-2032 (USD THOUSAND)
TABLE 35 NORTH AMERICA ALPHA EMITTERS IN ALPHA AND BETA EMITTERS BASED RADIOPHARMACEUTICALS MARKET, BY TYPE, 2018-2032 (USD THOUSAND)
TABLE 36 NORTH AMERICA ALPHA AND BETA EMITTERS BASED RADIOPHARMACEUTICALS MARKET, BY SOURCES, 2018-2032 (USD THOUSAND)
TABLE 37 NORTH AMERICA ALPHA AND BETA EMITTERS BASED RADIOPHARMACEUTICALS MARKET, BY THERAPEUTIC APPLICATION, 2018-2032 (USD THOUSAND)
TABLE 38 NORTH AMERICA ONCOLOGY IN ALPHA AND BETA EMITTERS BASED RADIOPHARMACEUTICALS MARKET, BY TYPE, 2018-2032 (USD THOUSAND)
TABLE 39 NORTH AMERICA ALPHA AND BETA EMITTERS BASED RADIOPHARMACEUTICALS MARKET, BY VECTOR TYPE, 2018-2032 (USD THOUSAND)
TABLE 40 NORTH AMERICA ALPHA AND BETA EMITTERS BASED RADIOPHARMACEUTICALS MARKET, BY END USER, 2018-2032 (USD THOUSAND)
TABLE 41 NORTH AMERICA HOSPITALS IN ALPHA AND BETA EMITTERS BASED RADIOPHARMACEUTICALS MARKET, BY TYPE, 2018-2032 (USD THOUSAND)
TABLE 42 U.S. ALPHA AND BETA EMITTERS BASED RADIOPHARMACEUTICALS MARKET, BY ISOTOPE, 2018-2032 (USD THOUSAND)
TABLE 43 U.S. BETA EMITTERS IN ALPHA AND BETA EMITTERS BASED RADIOPHARMACEUTICALS MARKET, BY TYPE, 2018-2032 (USD THOUSAND)
TABLE 44 U.S. ALPHA EMITTERS IN ALPHA AND BETA EMITTERS BASED RADIOPHARMACEUTICALS MARKET, BY TYPE, 2018-2032 (USD THOUSAND)
TABLE 45 U.S. ALPHA AND BETA EMITTERS BASED RADIOPHARMACEUTICALS MARKET, BY SOURCES, 2018-2032 (USD THOUSAND)
TABLE 46 U.S. ALPHA AND BETA EMITTERS BASED RADIOPHARMACEUTICALS MARKET, BY THERAPEUTIC APPLICATION, 2018-2032 (USD THOUSAND)
TABLE 47 U.S. ONCOLOGY IN ALPHA AND BETA EMITTERS BASED RADIOPHARMACEUTICALS MARKET, BY TYPE, 2018-2032 (USD THOUSAND)
TABLE 48 U.S. ALPHA AND BETA EMITTERS BASED RADIOPHARMACEUTICALS MARKET, BY VECTOR TYPE, 2018-2032 (USD THOUSAND)
TABLE 49 U.S. ALPHA AND BETA EMITTERS BASED RADIOPHARMACEUTICALS MARKET, BY END USER, 2018-2032 (USD THOUSAND)
TABLE 50 U.S. HOSPITALS IN ALPHA AND BETA EMITTERS BASED RADIOPHARMACEUTICALS MARKET, BY TYPE, 2018-2032 (USD THOUSAND)
TABLE 51 CANADA ALPHA AND BETA EMITTERS BASED RADIOPHARMACEUTICALS MARKET, BY ISOTOPE, 2018-2032 (USD THOUSAND)
TABLE 52 CANADA BETA EMITTERS IN ALPHA AND BETA EMITTERS BASED RADIOPHARMACEUTICALS MARKET, BY TYPE, 2018-2032 (USD THOUSAND)
TABLE 53 CANADA ALPHA EMITTERS IN ALPHA AND BETA EMITTERS BASED RADIOPHARMACEUTICALS MARKET, BY TYPE, 2018-2032 (USD THOUSAND)
TABLE 54 CANADA ALPHA AND BETA EMITTERS BASED RADIOPHARMACEUTICALS MARKET, BY SOURCES, 2018-2032 (USD THOUSAND)
TABLE 55 CANADA ALPHA AND BETA EMITTERS BASED RADIOPHARMACEUTICALS MARKET, BY THERAPEUTIC APPLICATION, 2018-2032 (USD THOUSAND)
TABLE 56 CANADA ONCOLOGY IN ALPHA AND BETA EMITTERS BASED RADIOPHARMACEUTICALS MARKET, BY TYPE, 2018-2032 (USD THOUSAND)
TABLE 57 CANADA ALPHA AND BETA EMITTERS BASED RADIOPHARMACEUTICALS MARKET, BY VECTOR TYPE, 2018-2032 (USD THOUSAND)
TABLE 58 CANADA ALPHA AND BETA EMITTERS BASED RADIOPHARMACEUTICALS MARKET, BY END USER, 2018-2032 (USD THOUSAND)
TABLE 59 CANADA HOSPITALS IN ALPHA AND BETA EMITTERS BASED RADIOPHARMACEUTICALS MARKET, BY TYPE, 2018-2032 (USD THOUSAND)
TABLE 60 MEXICO ALPHA AND BETA EMITTERS BASED RADIOPHARMACEUTICALS MARKET, BY ISOTOPE, 2018-2032 (USD THOUSAND)
TABLE 61 MEXICO BETA EMITTERS IN ALPHA AND BETA EMITTERS BASED RADIOPHARMACEUTICALS MARKET, BY TYPE, 2018-2032 (USD THOUSAND)
TABLE 62 MEXICO ALPHA EMITTERS IN ALPHA AND BETA EMITTERS BASED RADIOPHARMACEUTICALS MARKET, BY TYPE, 2018-2032 (USD THOUSAND)
TABLE 63 MEXICO ALPHA AND BETA EMITTERS BASED RADIOPHARMACEUTICALS MARKET, BY SOURCES, 2018-2032 (USD THOUSAND)
TABLE 64 MEXICO ALPHA AND BETA EMITTERS BASED RADIOPHARMACEUTICALS MARKET, BY THERAPEUTIC APPLICATION, 2018-2032 (USD THOUSAND)
TABLE 65 MEXICO ONCOLOGY IN ALPHA AND BETA EMITTERS BASED RADIOPHARMACEUTICALS MARKET, BY TYPE, 2018-2032 (USD THOUSAND)
TABLE 66 MEXICO ALPHA AND BETA EMITTERS BASED RADIOPHARMACEUTICALS MARKET, BY VECTOR TYPE, 2018-2032 (USD THOUSAND)
TABLE 67 MEXICO ALPHA AND BETA EMITTERS BASED RADIOPHARMACEUTICALS MARKET, BY END USER, 2018-2032 (USD THOUSAND)
TABLE 68 MEXICO HOSPITALS IN ALPHA AND BETA EMITTERS BASED RADIOPHARMACEUTICALS MARKET, BY TYPE, 2018-2032 (USD THOUSAND)
List of Figure
FIGURE 1 NORTH AMERICA ALPHA AND BETA EMITTERS BASED RADIOPHARMACEUTICALS MARKET: SEGMENTATION
FIGURE 2 NORTH AMERICA ALPHA AND BETA EMITTERS BASED RADIOPHARMACEUTICALS MARKET: DATA TRIANGULATION
FIGURE 3 NORTH AMERICA ALPHA AND BETA EMITTERS BASED RADIOPHARMACEUTICALS MARKET: DROC ANALYSIS
FIGURE 4 NORTH AMERICA ALPHA AND BETA EMITTERS BASED RADIOPHARMACEUTICALS MARKET: NORTH AMERICA VS REGIONAL MARKET ANALYSIS
FIGURE 5 NORTH AMERICA ALPHA AND BETA EMITTERS BASED RADIOPHARMACEUTICALS MARKET: COMPANY RESEARCH ANALYSIS
FIGURE 6 NORTH AMERICA ALPHA AND BETA EMITTERS BASED RADIOPHARMACEUTICALS MARKET: MULTIVARIATE MODELLING
FIGURE 7 CURVE LINE CHART, BY ISOTOPE
FIGURE 8 NORTH AMERICA ALPHA AND BETA EMITTERS BASED RADIOPHARMACEUTICALS MARKET: INTERVIEW DEMOGRAPHICS
FIGURE 9 NORTH AMERICA ALPHA AND BETA EMITTERS BASED RADIOPHARMACEUTICALS MARKET: DBMR MARKET POSITION GRID
FIGURE 10 NORTH AMERICA ALPHA AND BETA EMITTERS BASED RADIOPHARMACEUTICALS MARKET: VENDOR SHARE ANALYSIS
FIGURE 11 NORTH AMERICA ALPHA AND BETA EMITTERS BASED RADIOPHARMACEUTICALS MARKET: END USER MARKET COVERAGE GRID
FIGURE 12 NORTH AMERICA ALPHA AND BETA EMITTERS BASED RADIOPHARMACEUTICALS MARKET: SEGMENTATION
FIGURE 13 NORTH AMERICA ALPHA AND BETA EMITTERS BASED RADIOPHARMACEUTICALS MARKET: EXECUTIVE SUMMARY
FIGURE 14 STRATEGIC DECISIONS
FIGURE 15 TWO SEGMENTS COMPRISE THE NORTH AMERICA ALPHA AND BETA EMITTERS BASED RADIOPHARMACEUTICALS MARKET, BY ISOTOPE 2024
FIGURE 16 INCREASED EFFICACY OF TARGETED ALPHA AND BETA THERAPIES IS EXPECTED TO DRIVE THE NORTH AMERICA ALPHA AND BETA EMITTERS BASED RADIOPHARMACEUTICALS MARKET IN THE FORECAST PERIOD
FIGURE 17 BETA EMITTERS SEGMENT IS EXPECTED TO ACCOUNT FOR THE LARGEST SHARE OF THE NORTH AMERICA ALPHA AND BETA EMITTERS BASED RADIOPHARMACEUTICALS MARKET IN 2025 & 2032
FIGURE 18 INCIDENCE BY CANCER SITE
FIGURE 19 CANCER MORTALITY RATE WITH CANCER SITE
FIGURE 20 DROC ANALYSIS
FIGURE 21 NORTH AMERICA ALPHA AND BETA EMITTERS BASED RADIOPHARMACEUTICALS MARKET: BY ISOTOPE, 2024
FIGURE 22 NORTH AMERICA ALPHA AND BETA EMITTERS BASED RADIOPHARMACEUTICALS MARKET: BY ISOTOPE, 2025 TO 2032 (USD THOUSAND)
FIGURE 23 NORTH AMERICA ALPHA AND BETA EMITTERS BASED RADIOPHARMACEUTICALS MARKET: BY ISOTOPE, CAGR (2025-2032)
FIGURE 24 NORTH AMERICA ALPHA AND BETA EMITTERS BASED RADIOPHARMACEUTICALS MARKET: BY ISOTOPE, LIFELINE CURVE
FIGURE 25 NORTH AMERICA ALPHA AND BETA EMITTERS BASED RADIOPHARMACEUTICALS MARKET: BY SOURCES, 2024
FIGURE 26 NORTH AMERICA ALPHA AND BETA EMITTERS BASED RADIOPHARMACEUTICALS MARKET: BY SOURCES, 2025 TO 2032 (USD THOUSAND)
FIGURE 27 NORTH AMERICA ALPHA AND BETA EMITTERS BASED RADIOPHARMACEUTICALS MARKET: BY SOURCES, CAGR (2025-2032)
FIGURE 28 NORTH AMERICA ALPHA AND BETA EMITTERS BASED RADIOPHARMACEUTICALS MARKET: BY SOURCES, LIFELINE CURVE
FIGURE 29 NORTH AMERICA ALPHA AND BETA EMITTERS BASED RADIOPHARMACEUTICALS MARKET: BY THERAPEUTIC APPLICATION, 2024
FIGURE 30 NORTH AMERICA ALPHA AND BETA EMITTERS BASED RADIOPHARMACEUTICALS MARKET: BY THERAPEUTIC APPLICATION, 2025 TO 2032 (USD THOUSAND)
FIGURE 31 NORTH AMERICA ALPHA AND BETA EMITTERS BASED RADIOPHARMACEUTICALS MARKET: BY THERAPEUTIC APPLICATION, CAGR (2025-2032)
FIGURE 32 NORTH AMERICA ALPHA AND BETA EMITTERS BASED RADIOPHARMACEUTICALS MARKET: BY THERAPEUTIC APPLICATION, LIFELINE CURVE
FIGURE 33 NORTH AMERICA ALPHA AND BETA EMITTERS BASED RADIOPHARMACEUTICALS MARKET: BY VECTOR TYPE, 2024
FIGURE 34 NORTH AMERICA ALPHA AND BETA EMITTERS BASED RADIOPHARMACEUTICALS MARKET: BY VECTOR TYPE, 2025 TO 2032 (USD THOUSAND)
FIGURE 35 NORTH AMERICA ALPHA AND BETA EMITTERS BASED RADIOPHARMACEUTICALS MARKET: BY VECTOR TYPE, CAGR (2025-2032)
FIGURE 36 NORTH AMERICA ALPHA AND BETA EMITTERS BASED RADIOPHARMACEUTICALS MARKET: BY VECTOR TYPE, LIFELINE CURVE
FIGURE 37 NORTH AMERICA ALPHA AND BETA EMITTERS BASED RADIOPHARMACEUTICALS MARKET: BY END USER, 2024
FIGURE 38 NORTH AMERICA ALPHA AND BETA EMITTERS BASED RADIOPHARMACEUTICALS MARKET: BY END USER, 2025 TO 2032 (USD THOUSAND)
FIGURE 39 NORTH AMERICA ALPHA AND BETA EMITTERS BASED RADIOPHARMACEUTICALS MARKET: BY END USER, CAGR (2025-2032)
FIGURE 40 NORTH AMERICA ALPHA AND BETA EMITTERS BASED RADIOPHARMACEUTICALS MARKET: BY END USER, LIFELINE CURVE
FIGURE 41 NORTH AMERICA ALPHA AND BETA EMITTERS BASED RADIOPHARMACEUTICALS MARKET: SNAPSHOT (2024)
FIGURE 42 NORTH AMERICA ALPHA AND BETA EMITTERS BASED RADIOPHARMACEUTICALS MARKET: COMPANY SHARE 2024 (%)
Data collection and base year analysis are done using data collection modules with large sample sizes. The stage includes obtaining market information or related data through various sources and strategies. It includes examining and planning all the data acquired from the past in advance. It likewise envelops the examination of information inconsistencies seen across different information sources. The market data is analysed and estimated using market statistical and coherent models. Also, market share analysis and key trend analysis are the major success factors in the market report. To know more, please request an analyst call or drop down your inquiry.
The key research methodology used by DBMR research team is data triangulation which involves data mining, analysis of the impact of data variables on the market and primary (industry expert) validation. Data models include Vendor Positioning Grid, Market Time Line Analysis, Market Overview and Guide, Company Positioning Grid, Patent Analysis, Pricing Analysis, Company Market Share Analysis, Standards of Measurement, Global versus Regional and Vendor Share Analysis. To know more about the research methodology, drop in an inquiry to speak to our industry experts.
Data Bridge Market Research is a leader in advanced formative research. We take pride in servicing our existing and new customers with data and analysis that match and suits their goal. The report can be customized to include price trend analysis of target brands understanding the market for additional countries (ask for the list of countries), clinical trial results data, literature review, refurbished market and product base analysis. Market analysis of target competitors can be analyzed from technology-based analysis to market portfolio strategies. We can add as many competitors that you require data about in the format and data style you are looking for. Our team of analysts can also provide you data in crude raw excel files pivot tables (Fact book) or can assist you in creating presentations from the data sets available in the report.


