
North America And South America Agricultural Rodenticides Market
Market Size in USD Billion
 USD
1.07 Billion
USD
1.64 Billion
2025
2033
USD
1.07 Billion
USD
1.64 Billion
2025
2033
| 2026 - 2033 | |
| USD 1.07 Billion | |
| USD 1.64 Billion | |
| % | |
|
North America and South America Agricultural Rodenticides Market Size
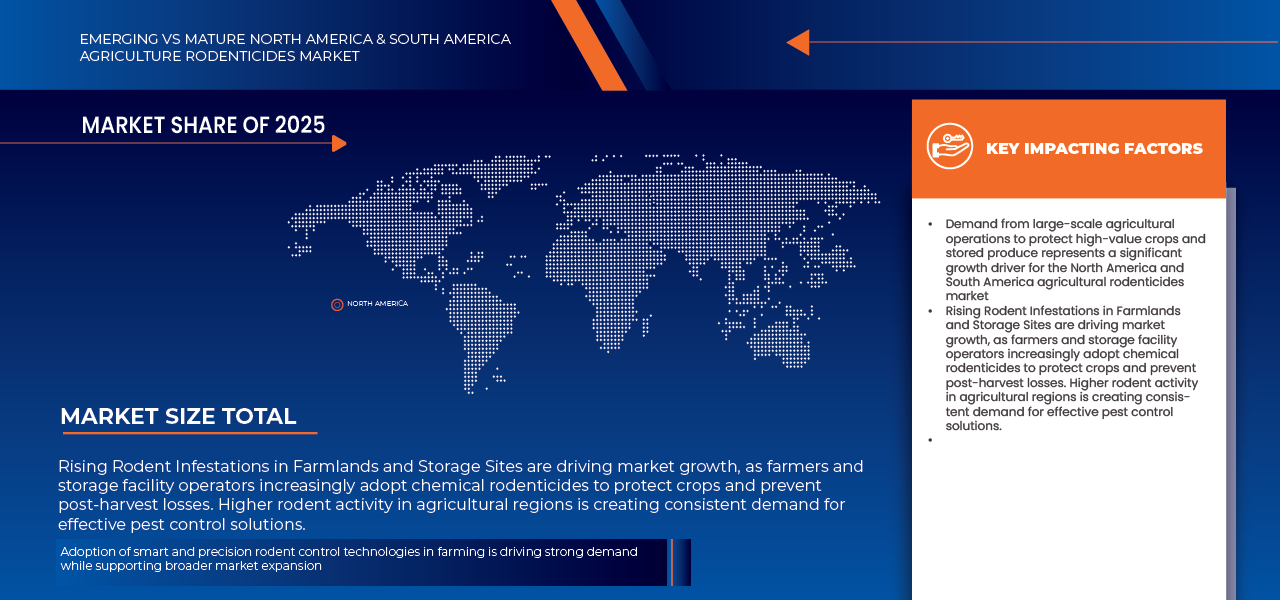
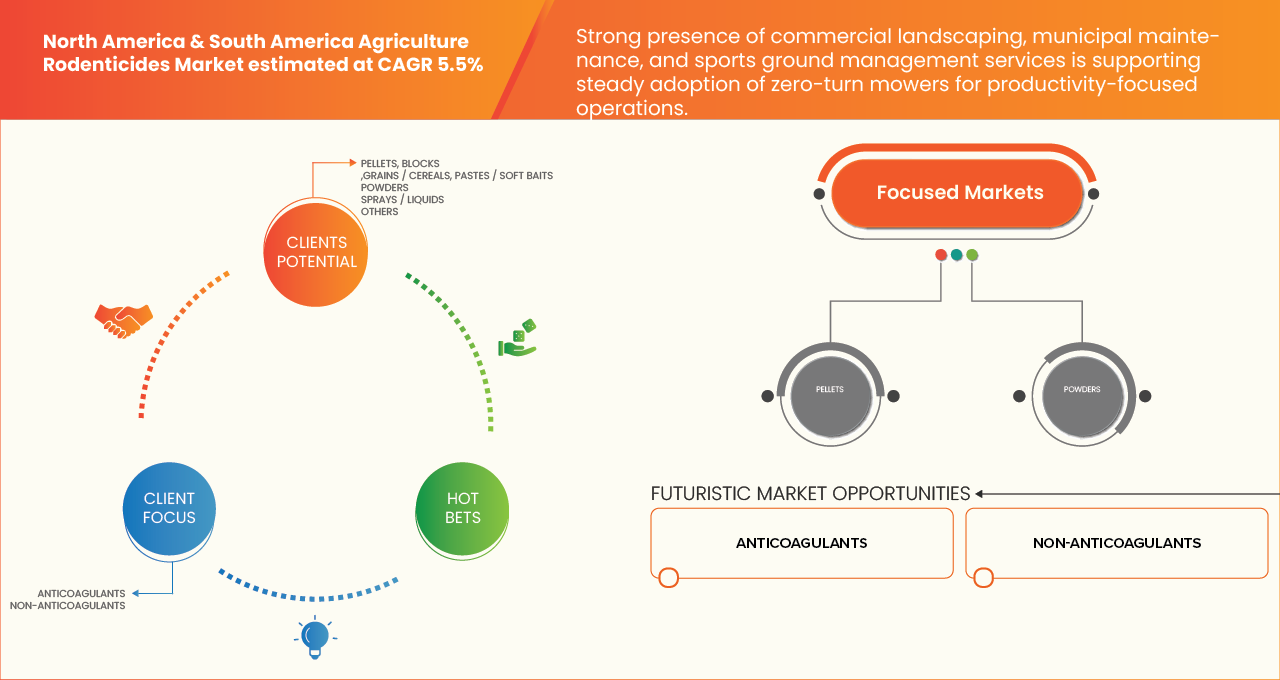
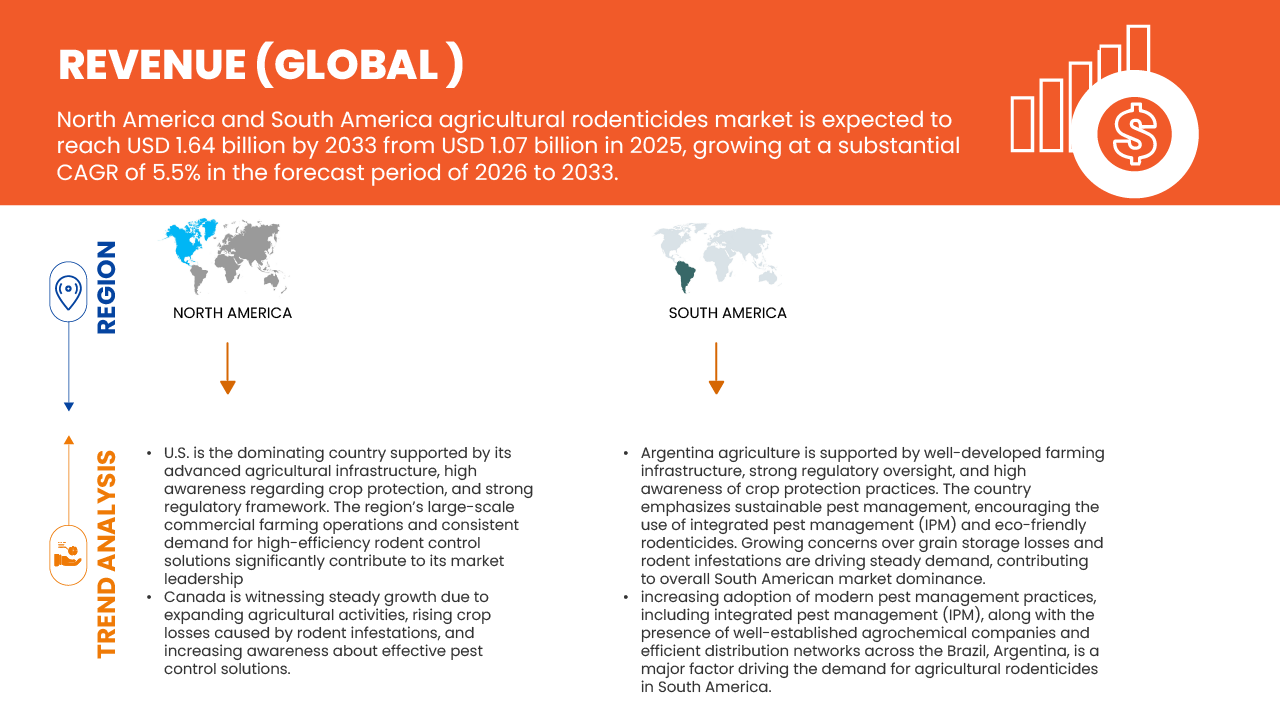
- The North America and South America agricultural rodenticides market size was valued at USD 1.07 billion in 2025 and is expected to reach USD 1.64 billion by 2033, at a CAGR of 5.5% during the forecast period
- The growth of the North America and South America Agricultural Rodenticides Market is primarily driven by increasing crop losses due to rodent infestations, rising demand for higher agricultural productivity, and expanding commercial farming activities. Government-supported pest control programs and improved awareness among farmers regarding crop protection further contribute to market expansion.
- Additionally, advancements in rodenticide formulations such as single-dose anticoagulants, eco-friendly and target-specific solutions, along with improved distribution channels and regulatory support, are shaping market growth. The rising adoption of integrated pest management (IPM) practices is also accelerating demand, supporting the overall increase in market size.
North America and South America Agricultural Rodenticides Market Analysis
- The North America and South America Agricultural Rodenticides Market encompasses the production, formulation, and application of chemical and biological rodent control solutions used to protect crops and stored grains. Market growth is driven by increasing agricultural losses due to rodent infestations, rising demand for improved crop yield and quality, and expanding commercial farming activities across the region.
- Adoption of advanced rodenticide formulations continues to increase due to innovations such as single-feed anticoagulants, eco-friendly compounds, and target-specific delivery systems. Growing emphasis on sustainable agriculture, integrated pest management (IPM) practices, and regulatory-compliant products is encouraging manufacturers to develop safer and more effective rodent control solutions.
- North America is dominating the market with the largest market share of 61.62% in 2025, supported by well-established agricultural infrastructure, high awareness regarding crop protection, and strong regulatory frameworks. Meanwhile, South America is projected to register the highest CAGR during the forecast period, driven by expanding agricultural activities, increasing pest-related crop damage, and rising adoption of modern farming practices.
- The anticoagulants segment is expected to command the largest market share of 68.81% in 2025, owing to its high efficacy, ease of application, and widespread acceptance among farmers for controlling a broad range of rodent species. Continuous product improvements and availability of second-generation anticoagulants further strengthen this segment’s dominance.
- Additionally, improvements in distribution networks, increasing government initiatives for pest control, and growing farmer awareness regarding economic losses caused by rodents are supporting market expansion. Strategic collaborations between agrochemical companies and regional distributors are further enhancing product accessibility and driving overall market growth.
Report Scope and North America and South America Agricultural Rodenticides Market Segmentation
|
Attributes |
Agricultural Rodenticides Key Market Insights |
|
Segments Covered |
|
|
Countries Covered |
North America
South America
|
|
Key Market Players |
|
|
Market Opportunities |
Integration of eco-friendly and low toxicity products in agricultural pest control programs. Development of species-specific bait technologies improving efficiency. |
|
Value Added Data Infosets |
In addition to the insights on market scenarios such as market value, growth rate, segmentation, geographical coverage, and major players, the market reports curated by the Data Bridge Market Research also include import export analysis, production capacity overview, production consumption analysis, price trend analysis, climate change scenario, supply chain analysis, value chain analysis, raw material/consumables overview, vendor selection criteria, PESTLE Analysis, Porter Analysis, and regulatory framework. |
North America and South America Agricultural Rodenticides Market Trends
“Rising Adoption of Integrated Pest Management (IPM)”
- Farmers are moving away from relying solely on rodenticides and instead adopting IPM approaches that combine chemical, biological, and mechanical control methods. This integrated strategy improves long-term rodent control while reducing dependency on continuous chemical usage.
- Under IPM practices, rodenticides are used in a more strategic and need-based manner, such as during peak infestation periods. This targeted application increases effectiveness while minimizing overuse, reducing costs, and lowering environmental impact.
- Governments and agricultural bodies across North and South America are promoting IPM to ensure sustainable farming practices. Regulations encouraging reduced chemical usage and safer pest control solutions are driving the adoption of IPM-based rodent management.
- By combining multiple pest control techniques, IPM helps in better management of rodent populations, reducing crop damage and post-harvest losses. This leads to improved yield quality and consistency, which is critical for commercial farming.
- Increased awareness through agricultural extension services, training programs, and agrochemical companies is encouraging farmers to adopt IPM practices. Knowledge about long-term economic and environmental benefits is accelerating its adoption across both developed and developing agricultural regions.
North America and South America Agricultural Rodenticides Market Dynamics
Driver
“Increasing adoption of smart and connected elevators”
- Rising rodent infestations across farmlands and agricultural storage facilities have emerged as a significant driving factor for the growth of the North and South America agricultural rodenticides market. Increasing cultivation intensity, expansion of grain storage infrastructure, and favorable climatic conditions have contributed to higher rodent population densities in major agricultural regions such as the U.S. Midwest, Brazil’s soybean belt, and Argentina’s grain-producing provinces.
- Rodents cause substantial economic losses by consuming crops during cultivation stages and contaminating stored grains through gnawing, nesting, and disease transmission. In large-scale storage environments, even minor infestations can lead to quality degradation, regulatory non-compliance, and export rejections, prompting farmers and storage operators to adopt preventive rodent control measures.
- Additionally, climate variability, including warmer winters and irregular rainfall patterns, has improved rodent survival and accelerated breeding cycles, increasing infestation frequency throughout the year. As agricultural producers increasingly prioritize yield protection and post-harvest loss reduction, consistent application of rodenticides has become an essential component of integrated pest management strategies.
- In January 2026, agricultural reports from the United States highlighted a noticeable rise in rodent activity across farms, where pests damaged stored animal feed, hay bales, and equipment kept in barns and storage areas. The concentration of food resources in these facilities created favorable conditions for rodent breeding and infestation. As a result, farmers increasingly adopted preventive pest management practices, including rodenticides. This development directly supports the market driver, as growing infestation pressure in agricultural storage infrastructure is accelerating demand for effective rodent control solutions.
- Overall, rising rodent infestations across farmlands and agricultural storage facilities are significantly strengthening demand for agricultural rodenticides across North and South America. Increasing cultivation intensity, expanding grain storage infrastructure, and climate-driven changes in rodent breeding patterns have elevated infestation risks throughout major agricultural regions. These pests not only reduce crop yields during cultivation but also contaminate stored produce, creating financial losses and compliance risks within agricultural supply chains.
Restraint/Challenge
“Stringent EPA and state-level regulations limiting certain active rodenticide chemistries”
- Stringent regulatory frameworks governing pesticide usage represent a significant restraint for the North America and South America agricultural rodenticides market, as several active ingredients are subject to strict approval, usage, and monitoring requirements. In North America, regulatory authorities such as the U.S. Environmental Protection Agency (EPA) and corresponding state agencies impose rigorous risk-assessment procedures to evaluate toxicity, environmental persistence, and potential impacts on non-target species, including birds of prey and beneficial wildlife.
- These regulations often restrict the concentration, formulation type, and application methods of anticoagulant rodenticides, increasing compliance costs for manufacturers and limiting product availability for agricultural users.
- Similarly, South American countries are progressively strengthening pesticide governance frameworks to align with international environmental and food safety standards, particularly for export-oriented agricultural commodities. Registration delays, re-evaluation of existing chemistries, and mandatory labeling and training requirements create barriers to rapid product commercialization and adoption.
- In December 2025, the U.S. Environmental Protection Agency (EPA) published a Federal Register rule under the Federal Insecticide, Fungicide, and Rodenticide Act (FIFRA) confirming the continuation of pesticide registration review and tolerance reassessment processes, where existing pesticides are re-evaluated to ensure they still meet environmental and human-health safety standards. The rule highlights that all active ingredients undergo periodic reassessment, which may result in modified usage limits or registration changes.
- Overall, stringent regulatory oversight across North and South America continues to act as a significant constraint on the agricultural rodenticides market by increasing compliance complexity and limiting the operational flexibility of both manufacturers and end users. Continuous reassessment of active ingredients, stricter application controls, evolving labeling requirements, and extended approval procedures raise development and commercialization costs while slowing product innovation cycles.
North America and South America Agricultural Rodenticides Market Scope
The North America & South America agricultural rodenticides market is segmented into notable segments based on product type and applications format.
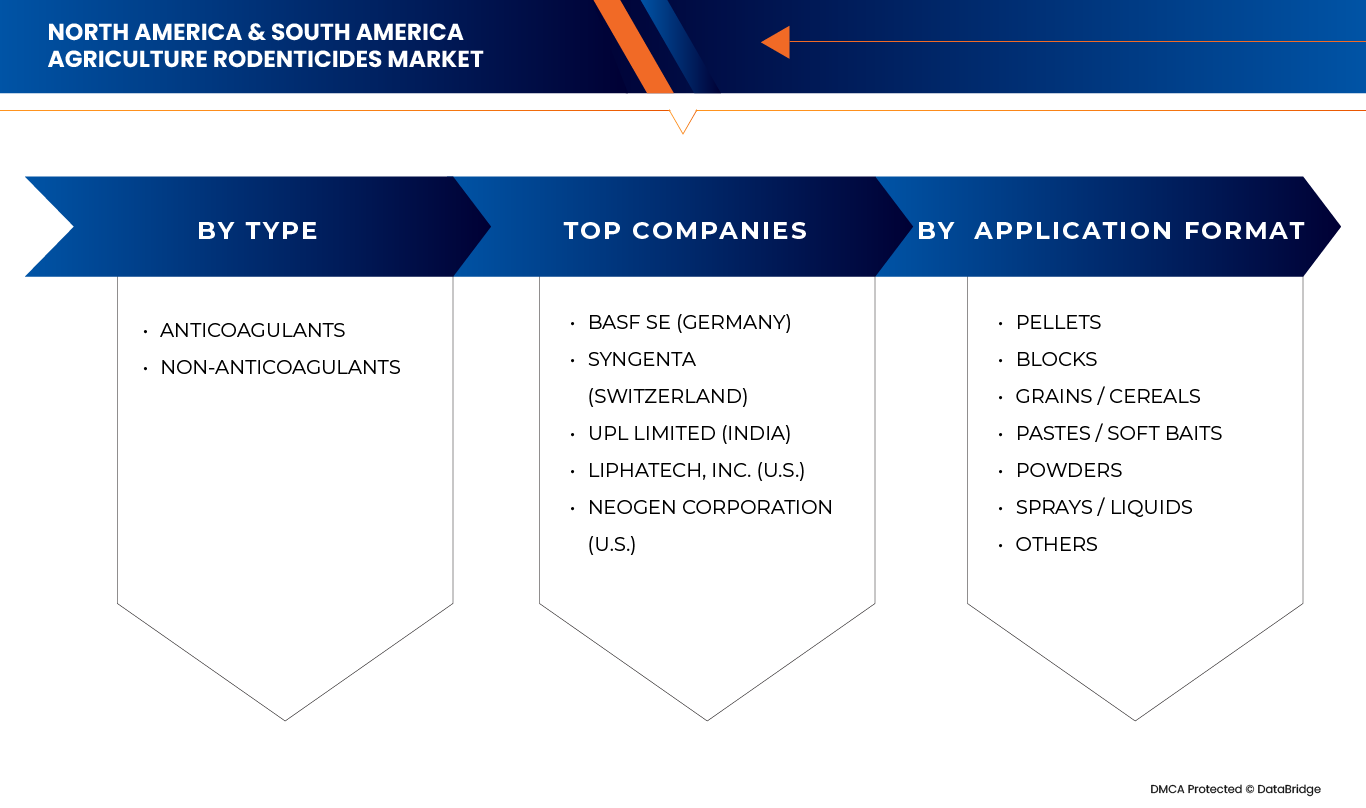
- By Type
On the basis of type, the North America & South America Agricultural Rodenticides Market is segmented into anticoagulants and non-anticoagulants. In 2025, the anticoagulants segment is expected to dominate the market with market share 69.39% due to its widespread adoption and proven effectiveness in controlling rodent populations over time. Anticoagulants, including first-generation and second-generation variants, are widely used because they prevent bait shyness and enable higher success rates in rodent control programs. Their ability to act gradually and reduce reinfestation risks makes them highly preferred across agricultural applications. The non-anticoagulants segment is also gaining traction due to their fast-acting nature and effectiveness in cases where rodents have developed resistance to anticoagulants. These products are particularly useful in targeted applications and integrated pest management (IPM) strategies, supporting their growing adoption in specific use cases.
The Non-anticoagulants segment is growing with the highest CAGR of 6.6% due to the growing demand the increasing demand for alternative rodent control solutions that address the limitations of conventional anticoagulants. Factors such as rising resistance among rodent populations to anticoagulant compounds, stricter regulatory restrictions on their usage, and growing concerns regarding secondary poisoning of non-target species are driving this shift. Non-anticoagulant rodenticides, including acute toxicants and novel mode-of-action products, offer faster results and are often preferred in resistance management strategies. Additionally, their targeted application in integrated pest management (IPM) programs and increasing awareness among farmers about sustainable and effective pest control methods are further supporting the rapid growth of this segment
- By Application Format
On the basis of applications format, the North America & South America Agricultural Rodenticides Market is segmented into pellets, blocks, grains/cereals, pastes/soft baits, powders, sprays/liquids, and others. In 2025, the pellets segment is anticipated to dominate the market with share 28.65% due to their ease of handling, uniform dosage, and wide applicability across open-field and storage conditions. Pellets are highly preferred by farmers for their convenience, effectiveness, and cost-efficiency. Blocks are also widely used, particularly in outdoor and high-moisture environments, due to their durability and resistance to weather conditions. Grains/cereals and pastes/soft baits are gaining popularity because of their high palatability, which improves bait acceptance among rodents. Powders and sprays/liquids are used in specialized applications such as burrow treatment and targeted infestations, while the others segment includes customized and emerging formulations designed for specific agricultural needs.
The Pastes / Soft Baits segment is growing at a CAGR of 6.9%, driven by their high palatability and effectiveness in attracting rodents compared to traditional pellet or grain-based formulations. These baits are particularly suitable for agricultural environments with abundant food sources, as their soft texture and strong aroma improve consumption rates. Additionally, their ease of application in hard-to-reach areas such as burrows and storage facilities enhances their practicality for farmers. The segment is also benefiting from increasing demand for ready-to-use and moisture-resistant formulations, along with compatibility with integrated pest management (IPM) practices. Growing awareness of efficient and targeted rodent control solutions is further supporting the adoption of pastes and soft baits in the agricultural sector.
North America and South America Agricultural Rodenticides Market Regional Analysis
- North America is the dominating region with market share 61.62% in 2025, in the North America and South America Agricultural Rodenticides Market, supported by its advanced agricultural infrastructure, high awareness regarding crop protection, and strong regulatory framework. The region’s large-scale commercial farming operations and consistent demand for high-efficiency rodent control solutions significantly contribute to its market leadership.
- The increasing adoption of modern pest management practices, including integrated pest management (IPM), along with the presence of well-established agrochemical companies and efficient distribution networks across the United States and Canada, is a major factor driving the demand for agricultural rodenticides in North America.
- South America is witnessing steady growth due to expanding agricultural activities in countries such as Brazil and Argentina, rising crop losses caused by rodent infestations, and increasing awareness about effective pest control solutions. The modernization of farming practices and improving access to agrochemicals are further accelerating the adoption of rodenticides across the region.
U.S. Agricultural Rodenticides Market Insight
The U.S. plays a crucial role in the North America and South America Agricultural Rodenticides Market, driven by its advanced agricultural practices, large-scale commercial farming, and strong regulatory framework. High awareness of crop protection and widespread adoption of integrated pest management (IPM) strategies support demand. Additionally, the presence of leading agrochemical companies and well-established distribution networks further strengthens market growth.
Canada Agricultural Rodenticides Market Insight
Canada’s agricultural rodenticides market is supported by well-developed farming infrastructure, strong regulatory oversight, and high awareness of crop protection practices. The country emphasizes sustainable pest management, encouraging the use of integrated pest management (IPM) and eco-friendly rodenticides. Growing concerns over grain storage losses and rodent infestations are driving steady demand, contributing to overall North American market dominance.
Brazil Agricultural Rodenticides Market Insight
Brazil plays a crucial role in the North and South America Agricultural Rodenticides Market, driven by its large-scale agricultural production and rising crop losses due to rodent infestations. Increasing adoption of modern farming practices and pest control solutions is boosting demand. Additionally, growing awareness among farmers and improving distribution networks are further supporting market expansion in the country.
Argentina Agricultural Rodenticides Market Insight
Argentina plays a crucial role in the North and South America Agricultural Rodenticides Market, driven by its large-scale agricultural production and rising crop losses due to rodent infestations. Increasing adoption of modern farming practices and pest control solutions is boosting demand. Additionally, growing awareness among farmers and improving distribution networks are further supporting market expansion in the country.
North America and South America Agricultural Rodenticides Market Share
The North America and South America Agricultural Rodenticides Market is primarily led by well-established companies, including:
- UPL Limited (India)
- Neogen Corporation (U.S.)
- Syngenta Crop Protection AG (Switzerland)
- Liphatech Inc. (U.S.)
- BASF SE (Germany)
- ENVU (Environmental Science U.S. LLC) (U.S.)
- Bell Laboratories Inc (U.S.)
- PelGar International (U.K.)
- J.T. Eaton & Co., Inc (U.S.)
- Impex Europa S.L (Spain)
- LANXESS (Germany)
- Jubaili Agrotec (Lebanon)
- Ensystex (U.S.)
- Bequisa (Spain)
- Kaput Products (U.S.)
- Chemotecnica S.A. (Argentina)
- JIMO QUÍMICA INDUSTRIAL LTDA (Brazil)
Latest Developments in North America and South America Agricultural Rodenticides Market
- In November 2023, BASF SE has introduced a new non-toxic Monitoring Paste designed for the early detection of rodent activity as part of an integrated pest management approach. The product is formulated without active rodenticides and is intended to help pest management professionals identify rodent presence before infestations escalate. The Monitoring Paste enhances inspection and monitoring efficiency.
- In February 2026, UPL Limited has approved a major group restructuring plan to integrate its specific and international crop protection businesses into a single unified entity, UPL Global Sustainable Agri Solutions, aiming to create a focused, pure-play global crop protection platform. The scheme of arrangement involving mergers and demergers of key subsidiaries is expected to simplify the group structure, unlock shareholder value.
- In May 2025, Liphatech Inc. now offers its professional rodenticide Resolv in a new mini block formulation, expanding options for pest management professionals. Launched in May, the Resolv mini blocks contain the active ingredient bromadiolone and are designed for effective control of roof rats, house mice, and Norway rats including warfarin-resistant strains with durability for indoor and outdoor use.
- In August 2020, Neogen expanded its presence in the UK by launching a range of rodent control products through a distribution partnership, beginning in September 2020. The offering includes established rodenticides such as Tomcat Blox and Jaguar Blox, along with bait stations and related pest management solutions for agricultural and farm use.
- In October 2025, Bell Laboratories announced an updated version of its DETEX Soft Bait, featuring an improved oil-based formulation and new packaging in resealable 4-lb bags. The monitoring bait is designed to enhance palatability and withstand extreme climates, helping pest professionals track rodent activity before applying rodenticide treatments. The product incorporates Lumitrack, which makes rodent droppings glow under UV light to aid detection.
SKU-

- Interactive Data Analysis Dashboard
- Company Analysis Dashboard for high growth potential opportunities
- Research Analyst Access for customization & queries
- Competitor Analysis with Interactive dashboard
- Latest News, Updates & Trend analysis
- Harness the Power of Benchmark Analysis for Comprehensive Competitor Tracking
Table of Content
1 INTRODUCTION
1.1 OBJECTIVES OF THE STUDY
1.2 MARKET DEFINITION
1.3 OVERVIEW OF NORTH AMERICA & SOUTH AMERICA AGRICULTURAL RODENTICIDES MARKET
1.4 CURRENCY AND PRICING
1.5 LIMITATIONS
1.6 MARKETS COVERED
2 MARKET SEGMENTATION
2.1 MARKETS COVERED
2.2 GEOGRAPHICAL SCOPE
2.3 YEARS CONSIDERED FOR THE STUDY
2.4 DBMR TRIPOD DATA VALIDATION MODEL
2.5 PRIMARY INTERVIEWS WITH KEY OPINION LEADERS
2.6 DBMR MARKET POSITION GRID
2.7 VENDOR SHARE ANALYSIS
2.8 MULTIVARIATE MODELING
2.9 PRODUCT TYPE TIMELINE CURVE
2.1 MARKET APPLICATION COVERAGE GRID
2.11 SECONDARY SOURCES
2.12 ASSUMPTIONS
3 EXECUTIVE SUMMARY
4 PREMIUM INSIGHTS
4.1 PORTER’S FIVE FORCES ANALYSIS
4.1.1 OVERVIEW OF COMPETITIVE STRUCTURE
4.1.2 THREAT OF NEW ENTRANTS; LOW
4.1.3 BARGAINING POWER OF SUPPLIERS; MEDIUM
4.1.4 BARGAINING POWER OF BUYERS; MEDIUM TO HIGH
4.1.5 THREAT OF SUBSTITUTES; MEDIUM
4.1.6 COMPETITIVE RIVALRY; HIGH
4.1.7 CONCLUSION
4.2 COMPANY COMPARATIVE ANALYSIS
4.3 TECHNOLOGICAL TRENDS
4.3.1 ADVANCEMENT IN LOW-TOXICITY AND ECO-FRIENDLY FORMULATIONS
4.3.2 CONTROLLED RELEASE AND ENCAPSULATION TECHNOLOGIES
4.3.3 PRECISION AGRICULTURE INTEGRATION AND SMART BAITING SYSTEMS
4.3.4 ADOPTION OF INTEGRATED PEST MANAGEMENT (IPM) TECHNOLOGIES
4.3.5 ENHANCED BAIT FORMULATION AND ATTRACTANT TECHNOLOGIES
4.3.6 CONCLUSION
4.4 VALUE CHAIN ANALYSIS
4.4.1 OVERVIEW
4.4.2 RAW MATERIAL SOURCING AND CHEMICAL INPUTS
4.4.3 MANUFACTURING AND FORMULATION PROCESSES
4.4.4 REGULATORY COMPLIANCE AND PRODUCT REGISTRATION
4.4.5 DISTRIBUTION AND SUPPLY CHAIN NETWORKS
4.4.6 END-USE APPLICATION IN AGRICULTURE
4.4.7 WASTE MANAGEMENT AND ENVIRONMENTAL CONSIDERATIONS
4.4.8 VALUE CHAIN INTEGRATION AND STRATEGIC IMPLICATIONS
5 REGULATION COVERAGE
5.1 OVERVIEW OF REGULATORY LANDSCAPE
5.2 UNITED STATES; FEDERAL OVERSIGHT AND RISK MITIGATION FRAMEWORK
5.3 CANADA; INTEGRATED PEST MANAGEMENT AND ENVIRONMENTAL SAFEGUARDS
5.4 MEXICO; ALIGNMENT WITH INTERNATIONAL STANDARDS
5.5 BRAZIL; EXPANDING REGULATORY ENFORCEMENT IN AGRICULTURAL CHEMICALS
5.6 ARGENTINA; NATIONAL CONTROLS AND AGRICULTURAL USAGE POLICIES
5.7 CHILE AND OTHER SOUTH AMERICAN MARKETS; PROGRESSIVE REGULATORY DEVELOPMENT
5.8 ENVIRONMENTAL PROTECTION AND WILDLIFE CONSERVATION CONSIDERATIONS
5.9 TRADE POLICIES AND CROSS BORDER REGULATORY HARMONIZATION
5.1 COMPLIANCE, LABELING, AND STEWARDSHIP REQUIREMENTS
5.11 CONCLUSION; REGULATORY INFLUENCE ON MARKET DYNAMICS
6 MARKET OVERVIEW
6.1 DRIVERS
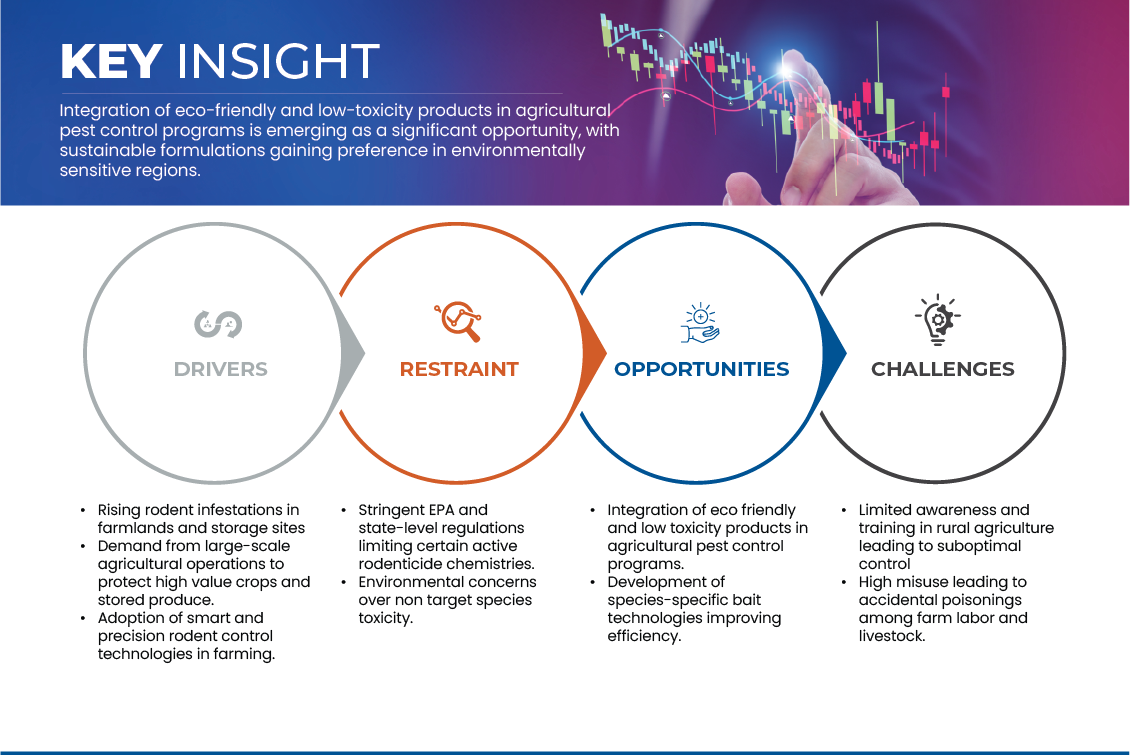
6.1.1 RISING RODENT INFESTATIONS IN FARMLANDS AND STORAGE SITES
6.1.2 DEMAND FROM LARGE-SCALE AGRICULTURAL OPERATIONS TO PROTECT HIGH VALUE CROPS AND STORED PRODUCE
6.1.3 ADOPTION OF SMART AND PRECISION RODENT CONTROL TECHNOLOGIES IN FARMING
6.2 RESTRAINTS
6.2.1 STRINGENT EPA AND STATE-LEVEL REGULATIONS LIMITING CERTAIN ACTIVE RODENTICIDE CHEMISTRIES
6.2.2 ENVIRONMENTAL CONCERNS OVER NON-TARGET SPECIES TOXICITY
6.3 OPPORTUNITIES
6.3.1 INTEGRATION OF ECO-FRIENDLY AND LOW TOXICITY PRODUCTS IN AGRICULTURAL PEST CONTROL PROGRAMS
6.3.2 DEVELOPMENT OF SPECIES-SPECIFIC BAIT TECHNOLOGIES IMPROVING EFFICIENCY
6.4 CHALLENGES
6.4.1 LIMITED AWARENESS AND TRAINING IN RURAL AGRICULTURE LEADING TO SUBOPTIMAL CONTROL
6.4.2 HIGH MISUSE LEADING TO ACCIDENTAL POISONINGS AMONG FARM LABOR AND LIVESTOCK
7 NORTH AMERICA AND SOUTH AMERICA AGRICULTURAL RODENTICIDES MARKET, BY TYPE
7.1 OVERVIEW
7.2 ANTICOAGULANTS
7.3 NON-ANTICOAGULANTS
7.4 NORTH AMERICA & SOUTH AMERICA ANTICOAGULANTS IN AGRICULTURAL RODENTICIDES MARKET, BY TYPE, 2018-2033 (USD THOUSAND)
7.4.1 SECOND-GENERATION
7.4.2 FIRST-GENERATION
7.5 NORTH AMERICA & SOUTH AMERICA SECOND-GENERATION IN AGRICULTURAL RODENTICIDES MARKET, BY TYPE, 2018-2033 (USD THOUSAND)
7.5.1 BRODIFACOUM
7.5.2 BROMADIOLONE
7.5.3 DIFENACOUM
7.5.4 DIFETHIALONE
7.5.5 FLOCOUMAFEN
7.6 NORTH AMERICA & SOUTH AMERICA FIRST-GENERATION IN AGRICULTURAL RODENTICIDES MARKET, BY TYPE, 2018-2033 (USD THOUSAND)
7.6.1 CHLOROPHACINONE
7.6.2 DIPHACINONE
7.6.3 WARFARIN
7.6.4 COUMATETRALYL
7.6.5 OTHERS
7.7 NORTH AMERICA & SOUTH AMERICA ANTICOAGULANTS IN AGRICULTURAL RODENTICIDES MARKET, BY REGION, 2018-2033 (USD THOUSAND)
7.7.1 NORTH AMERICA
7.7.2 SOUTH AMERICA
7.8 NORTH AMERICA & SOUTH AMERICA NON-ANTICOAGULANTS IN AGRICULTURAL RODENTICIDES MARKET, BY REGION, 2018-2033 (USD THOUSAND)
7.8.1 NORTH AMERICA
7.8.2 SOUTH AMERICA
8 NORTH AMERICA AND SOUTH AMERICA AGRICULTURAL RODENTICIDES MARKET, BY APPLICATION FORMAT
8.1 OVERVIEW
8.2 PELLETS
8.3 BLOCKS
8.4 GRAINS / CEREALS
8.5 PASTES / SOFT BAITS
8.6 POWDERS
8.7 SPRAYS / LIQUIDS
8.8 OTHERS
8.9 NORTH AMERICA & SOUTH AMERICA PELLETS IN AGRICULTURAL RODENTICIDES MARKET, BY REGION, 2018-2033 (USD THOUSAND)
8.9.1 NORTH AMERICA
8.9.2 SOUTH AMERICA
8.1 NORTH AMERICA & SOUTH AMERICA BLOCKS IN AGRICULTURAL RODENTICIDES MARKET, BY REGION, 2018-2033 (USD THOUSAND)
8.10.1 NORTH AMERICA
8.10.2 SOUTH AMERICA
8.11 NORTH AMERICA & SOUTH AMERICA GRAINS / CEREALS IN AGRICULTURAL RODENTICIDES MARKET, BY REGION, 2018-2033 (USD THOUSAND)
8.11.1 NORTH AMERICA
8.11.2 SOUTH AMERICA
8.12 NORTH AMERICA & SOUTH AMERICA PASTES / SOFT BAITS IN AGRICULTURAL RODENTICIDES MARKET, BY REGION, 2018-2033 (USD THOUSAND)
8.12.1 NORTH AMERICA
8.12.2 SOUTH AMERICA
8.13 NORTH AMERICA & SOUTH AMERICA POWDERS IN AGRICULTURAL RODENTICIDES MARKET, BY REGION, 2018-2033 (USD THOUSAND)
8.13.1 NORTH AMERICA
8.13.2 SOUTH AMERICA
8.14 NORTH AMERICA & SOUTH AMERICA SPRAYS / LIQUIDS IN AGRICULTURAL RODENTICIDES MARKET, BY REGION, 2018-2033 (USD THOUSAND)
8.14.1 NORTH AMERICA
8.14.2 SOUTH AMERICA
8.15 NORTH AMERICA & SOUTH AMERICA OTHERS IN AGRICULTURAL RODENTICIDES MARKET, BY REGION, 2018-2033 (USD THOUSAND)
8.15.1 NORTH AMERICA
8.15.2 SOUTH AMERICA
9 NORTH AMERICA AND SOUTH AMERICA AGRICULTURAL RODENTICIDES MARKET, BY REGION
9.1 OVERVIEW
9.2 NORTH AMERICA
9.2.1 U.S.
9.2.2 MEXICO
9.2.3 CANADA
9.3 SOUTH AMERICA
9.3.1 BRAZIL
9.3.2 ARGENTINA
9.3.3 REST OF SOUTH AMERICA
10 NORTH AMERICA & SOUTH AMERICA AGRICULTURAL RODENTICIDES MARKET: COMPANY LANDSCAPE
10.1 COMPANY SHARE ANALYSIS: NORTH AMERICA & SOUTH AMERICA
11 SWOT ANALYSIS
12 COMPANY PROFILES
12.1 BASF SE
12.1.1 COMPANY SNAPSHOT
12.1.2 REVENUE ANALYSIS
12.1.3 PRODUCT PORTFOLIO
12.1.4 RECENT DEVELOPMENT
12.2 SYNGENTA
12.2.1 COMPANY SNAPSHOT
12.2.2 PRODUCT PORTFOLIO
12.2.3 RECENT DEVELOPMENT
12.3 UPL LIMITED
12.3.1 COMPANY SNAPSHOT
12.3.2 REVENUE ANALYSIS
12.3.3 PRODUCT PORTFOLIO
12.3.4 RECENT DEVELOPMENT
12.4 LIPHATECH, INC.
12.4.1 COMPANY SNAPSHOT
12.4.2 PRODUCT PORTFOLIO
12.4.3 RECENT DEVELOPMENT
12.5 NEOGEN CORPORATION
12.5.1 COMPANY SNAPSHOT
12.5.2 REVENUE ANALYSIS
12.5.3 PRODUCT PORTFOLIO
12.5.4 RECENT DEVELOPMENT
12.6 BELL LABORATORIES, INC.
12.6.1 COMPANY SNAPSHOT
12.6.2 PRODUCT PORTFOLIO
12.6.3 RECENT DEVELOPMENT
12.7 BEQUISA
12.7.1 COMPANY SNAPSHOT
12.7.2 PRODUCT PORTFOLIO
12.7.3 RECENT DEVELOPMENT
12.8 CHEMOTECNICA S.A.
12.8.1 COMPANY SNAPSHOT
12.8.2 PRODUCT PORTFOLIO
12.8.3 8.3 RECENT DEVELOPMENT
12.9 ENSYSTEX.
12.9.1 COMPANY SNAPSHOT
12.9.2 PRODUCT PORTFOLIO
12.9.3 RECENT DEVELOPMENT
12.1 ENVU
12.10.1 COMPANY SNAPSHOT
12.10.2 PRODUCT PORTFOLIO
12.10.3 RECENT DEVELOPMENT
12.11 IMPEX EUROPA S.L.
12.11.1 COMPANY SNAPSHOT
12.11.2 PRODUCT PORTFOLIO
12.11.3 RECENT DEVELOPMENT
12.12 JIMO QUÍMICA INDUSTRIAL LTDA
12.12.1 COMPANY SNAPSHOT
12.12.2 PRODUCT PORTFOLIO
12.12.3 RECENT DEVELOPMENT
12.13 J.T. EATON & CO., INC
12.13.1 COMPANY SNAPSHOT
12.13.2 PRODUCT PORTFOLIO
12.13.3 RECENT DEVELOPMENT
12.14 JUBAILI AGROTEC
12.14.1 COMPANY SNAPSHOT
12.14.2 PRODUCT PORTFOLIO
12.14.3 RECENT DEVELOPMENT
12.15 KAPUT
12.15.1 COMPANY SNAPSHOT
12.15.2 PRODUCT PORTFOLIO
12.15.3 RECENT DEVELOPMENT
12.16 LANXESS AG
12.16.1 COMPANY SNAPSHOT
12.16.2 REVENUE ANALYSIS
12.16.3 PRODUCT PORTFOLIO
12.16.4 RECENT DEVELOPMENT
12.17 PELGAR INTERNATIONAL
12.17.1 COMPANY SNAPSHOT
12.17.2 PRODUCT PORTFOLIO
12.17.3 RECENT DEVELOPMENT
13 QUESTIONNAIRE
14 RELATED REPORTS
List of Table
TABLE 1 VALUE CHAIN ANALYSIS
TABLE 2 NORTH AMERICA & SOUTH AMERICA AGRICULTURAL RODENTICIDES MARKET, BY TYPE, 2018-2033 (USD THOUSAND)
TABLE 3 NORTH AMERICA & SOUTH AMERICA AGRICULTURAL RODENTICIDES MARKET, BY TYPE, 2018-2033 (TONS)
TABLE 4 NORTH AMERICA & SOUTH AMERICA ANTICOAGULANTS IN AGRICULTURAL RODENTICIDES MARKET, BY TYPE, 2018-2033 (USD THOUSAND)
TABLE 5 NORTH AMERICA & SOUTH AMERICA ANTICOAGULANTS IN AGRICULTURAL RODENTICIDES MARKET, BY TYPE, 2018-2033 (TONS)
TABLE 6 NORTH AMERICA & SOUTH AMERICA SECOND-GENERATION IN AGRICULTURAL RODENTICIDES MARKET, BY TYPE, 2018-2033 (USD THOUSAND)
TABLE 7 NORTH AMERICA & SOUTH AMERICA SECOND-GENERATION IN AGRICULTURAL RODENTICIDES MARKET, BY TYPE, 2018-2033 (TONS)
TABLE 8 NORTH AMERICA & SOUTH AMERICA FIRST-GENERATION IN AGRICULTURAL RODENTICIDES MARKET, BY TYPE, 2018-2033 (USD THOUSAND)
TABLE 9 NORTH AMERICA & SOUTH AMERICA FIRST-GENERATION IN AGRICULTURAL RODENTICIDES MARKET, BY TYPE, 2018-2033 (TONS)
TABLE 10 NORTH AMERICA & SOUTH AMERICA ANTICOAGULANTS IN AGRICULTURAL RODENTICIDES MARKET, BY REGION, 2018-2033 (USD THOUSAND)
TABLE 11 NORTH AMERICA & SOUTH AMERICA ANTICOAGULANTS IN AGRICULTURAL RODENTICIDES MARKET, BY REGION, 2018-2033 (TONS)
TABLE 12 NORTH AMERICA & SOUTH AMERICA NON-ANTICOAGULANTS IN AGRICULTURAL RODENTICIDES MARKET, BY REGION, 2018-2033 (USD THOUSAND)
TABLE 13 NORTH AMERICA & SOUTH AMERICA NON-ANTICOAGULANTS IN AGRICULTURAL RODENTICIDES MARKET, BY REGION, 2018-2033 (TONS)
TABLE 14 NORTH AMERICA & SOUTH AMERICA AGRICULTURAL RODENTICIDES MARKET, BY APPLICATIONS FORMAT, 2018-2033 (USD THOUSAND)
TABLE 15 NORTH AMERICA & SOUTH AMERICA AGRICULTURAL RODENTICIDES MARKET, BY APPLICATIONS FORMAT, 2018-2033 (TONS)
TABLE 16 NORTH AMERICA & SOUTH AMERICA PELLETS IN AGRICULTURAL RODENTICIDES MARKET, BY REGION, 2018-2033 (USD THOUSAND)
TABLE 17 NORTH AMERICA & SOUTH AMERICA PELLETS IN AGRICULTURAL RODENTICIDES MARKET, BY REGION, 2018-2033 (TONS)
TABLE 18 NORTH AMERICA & SOUTH AMERICA BLOCKS IN AGRICULTURAL RODENTICIDES MARKET, BY REGION, 2018-2033 (USD THOUSAND)
TABLE 19 NORTH AMERICA & SOUTH AMERICA BLOCKS IN AGRICULTURAL RODENTICIDES MARKET, BY REGION, 2018-2033 (TONS)
TABLE 20 NORTH AMERICA & SOUTH AMERICA GRAINS / CEREALS IN AGRICULTURAL RODENTICIDES MARKET, BY REGION, 2018-2033 (USD THOUSAND)
TABLE 21 NORTH AMERICA & SOUTH AMERICA GRAINS / CEREALS IN AGRICULTURAL RODENTICIDES MARKET, BY REGION, 2018-2033 (TONS)
TABLE 22 NORTH AMERICA & SOUTH AMERICA PASTES / SOFT BAITS IN AGRICULTURAL RODENTICIDES MARKET, BY REGION, 2018-2033 (USD THOUSAND)
TABLE 23 NORTH AMERICA & SOUTH AMERICA PASTES / SOFT BAITS IN AGRICULTURAL RODENTICIDES MARKET, BY REGION, 2018-2033 (TONS)
TABLE 24 NORTH AMERICA & SOUTH AMERICA POWDERS IN AGRICULTURAL RODENTICIDES MARKET, BY REGION, 2018-2033 (USD THOUSAND)
TABLE 25 NORTH AMERICA & SOUTH AMERICA POWDERS IN AGRICULTURAL RODENTICIDES MARKET, BY REGION, 2018-2033 (TONS)
TABLE 26 NORTH AMERICA & SOUTH AMERICA SPRAYS / LIQUIDS IN AGRICULTURAL RODENTICIDES MARKET, BY REGION, 2018-2033 (USD THOUSAND)
TABLE 27 NORTH AMERICA & SOUTH AMERICA SPRAYS / LIQUIDS IN AGRICULTURAL RODENTICIDES MARKET, BY REGION, 2018-2033 (TONS)
TABLE 28 NORTH AMERICA & SOUTH AMERICA OTHERS IN AGRICULTURAL RODENTICIDES MARKET, BY REGION, 2018-2033 (USD THOUSAND)
TABLE 29 NORTH AMERICA & SOUTH AMERICA OTHERS IN AGRICULTURAL RODENTICIDES MARKET, BY REGION, 2018-2033 (TONS)
TABLE 30 NORTH AMERICA & SOUTH AMERICA AGRICULTURAL RODENTICIDES MARKET, BY REGION, 2018-2033 (USD THOUSAND)
TABLE 31 NORTH AMERICA & SOUTH AMERICA AGRICULTURAL RODENTICIDES MARKET, BY REGION, 2018-2033 (TONS)
TABLE 32 NORTH AMERICA & SOUTH AMERICA AGRICULTURAL RODENTICIDES MARKET, BY TYPE, 2018-2033 (USD THOUSAND)
TABLE 33 NORTH AMERICA & SOUTH AMERICA AGRICULTURAL RODENTICIDES MARKET, BY TYPE, 2018-2033 (TONS)
TABLE 34 NORTH AMERICA & SOUTH AMERICA ANTICOAGULANTS IN AGRICULTURAL RODENTICIDES MARKET, BY TYPE, 2018-2033 (USD THOUSAND)
TABLE 35 NORTH AMERICA & SOUTH AMERICA ANTICOAGULANTS IN AGRICULTURAL RODENTICIDES MARKET, BY TYPE, 2018-2033 (TONS)
TABLE 36 NORTH AMERICA & SOUTH AMERICA SECOND-GENERATION IN AGRICULTURAL RODENTICIDES MARKET, BY TYPE, 2018-2033 (USD THOUSAND)
TABLE 37 NORTH AMERICA & SOUTH AMERICA SECOND-GENERATION IN AGRICULTURAL RODENTICIDES MARKET, BY TYPE, 2018-2033 (TONS)
TABLE 38 NORTH AMERICA & SOUTH AMERICA FIRST-GENERATION IN AGRICULTURAL RODENTICIDES MARKET, BY TYPE, 2018-2033 (USD THOUSAND)
TABLE 39 NORTH AMERICA & SOUTH AMERICA FIRST-GENERATION IN AGRICULTURAL RODENTICIDES MARKET, BY TYPE, 2018-2033 (TONS)
TABLE 40 NORTH AMERICA & SOUTH AMERICA ANTICOAGULANTS IN AGRICULTURAL RODENTICIDES MARKET, BY REGION, 2018-2033 (USD THOUSAND)
TABLE 41 NORTH AMERICA & SOUTH AMERICA ANTICOAGULANTS IN AGRICULTURAL RODENTICIDES MARKET, BY REGION, 2018-2033 (TONS)
TABLE 42 NORTH AMERICA & SOUTH AMERICA NON-ANTICOAGULANTS IN AGRICULTURAL RODENTICIDES MARKET, BY REGION, 2018-2033 (USD THOUSAND)
TABLE 43 NORTH AMERICA & SOUTH AMERICA NON-ANTICOAGULANTS IN AGRICULTURAL RODENTICIDES MARKET, BY REGION, 2018-2033 (TONS)
TABLE 44 NORTH AMERICA & SOUTH AMERICA AGRICULTURAL RODENTICIDES MARKET, BY APPLICATIONS FORMAT, 2018-2033 (USD THOUSAND)
TABLE 45 NORTH AMERICA & SOUTH AMERICA AGRICULTURAL RODENTICIDES MARKET, BY APPLICATIONS FORMAT, 2018-2033 (TONS)
TABLE 46 NORTH AMERICA & SOUTH AMERICA PELLETS IN AGRICULTURAL RODENTICIDES MARKET, BY REGION, 2018-2033 (USD THOUSAND)
TABLE 47 NORTH AMERICA & SOUTH AMERICA PELLETS IN AGRICULTURAL RODENTICIDES MARKET, BY REGION, 2018-2033 (TONS)
TABLE 48 NORTH AMERICA & SOUTH AMERICA BLOCKS IN AGRICULTURAL RODENTICIDES MARKET, BY REGION, 2018-2033 (USD THOUSAND)
TABLE 49 NORTH AMERICA & SOUTH AMERICA BLOCKS IN AGRICULTURAL RODENTICIDES MARKET, BY REGION, 2018-2033 (TONS)
TABLE 50 NORTH AMERICA & SOUTH AMERICA GRAINS / CEREALS IN AGRICULTURAL RODENTICIDES MARKET, BY REGION, 2018-2033 (USD THOUSAND)
TABLE 51 NORTH AMERICA & SOUTH AMERICA GRAINS / CEREALS IN AGRICULTURAL RODENTICIDES MARKET, BY REGION, 2018-2033 (TONS)
TABLE 52 NORTH AMERICA & SOUTH AMERICA PASTES / SOFT BAITS IN AGRICULTURAL RODENTICIDES MARKET, BY REGION, 2018-2033 (USD THOUSAND)
TABLE 53 NORTH AMERICA & SOUTH AMERICA PASTES / SOFT BAITS IN AGRICULTURAL RODENTICIDES MARKET, BY REGION, 2018-2033 (TONS)
TABLE 54 NORTH AMERICA & SOUTH AMERICA POWDERS IN AGRICULTURAL RODENTICIDES MARKET, BY REGION, 2018-2033 (USD THOUSAND)
TABLE 55 NORTH AMERICA & SOUTH AMERICA POWDERS IN AGRICULTURAL RODENTICIDES MARKET, BY REGION, 2018-2033 (TONS)
TABLE 56 NORTH AMERICA & SOUTH AMERICA SPRAYS / LIQUIDS IN AGRICULTURAL RODENTICIDES MARKET, BY REGION, 2018-2033 (USD THOUSAND)
TABLE 57 NORTH AMERICA & SOUTH AMERICA SPRAYS / LIQUIDS IN AGRICULTURAL RODENTICIDES MARKET, BY REGION, 2018-2033 (TONS)
TABLE 58 NORTH AMERICA & SOUTH AMERICA OTHERS IN AGRICULTURAL RODENTICIDES MARKET, BY REGION, 2018-2033 (USD THOUSAND)
TABLE 59 NORTH AMERICA & SOUTH AMERICA OTHERS IN AGRICULTURAL RODENTICIDES MARKET, BY REGION, 2018-2033 (TONS)
TABLE 60 NORTH AMERICA AGRICULTURAL RODENTICIDES MARKET, BY COUNTRY, 2018-2033 (USD THOUSAND)
TABLE 61 NORTH AMERICA AGRICULTURAL RODENTICIDES MARKET, BY COUNTRY, 2018-2033 (TONS)
TABLE 62 NORTH AMERICA AGRICULTURAL RODENTICIDES MARKET, BY TYPE, 2018-2033 (USD THOUSAND)
TABLE 63 NORTH AMERICA AGRICULTURAL RODENTICIDES MARKET, BY TYPE, 2018-2033 (TONS)
TABLE 64 NORTH AMERICA ANTICOAGULANTS IN AGRICULTURAL RODENTICIDES MARKET, BY TYPE, 2018-2033 (USD THOUSAND)
TABLE 65 NORTH AMERICA ANTICOAGULANTS IN AGRICULTURAL RODENTICIDES MARKET, BY TYPE, 2018-2033 (TONS)
TABLE 66 NORTH AMERICA SECOND-GENERATION IN AGRICULTURAL RODENTICIDES MARKET, BY TYPE, 2018-2033 (USD THOUSAND)
TABLE 67 NORTH AMERICA SECOND-GENERATION IN AGRICULTURAL RODENTICIDES MARKET, BY TYPE, 2018-2033 (TONS)
TABLE 68 NORTH AMERICA FIRST-GENERATION IN AGRICULTURAL RODENTICIDES MARKET, BY TYPE, 2018-2033 (USD THOUSAND)
TABLE 69 NORTH AMERICA FIRST-GENERATION IN AGRICULTURAL RODENTICIDES MARKET, BY TYPE, 2018-2033 (TONS)
TABLE 70 NORTH AMERICA AGRICULTURAL RODENTICIDES MARKET, BY APPLICATIONS FORMAT, 2018-2033 (USD THOUSAND)
TABLE 71 NORTH AMERICA AGRICULTURAL RODENTICIDES MARKET, BY APPLICATIONS FORMAT, 2018-2033 (TONS)
TABLE 72 U.S. AGRICULTURAL RODENTICIDES MARKET, BY TYPE, 2018-2033 (USD THOUSAND)
TABLE 73 U.S. AGRICULTURAL RODENTICIDES MARKET, BY TYPE, 2018-2033 (TONS)
TABLE 74 U.S. ANTICOAGULANTS IN AGRICULTURAL RODENTICIDES MARKET, BY TYPE, 2018-2033 (USD THOUSAND)
TABLE 75 U.S. ANTICOAGULANTS IN AGRICULTURAL RODENTICIDES MARKET, BY TYPE, 2018-2033 (TONS)
TABLE 76 U.S. SECOND-GENERATION IN AGRICULTURAL RODENTICIDES MARKET, BY TYPE, 2018-2033 (USD THOUSAND)
TABLE 77 U.S. SECOND-GENERATION IN AGRICULTURAL RODENTICIDES MARKET, BY TYPE, 2018-2033 (TONS)
TABLE 78 U.S. FIRST-GENERATION IN AGRICULTURAL RODENTICIDES MARKET, BY TYPE, 2018-2033 (USD THOUSAND)
TABLE 79 U.S. FIRST-GENERATION IN AGRICULTURAL RODENTICIDES MARKET, BY TYPE, 2018-2033 (TONS)
TABLE 80 U.S. AGRICULTURAL RODENTICIDES MARKET, BY APPLICATIONS FORMAT, 2018-2033 (USD THOUSAND)
TABLE 81 U.S. AGRICULTURAL RODENTICIDES MARKET, BY APPLICATIONS FORMAT, 2018-2033 (TONS)
TABLE 82 MEXICO AGRICULTURAL RODENTICIDES MARKET, BY TYPE, 2018-2033 (USD THOUSAND)
TABLE 83 MEXICO AGRICULTURAL RODENTICIDES MARKET, BY TYPE, 2018-2033 (TONS)
TABLE 84 MEXICO ANTICOAGULANTS IN AGRICULTURAL RODENTICIDES MARKET, BY TYPE, 2018-2033 (USD THOUSAND)
TABLE 85 MEXICO ANTICOAGULANTS IN AGRICULTURAL RODENTICIDES MARKET, BY TYPE, 2018-2033 (TONS)
TABLE 86 MEXICO SECOND-GENERATION IN AGRICULTURAL RODENTICIDES MARKET, BY TYPE, 2018-2033 (USD THOUSAND)
TABLE 87 MEXICO SECOND-GENERATION IN AGRICULTURAL RODENTICIDES MARKET, BY TYPE, 2018-2033 (TONS)
TABLE 88 MEXICO FIRST-GENERATION IN AGRICULTURAL RODENTICIDES MARKET, BY TYPE, 2018-2033 (USD THOUSAND)
TABLE 89 MEXICO FIRST-GENERATION IN AGRICULTURAL RODENTICIDES MARKET, BY TYPE, 2018-2033 (TONS)
TABLE 90 MEXICO AGRICULTURAL RODENTICIDES MARKET, BY APPLICATIONS FORMAT, 2018-2033 (USD THOUSAND)
TABLE 91 MEXICO AGRICULTURAL RODENTICIDES MARKET, BY APPLICATIONS FORMAT, 2018-2033 (TONS)
TABLE 92 CANADA AGRICULTURAL RODENTICIDES MARKET, BY TYPE, 2018-2033 (USD THOUSAND)
TABLE 93 CANADA AGRICULTURAL RODENTICIDES MARKET, BY TYPE, 2018-2033 (TONS)
TABLE 94 CANADA ANTICOAGULANTS IN AGRICULTURAL RODENTICIDES MARKET, BY TYPE, 2018-2033 (USD THOUSAND)
TABLE 95 CANADA ANTICOAGULANTS IN AGRICULTURAL RODENTICIDES MARKET, BY TYPE, 2018-2033 (TONS)
TABLE 96 CANADA SECOND-GENERATION IN AGRICULTURAL RODENTICIDES MARKET, BY TYPE, 2018-2033 (USD THOUSAND)
TABLE 97 CANADA SECOND-GENERATION IN AGRICULTURAL RODENTICIDES MARKET, BY TYPE, 2018-2033 (TONS)
TABLE 98 CANADA FIRST-GENERATION IN AGRICULTURAL RODENTICIDES MARKET, BY TYPE, 2018-2033 (USD THOUSAND)
TABLE 99 CANADA FIRST-GENERATION IN AGRICULTURAL RODENTICIDES MARKET, BY TYPE, 2018-2033 (TONS)
TABLE 100 CANADA AGRICULTURAL RODENTICIDES MARKET, BY APPLICATIONS FORMAT, 2018-2033 (USD THOUSAND)
TABLE 101 CANADA AGRICULTURAL RODENTICIDES MARKET, BY APPLICATIONS FORMAT, 2018-2033 (TONS)
TABLE 102 SOUTH AMERICA AGRICULTURAL RODENTICIDES MARKET, BY COUNTRY, 2018-2033 (USD THOUSAND)
TABLE 103 SOUTH AMERICA AGRICULTURAL RODENTICIDES MARKET, BY COUNTRY, 2018-2033 (TONS)
TABLE 104 SOUTH AMERICA AGRICULTURAL RODENTICIDES MARKET, BY TYPE, 2018-2033 (USD THOUSAND)
TABLE 105 SOUTH AMERICA AGRICULTURAL RODENTICIDES MARKET, BY TYPE, 2018-2033 (TONS)
TABLE 106 SOUTH AMERICA ANTICOAGULANTS IN AGRICULTURAL RODENTICIDES MARKET, BY TYPE, 2018-2033 (USD THOUSAND)
TABLE 107 SOUTH AMERICA ANTICOAGULANTS IN AGRICULTURAL RODENTICIDES MARKET, BY TYPE, 2018-2033 (TONS)
TABLE 108 SOUTH AMERICA SECOND-GENERATION IN AGRICULTURAL RODENTICIDES MARKET, BY TYPE, 2018-2033 (USD THOUSAND)
TABLE 109 SOUTH AMERICA SECOND-GENERATION IN AGRICULTURAL RODENTICIDES MARKET, BY TYPE, 2018-2033 (TONS)
TABLE 110 SOUTH AMERICA FIRST-GENERATION IN AGRICULTURAL RODENTICIDES MARKET, BY TYPE, 2018-2033 (USD THOUSAND)
TABLE 111 SOUTH AMERICA FIRST-GENERATION IN AGRICULTURAL RODENTICIDES MARKET, BY TYPE, 2018-2033 (TONS)
TABLE 112 SOUTH AMERICA AGRICULTURAL RODENTICIDES MARKET, BY APPLICATIONS FORMAT, 2018-2033 (USD THOUSAND)
TABLE 113 SOUTH AMERICA AGRICULTURAL RODENTICIDES MARKET, BY APPLICATIONS FORMAT, 2018-2033 (TONS)
TABLE 114 BRAZIL AGRICULTURAL RODENTICIDES MARKET, BY TYPE, 2018-2033 (USD THOUSAND)
TABLE 115 BRAZIL AGRICULTURAL RODENTICIDES MARKET, BY TYPE, 2018-2033 (TONS)
TABLE 116 BRAZIL ANTICOAGULANTS IN AGRICULTURAL RODENTICIDES MARKET, BY TYPE, 2018-2033 (USD THOUSAND)
TABLE 117 BRAZIL ANTICOAGULANTS IN AGRICULTURAL RODENTICIDES MARKET, BY TYPE, 2018-2033 (TONS)
TABLE 118 BRAZIL SECOND-GENERATION IN AGRICULTURAL RODENTICIDES MARKET, BY TYPE, 2018-2033 (USD THOUSAND)
TABLE 119 BRAZIL SECOND-GENERATION IN AGRICULTURAL RODENTICIDES MARKET, BY TYPE, 2018-2033 (TONS)
TABLE 120 BRAZIL FIRST-GENERATION IN AGRICULTURAL RODENTICIDES MARKET, BY TYPE, 2018-2033 (USD THOUSAND)
TABLE 121 BRAZIL FIRST-GENERATION IN AGRICULTURAL RODENTICIDES MARKET, BY TYPE, 2018-2033 (TONS)
TABLE 122 BRAZIL AGRICULTURAL RODENTICIDES MARKET, BY APPLICATIONS FORMAT, 2018-2033 (USD THOUSAND)
TABLE 123 BRAZIL AGRICULTURAL RODENTICIDES MARKET, BY APPLICATIONS FORMAT, 2018-2033 (TONS)
TABLE 124 ARGENTINA AGRICULTURAL RODENTICIDES MARKET, BY TYPE, 2018-2033 (USD THOUSAND)
TABLE 125 ARGENTINA AGRICULTURAL RODENTICIDES MARKET, BY TYPE, 2018-2033 (TONS)
TABLE 126 ARGENTINA ANTICOAGULANTS IN AGRICULTURAL RODENTICIDES MARKET, BY TYPE, 2018-2033 (USD THOUSAND)
TABLE 127 ARGENTINA ANTICOAGULANTS IN AGRICULTURAL RODENTICIDES MARKET, BY TYPE, 2018-2033 (TONS)
TABLE 128 ARGENTINA SECOND-GENERATION IN AGRICULTURAL RODENTICIDES MARKET, BY TYPE, 2018-2033 (USD THOUSAND)
TABLE 129 ARGENTINA SECOND-GENERATION IN AGRICULTURAL RODENTICIDES MARKET, BY TYPE, 2018-2033 (TONS)
TABLE 130 ARGENTINA FIRST-GENERATION IN AGRICULTURAL RODENTICIDES MARKET, BY TYPE, 2018-2033 (USD THOUSAND)
TABLE 131 ARGENTINA FIRST-GENERATION IN AGRICULTURAL RODENTICIDES MARKET, BY TYPE, 2018-2033 (TONS)
TABLE 132 ARGENTINA AGRICULTURAL RODENTICIDES MARKET, BY APPLICATIONS FORMAT, 2018-2033 (USD THOUSAND)
TABLE 133 ARGENTINA AGRICULTURAL RODENTICIDES MARKET, BY APPLICATIONS FORMAT, 2018-2033 (TONS)
TABLE 134 REST OF SOUTH AMERICA AGRICULTURAL RODENTICIDES MARKET, BY TYPE, 2018-2033 (USD THOUSAND)
TABLE 135 REST OF SOUTH AMERICA AGRICULTURAL RODENTICIDES MARKET, BY TYPE, 2018-2033 (TONS)
TABLE 136 REST OF SOUTH AMERICA ANTICOAGULANTS IN AGRICULTURAL RODENTICIDES MARKET, BY TYPE, 2018-2033 (USD THOUSAND)
TABLE 137 REST OF SOUTH AMERICA ANTICOAGULANTS IN AGRICULTURAL RODENTICIDES MARKET, BY TYPE, 2018-2033 (TONS)
TABLE 138 REST OF SOUTH AMERICA SECOND-GENERATION IN AGRICULTURAL RODENTICIDES MARKET, BY TYPE, 2018-2033 (USD THOUSAND)
TABLE 139 REST OF SOUTH AMERICA SECOND-GENERATION IN AGRICULTURAL RODENTICIDES MARKET, BY TYPE, 2018-2033 (TONS)
TABLE 140 REST OF SOUTH AMERICA FIRST-GENERATION IN AGRICULTURAL RODENTICIDES MARKET, BY TYPE, 2018-2033 (USD THOUSAND)
TABLE 141 REST OF SOUTH AMERICA FIRST-GENERATION IN AGRICULTURAL RODENTICIDES MARKET, BY TYPE, 2018-2033 (TONS)
TABLE 142 REST OF SOUTH AMERICA AGRICULTURAL RODENTICIDES MARKET, BY APPLICATIONS FORMAT, 2018-2033 (USD THOUSAND)
TABLE 143 REST OF SOUTH AMERICA AGRICULTURAL RODENTICIDES MARKET, BY APPLICATIONS FORMAT, 2018-2033 (TONS)
List of Figure
FIGURE 1 NORTH AMERICA & SOUTH AMERICA AGRICULTURAL RODENTICIDES MARKET: SEGMENTATION
FIGURE 2 NORTH AMERICA & SOUTH AMERICA AGRICULTURAL RODENTICIDES MARKET: DATA TRIANGULATION
FIGURE 3 NORTH AMERICA & SOUTH AMERICA AGRICULTURAL RODENTICIDES MARKET: DROC ANALYSIS
FIGURE 4 NORTH AMERICA & SOUTH AMERICA AGRICULTURAL RODENTICIDES MARKET: GLOBAL VS REGIONAL MARKET ANALYSIS
FIGURE 5 NORTH AMERICA & SOUTH AMERICA AGRICULTURAL RODENTICIDES MARKET: COMPANY RESEARCH ANALYSIS
FIGURE 6 NORTH AMERICA & SOUTH AMERICA AGRICULTURAL RODENTICIDES MARKET: INTERVIEW DEMOGRAPHICS
FIGURE 7 NORTH AMERICA & SOUTH AMERICA AGRICULTURAL RODENTICIDES MARKET: DBMR MARKET POSITION GRID
FIGURE 8 NORTH AMERICA & SOUTH AMERICA AGRICULTURAL RODENTICIDES MARKET: VENDOR SHARE ANALYSIS
FIGURE 9 NORTH AMERICA & SOUTH AMERICA AGRICULTURAL RODENTICIDES MARKET: MULTIVARIVATE MODELING
FIGURE 10 NORTH AMERICA & SOUTH AMERICA AGRICULTURAL RODENTICIDES MARKET: TYPE TIMELINE CURVE
FIGURE 11 NORTH AMERICA & SOUTH AMERICA AGRICULTURAL RODENTICIDES MARKET: APPLICATION COVERAGE GRID
FIGURE 12 NORTH AMERICA & SOUTH AMERICA AGRICULTURAL RODENTICIDES MARKET: SEGMENTATION
FIGURE 13 TWO SEGMENTS COMPRISE THE NORTH AMERICA & SOUTH AMERICA AGRICULTURAL RODENTICIDES MARKET, BY TYPE (2025)
FIGURE 14 ASIA-PACIFIC IS EXPECTED TO BE THE DOMINANT AND FASTEST GRWOING REGION IN THE NORTH AMERICA & SOUTH AMERICA AGRICULTURAL RODENTICIDES MARKET IN THE FORECAST PERIOD OF 2026 TO 2033
FIGURE 15 NORTH AMERICA & SOUTH AMERICA AGRICULTURAL RODENTICIDES MARKET: EXECUTIVE SUMMARY
FIGURE 16 RISING RODENT INFESTATIONS IN FARMLANDS AND STORAGE SITES IS EXPECTED TO DRIVE THE NORTH AMERICA & SOUTH AMERICA AGRICULTURAL RODENTICIDES MARKET DURING THE FORECAST PERIOD OF 2026 TO 2033
FIGURE 17 TYPE SEGMENT IS EXPECTED TO ACCOUNT FOR THE LARGEST SHARE OF THE NORTH AMERICA & SOUTH AMERICA AGRICULTURAL RODENTICIDES MARKET IN 2026 & 2033
FIGURE 18 STRATEGIC DECISIONS
FIGURE 19 DRIVERS, RESTRINTS, OPPORTUNITIES AND CHALLENGES OF ASIA-PACIFIC ERP MARKET
FIGURE 20 DROC ANALYSIS
FIGURE 21 NORTH AMERICA AND SOUTH AMERICA AGRICULTURAL RODENTICIDES MARKET, BY TYPE, 2025
FIGURE 22 NORTH AMERICA AND SOUTH AMERICA AGRICULTURAL RODENTICIDES MARKET, BY APPLICATION FORMAT, 2025
FIGURE 23 NORTH AMERICA AND SOUTH AMERICA AGRICULTURAL RODENTICIDES MARKET, BY REGION, 2018-2033
FIGURE 24 NORTH AMERICA AGRICULTURAL RODENTICIDES MARKET, SNAPSHOTS
FIGURE 25 SOUTH AMERICA AGRICULTURAL RODENTICIDES MARKET, SNAPSHOTS
FIGURE 26 NORTH AMERICA & SOUTH AMERICA AGRICULTURAL RODENTICIDES MARKET: COMPANY SHARE 2025 (%)
Data collection and base year analysis are done using data collection modules with large sample sizes. The stage includes obtaining market information or related data through various sources and strategies. It includes examining and planning all the data acquired from the past in advance. It likewise envelops the examination of information inconsistencies seen across different information sources. The market data is analysed and estimated using market statistical and coherent models. Also, market share analysis and key trend analysis are the major success factors in the market report. To know more, please request an analyst call or drop down your inquiry.
The key research methodology used by DBMR research team is data triangulation which involves data mining, analysis of the impact of data variables on the market and primary (industry expert) validation. Data models include Vendor Positioning Grid, Market Time Line Analysis, Market Overview and Guide, Company Positioning Grid, Patent Analysis, Pricing Analysis, Company Market Share Analysis, Standards of Measurement, Global versus Regional and Vendor Share Analysis. To know more about the research methodology, drop in an inquiry to speak to our industry experts.
Data Bridge Market Research is a leader in advanced formative research. We take pride in servicing our existing and new customers with data and analysis that match and suits their goal. The report can be customized to include price trend analysis of target brands understanding the market for additional countries (ask for the list of countries), clinical trial results data, literature review, refurbished market and product base analysis. Market analysis of target competitors can be analyzed from technology-based analysis to market portfolio strategies. We can add as many competitors that you require data about in the format and data style you are looking for. Our team of analysts can also provide you data in crude raw excel files pivot tables (Fact book) or can assist you in creating presentations from the data sets available in the report.


