
North America Animal Feed Organic Trace Minerals Market
Market Size in USD Million
 USD
150.27 Million
USD
261.61 Million
2024
2032
USD
150.27 Million
USD
261.61 Million
2024
2032
| 2025 - 2032 | |
| USD 150.27 Million | |
| USD 261.61 Million | |
| % | |
|
North America Animal Feed Organic Trace Minerals Market Size
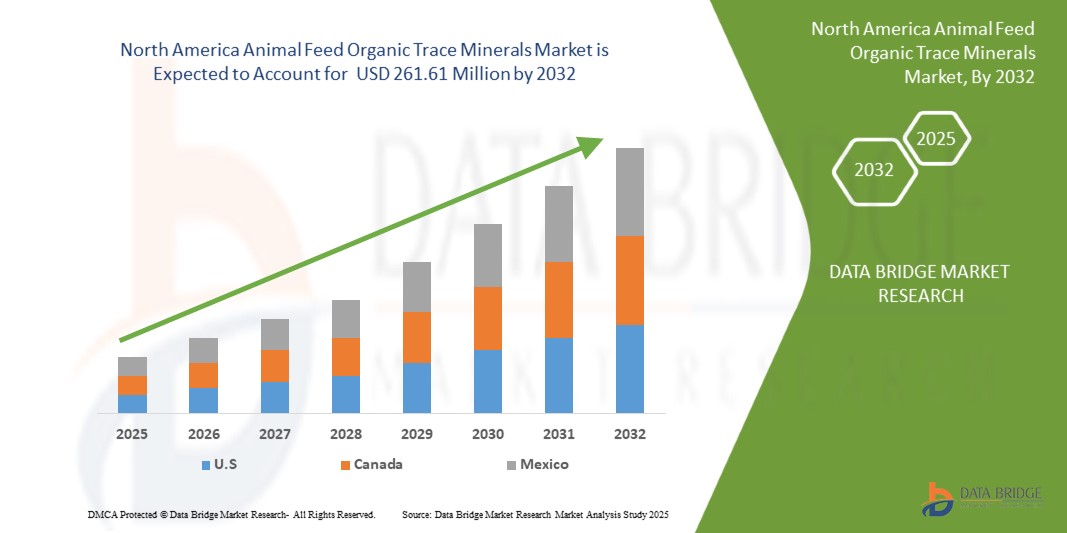
- The North America Animal Feed Organic Trace Minerals Market was valued at USD 150.27 million in 2024 and is expected to reach USD 261.61 million by 2032
- During the forecast period of 2025 to 2032 the market is likely to grow at a CAGR of 7.29%, primarily driven by rising demand in rising demand for nutrient-enriched animal-derived food products and increased focus on improving livestock health
- This growth is driven by factors such as the productivity and growing shift toward organic and sustainable feed additives and government regulations limiting use of synthetic feed components
North America Animal Feed Organic Trace Minerals Market Analysis
- The North America Animal Feed Organic Trace Minerals Market in North America is experiencing stable growth, fueled by rising demand for nutrient-enriched feed formulations and the emphasis on improving animal health and productivity. Key minerals such as zinc, copper, manganese, and iron, when provided in organic forms, ensure higher bioavailability compared to inorganic alternatives, thereby enhancing immunity, fertility, and overall feed efficiency. Despite this, challenges remain in achieving optimal formulation balance, preventing mineral toxicity, and ensuring regulatory compliance across feed supply chains.
- The shift toward sustainable and performance-oriented feed additives is a strong growth driver, as livestock producers increasingly seek alternatives to Antibiotic Growth Promoters (AGPs). Organic trace minerals are being widely adopted due to their role in improving gut health, bone development, and immune performance, aligning with growing consumer demand for safe and high-quality animal-derived food products.
- The U.S. dominates the North America market, supported by its large-scale livestock production, advanced feed manufacturing capabilities, and strong demand for premium livestock products. Increasing investments in research, innovation in chelation technologies, and the integration of precision nutrition practices are further strengthening the country’s leadership position in the region.
- Market players in North America are focusing on species-specific mineral blends, encapsulation technologies, and combinations with functional additives such as probiotics and enzymes to improve efficiency and product differentiation. Compliance with stringent feed safety and quality frameworks remains critical for ensuring market competitiveness and sustained growth.
Report Scope and North America Animal Feed Organic Trace Minerals Market Segmentation
|
Attributes |
North America Animal Feed Organic Trace Minerals Key Market Insights |
|
Segments Covered |
|
|
Countries Covered |
North America
|
|
Key Market Players |
|
|
Market Opportunities |
|
|
Value Added Data Infosets |
In addition to the insights on market scenarios such as market value, growth rate, segmentation, geographical coverage, and major players, the market reports curated by the Data Bridge Market Research also include in-depth expert analysis, pricing analysis, brand share analysis, consumer survey, demography analysis, supply chain analysis, value chain analysis, raw material/consumables overview, vendor selection criteria, PESTLE Analysis, Porter Analysis, and regulatory framework. |
North America Animal Feed Organic Trace Minerals Market Trends
Precision Nutrition and Sustainable Mineral Sourcing in Livestock Feed
- One prominent trend in the North America Animal Feed Organic Trace Minerals Market is the growing focus on precision nutrition and the adoption of sustainably sourced mineral formulations tailored to species-specific dietary requirements
- The market is witnessing increased demand for chelated and proteinate trace minerals due to their superior bioavailability, reduced environmental excretion, and improved animal performance. This shift is driven by rising concerns over feed efficiency, animal health, and the ecological footprint of livestock operations
- For example, in 2024, Zinpro Corporation launched a new line of species-optimized organic mineral blends that improve absorption rates while lowering environmental impact. These products are developed using Life Cycle Assessment (LCA) methodologies and are aligned with North America sustainability standards such as the FAO’s LEAP guidelines
- Major players are integrating data-driven formulation technologies—leveraging feed intake monitoring, growth modeling, and health analytics—to deliver precision mineral dosing. Simultaneously, there is increasing emphasis on responsible mineral sourcing practices, such as traceable supply chains, ethical mining certifications (e.g., IRMA), and carbon-neutral manufacturing processes
- With regulatory bodies and end-users demanding traceability and environmental compliance, organic trace mineral producers are focusing on clean-label feed additives, third-party sustainability audits, and ESG-aligned reporting, helping them build competitive differentiation and long-term buyer trust in international markets
North America Animal Feed Organic Trace Minerals Market Dynamics
Driver
Rising demand for nutrient-enriched animal-derived food products
- One of the primary drivers fueling the North America Animal Feed Organic Trace Minerals Market is the rising demand for nutrient-enriched animal-derived food products, including fortified meat, milk, and eggs. As consumers worldwide become increasingly health-conscious, there is greater emphasis on the nutritional quality and functional benefits of animal-based foods
- Organic trace minerals—such as chelated zinc, copper, selenium, and manganese—contribute to higher nutrient density in animal-derived products by enhancing mineral absorption and retention in livestock. This supports improved meat quality, milk composition, and egg nutrient content, aligning with consumer demand for healthier, value-added food options
- Growing awareness of micronutrient deficiencies in human diets has prompted livestock producers and feed manufacturers to optimize feed formulations with organic minerals, which are more bioavailable than their inorganic counterparts and ensure better transfer of essential nutrients through the food chain
- As North America markets increasingly prioritize food security, nutrition, and sustainability, the use of organic trace minerals in animal feed is becoming a key strategy to improve animal health, enhance product quality, and meet evolving dietary and regulatory standards—ultimately driving long-term market growth across regions.
Opportunity
Technological advancements in chelation and micro-encapsulation
- New chelation methods are enabling stronger bonding of minerals with amino acids and organic ligands, which significantly enhances bioavailability and absorption in livestock. This ensures more efficient nutrient utilization compared to traditional inorganic forms
- Micro-encapsulation technologies are being increasingly adopted to protect trace minerals from degradation during feed processing and digestion. These innovations enable controlled release and targeted delivery at the absorption site
- Advanced encapsulation systems are also allowing the combination of minerals with other functional additives, such as probiotics and vitamins, creating multi-nutrient delivery platforms tailored to specific species needs
- These technological improvements not only boost feed efficiency and animal performance but also reduce mineral wastage and environmental runoff, aligning with sustainability and regulatory requirements in modern animal agriculture
- Companies investing in validated chelation processes and next-generation encapsulation platforms are gaining competitive advantages by offering more consistent performance, compliance with quality standards, and eco-friendly solutions
Restraint/Challenge
Balancing Nutrition with Affordability
- One of the primary challenges restraining the growth of the North America Animal Feed Organic Trace Minerals Market is the difficulty in balancing high-performance nutrition with cost-effectiveness. While organic trace minerals offer superior bioavailability and animal health benefits, their higher production and formulation costs limit accessibility, especially in developing regions.
- Feed manufacturers and livestock producers often face pricing pressure to keep overall feed costs competitive. As a result, the adoption of premium organic minerals is sometimes deprioritized in favor of more affordable inorganic alternatives, even at the expense of long-term animal productivity and environmental efficiency.
- Small- and medium-scale producers, in particular, struggle to absorb the additional costs associated with organic mineral inclusion, despite the potential return on investment through improved feed conversion ratios, immunity, and reproductive performance.
- Volatility in raw material costs, coupled with limited local production capacity in certain regions, further complicates the pricing dynamics—forcing manufacturers to make trade-offs between nutritional quality and economic viability in feed formulations.
- Until cost optimization technologies become more widespread and the value proposition is better communicated across the supply chain, affordability will remain a critical barrier to the large-scale adoption of organic trace minerals in North America animal nutrition strategies.
North America Animal Feed Organic Trace Minerals Market Scope
The North America Animal Feed Organic Trace Minerals Market is segmented into six notable segments based on product, form, chelate type, life cycle, application, and livestock.
• By Product
On the basis of product, the North America Animal Feed Organic Trace Minerals Market is segmented into calcium, phosphorus, magnesium, sodium, chloride, sulfur, potassium, zinc, iron, copper, iodine, cobalt, manganese, selenium, chromium, molybdenum, and others. In 2025, the calcium segment is projected to dominate with a market share of 17.74%, owing to its critical role in bone development, eggshell formation, and muscle function in livestock. Widespread use across poultry, swine, and ruminants supports its strong share.
Calcium is anticipated to gain traction with the CAGR of 8.42% during the forecast period of 2025 to 2032, driven by their essential roles in immunity and reproduction. Their growing adoption in precision nutrition programs positions them as key contributors to long-term market growth.
• By Form
On the basis of form, the market is categorized into dry and liquid. In 2025, the dry segment is expected to dominate with a market share of 85.85%, largely due to its ease of storage, handling, and incorporation into compound feed formulations. Dry forms also ensure greater stability during feed processing and transportation.
The dry segment is projected to expand steadily with a CAGR of 7.37% as it gains popularity in intensive farming practices, particularly in poultry and aquaculture.
• By Chelate Type
On the basis of chelate type, the market is segmented into proteinate, amino acid complex, polysaccharide complex (Zn chelate), copper chelate, magnesium chelates, and others. In 2025, the proteinate segment is forecasted to dominate with a market share of 34.80%, attributed to its superior bioavailability and efficiency in delivering minerals directly bound to proteins or amino acids. Their proven effectiveness in enhancing animal growth, reproduction, and immunity sustains their demand.
The proteinate segment is likely to witness accelerated growth of 8.13% during the forecast period, supported by innovations in chelation technology that improve mineral stability and absorption.
• By Life Cycle
On the basis of life cycle, the market is segmented into grower feed, finisher feed, starter feed, and brooder feed. In 2025, the grower feed segment is projected to dominate with a market share of 43.89%, driven by the crucial role of trace minerals in promoting optimal weight gain, muscle development, and metabolic efficiency during the growth phase of livestock.
The grower feed segment is gaining importance and growing with the CAGR of 7.86% due to rising demand for optimized weight gain, muscle development, and feed efficiency during the critical growth phase of livestock.
• By Application
On the basis of application, the market is segmented into growth promotion, disease prevention, fertility enhancement, performance optimization, and others. In 2025, the growth promotion segment is anticipated to dominate with a market share of 35.49%, supported by rising North America demand for higher meat and dairy yields. Producers are increasingly shifting to mineral supplementation as a sustainable alternative to antibiotic growth promoters.
The growth promotion segment is expected to grow at a CAGR of 8.09%, riven by the rising demand for higher meat and dairy yields, improved feed efficiency, and the shift toward sustainable alternatives to antibiotic growth promoters.
• By Livestock
On the basis of livestock, the market is segmented into ruminants, poultry, swine, aquaculture, pets, equine, and others. In 2025, the ruminant’s segment is projected to lead with a market share of 31.63%, owing to the large North America cattle population and the critical role of trace minerals in milk production, fertility, and disease resistance.
The poultry segment is anticipated to record the fastest growth of 8.15% during 2025 to 2032, driven by the increasing North America demand for milk and beef, along with the adoption of chelated minerals to enhance fertility, immunity, and feed efficiency in cattle and other ruminants.
North America Animal Feed Organic Trace Minerals Market Regional Analysis
U.S. is projected to dominate with market share of 73.73% share of the North America Animal Feed Organic Trace Minerals Market in 2025, driven by advanced livestock farming practices, strong demand for premium meat, dairy, and poultry products, and stringent feed quality regulations
Adoption of precision nutrition techniques, technological advancements in chelation processes, and the shift toward antibiotic-free diets are accelerating the use of organic trace minerals across livestock production systems
The presence of leading feed additive manufacturers, robust R&D investments, and supportive USDA and FDA frameworks further strengthen North America’s position in the North America market
North America Animal Feed Organic Trace Minerals Market Insight
North America is expected to grow in the North America Animal Feed Organic Trace Minerals Market with 21.37% market share in 2025, Growth is driven by advanced livestock farming practices, strong demand for premium-quality meat, dairy, and poultry products, and stringent regulations governing feed quality and animal nutrition. High adoption of precision nutrition techniques and the presence of leading feed additive manufacturers further support market expansion. In addition, technological advancements in chelation processes and the shift toward antibiotic-free diets are accelerating the use of organic trace minerals across livestock production systems.
U.S. North America Animal Feed Organic Trace Minerals Market Insight
The U.S. expected to dominate the North American market in 2025, fueled by its well-developed livestock sector, high per capita meat consumption, and stringent feed quality standards. The market benefits from advanced feed manufacturing technologies, significant R&D investments, and supportive USDA and FDA frameworks that promote safe and effective feed ingredients. The rising consumer demand for grass-fed and organic meat products further boosts the adoption of organic trace minerals, which enhance nutrient absorption, growth performance, and immunity. The presence of major North America feed companies headquartered in the U.S. strengthens the domestic market landscape.
The Major Market Leaders Operating in the Market Are:
- ADM (U.S)
- Nutreco (Netherlands)
- Adisseo (France)
- Novus International, Inc. (U.S)
- Alltech (U.S)
- dsm-firmenich (Switzerland)
- Phibro Animal Health Corporation (U.S)
- Cargill, Incorporated (U.S)
- BASF (Germany)
- Zinpro (U.S)
- Biochem Zusatzstoffe Handels- und Produktionsgesellschaft mbH (Germany)
Latest Developments in North America Animal Feed Organic Trace Minerals Market
- In July 2025, Adisseo announced the upcoming launch of a new MetaSmart production facility, expected in late H2 2025, to meet the growing needs of the global dairy industry. This capacity expansion will bolster Adisseo’s ability to supply protected methionine, crucial for ruminant nutrition. The development supports the company’s strategic focus on sustainable dairy production and enhances its global supply reliability
- In February 2023, Adisseo announced the acquisition of Nor-Feed, a company specializing in natural plant-based additives for animal nutrition. This strategic move strengthens Adisseo’s portfolio in specialty feed ingredients and enhances its position in the sustainable and natural additives segment. The acquisition supports Adisseo’s innovation strategy and growth in the functional feed market
- In April 2025, NOVUS International expanded its presence in the Asian market by supporting Vietnam’s swine and poultry industries through targeted nutritional solutions and technical services. This initiative strengthens NOVUS’s regional market engagement, boosts brand visibility, and fosters customer loyalty. By addressing local production challenges with its key offerings—such as methionine supplements, enzyme feed additives, and gut health solutions—NOVUS enhances its market positioning and drives the adoption of its animal nutrition innovations across Vietnam
- In May 2025, At the FENAVI Valle event, NOVUS highlighted its ongoing commitment to unlocking soybean efficiency and promoting sustainable agricultural solutions. By showcasing their innovative approaches to enhancing crop yield and minimizing environmental impact, NOVUS underscored its leadership in the sector. Their contributions to the discussion on sustainable farming practices not only reinforce their role as industry pioneers but also align with North America efforts to increase food security and reduce resource use. This engagement positions NOVUS as a key player in the agri-tech space, enhancing its reputation and potential for long-term growth by tapping into the growing demand for eco-friendly farming solutions
SKU-

- Interactive Data Analysis Dashboard
- Company Analysis Dashboard for high growth potential opportunities
- Research Analyst Access for customization & queries
- Competitor Analysis with Interactive dashboard
- Latest News, Updates & Trend analysis
- Harness the Power of Benchmark Analysis for Comprehensive Competitor Tracking
Table of Content
1 INTRODUCTION
1.1 OBJECTIVES OF THE STUDY
1.2 MARKET DEFINITION
1.3 OVERVIEW
1.4 LIMITATIONS
1.5 MARKETS COVERED
2 MARKET SEGMENTATION
2.1 MARKETS COVERED
2.2 GEOGRAPHICAL SCOPE
2.3 YEARS CONSIDERED FOR THE STUDY
2.4 CURRENCY AND PRICING
2.5 DBMR TRIPOD DATA VALIDATION MODEL
2.6 MULTIVARIATE MODELING
2.7 PRIMARY INTERVIEWS WITH KEY OPINION LEADERS
2.8 DBMR MARKET POSITION GRID
2.9 DBMR VENDOR SHARE ANALYSIS
2.1 MARKET APPLICATION COVERAGE GRID
2.11 SECONDARY SOURCES
2.12 ASSUMPTIONS
3 EXECUTIVE SUMMARY
4 PREMIUM INSIGHTS
4.1 PORTER’S FIVE FORCES ANALYSIS
4.1.1 THREAT OF NEW ENTRANTS
4.1.2 BARGAINING POWER OF SUPPLIERS
4.1.3 BARGAINING POWER OF BUYERS
4.1.4 THREAT OF SUBSTITUTES
4.1.5 INTERNAL COMPETITION
4.2 PATENT ANALYSIS
4.2.1 PATENT QUALITY AND STRENGTH
4.2.2 PATENT FAMILIES
4.2.3 REGIONAL PATENT LANDSCAPE
4.2.4 IP STRATEGY AND MANAGEMENT
4.2.5 CONCLUSION
4.3 PRICING ANALYSIS
4.4 RAW MATERIAL COVERAGE – NORTH AMERICA ANIMAL FEED ORGANIC TRACE MINERALS MARKET
4.4.1 PRIMARY MINERAL SOURCES
4.4.2 ORGANIC LIGANDS AND CHELATING AGENTS
4.4.3 AUXILIARY ADDITIVES AND PROCESSING INPUTS
4.4.4 SOURCING TRENDS AND SUPPLY CHAIN CONSIDERATIONS
4.4.5 CONCLUSION
4.5 COMPANY EVALUATION QUADRANT
4.6 IMPORT EXPORT SCENARIO
4.6.1 IMPORT DATA SETS
4.6.2 EXPORT DATA SETS
4.7 PRODUCTION CONSUMPTION ANALYSIS
4.7.1 PRODUCTION
4.7.2 CONSUMPTION
4.8 IMPORT EXPORT SCENARIO
4.9 INNOVATION TRACKER AND STRATEGIC ANALYSIS.
4.9.1 MAJOR DEALS AND STRATEGIC ALLIANCES ANALYSIS
4.9.1.1 JOINT VENTURES
4.9.1.2 MERGERS AND ACQUISITIONS
4.9.1.3 LICENSING AND PARTNERSHIPS
4.9.1.4 TECHNOLOGY COLLABORATIONS
4.9.2 PRODUCTS IN DEVELOPMENT
4.9.3 STAGE OF DEVELOPMENT
4.9.4 TIMELINES AND MILESTONES
4.9.5 INNOVATION STRATEGIES AND METHODOLOGIES
4.9.6 RISK ASSESSMENT AND MITIGATION
4.9.7 FUTURE OUTLOOK
4.1 COST ANALYSIS BREAKDOWN
4.10.1 RAW MATERIAL COSTS (40%–55% OF TOTAL COST)
4.10.2 PROCESSING AND MANUFACTURING COSTS (20%–30%)
4.10.3 REGULATORY COMPLIANCE AND QUALITY CONTROL (5%–10%)
4.10.4 PACKAGING, LABELING, AND LOGISTICS (5%–8%)
4.10.5 RESEARCH AND DEVELOPMENT (3%–6%)
4.10.6 MARKETING, SALES, AND DISTRIBUTION (2%–5%)
4.10.7 ADMINISTRATIVE AND OVERHEAD COSTS (5%–8%)
4.11 BRAND OUTLOOK
4.12 SUPPLY CHAIN ANALYSIS
4.12.1 OVERVIEW
4.12.2 LOGISTIC COST SCENARIO
4.12.3 IMPORTANCE OF LOGISTICS SERVICE PROVIDERS
4.13 VALUE CHAIN ANALYSIS
4.13.1 RAW MATERIAL SUPPLIERS: THE BASIS OF BIOAVAILABILITY
4.13.2 ORGANIC TRACE MINERAL MANUFACTURERS: CREATING HIGH-PERFORMANCE NUTRITIONAL INPUTS
4.13.3 PREMIX AND FEED MANUFACTURERS: INTEGRATING NUTRITION INTO THE DAILY DIET
4.13.4 DISTRIBUTORS AND SUPPLY CHAIN PARTNERS: ENSURING ACCESSIBILITY AND EFFICIENCY
4.13.5 LIVESTOCK PRODUCERS AND END-USERS: THE DRIVERS OF NUTRITIONAL DEMAND
4.13.6 REGULATORY AGENCIES AND COMPLIANCE FRAMEWORKS: SHAPING MARKET PRACTICES
4.13.7 RESEARCH INSTITUTIONS AND INDUSTRY ASSOCIATIONS: CATALYSTS FOR SCIENTIFIC ADVANCEMENT
4.14 TECHNOLOGICAL ADVANCEMENTS
4.14.1 CHELATION AND COMPLEXATION TECHNOLOGIES
4.14.2 ENCAPSULATION & CONTROLLED-RELEASE DELIVERY SYSTEMS
4.14.3 NANOTECHNOLOGY IN TRACE MINERALS
4.14.4 FERMENTATION-BASED MINERAL PRODUCTION
4.14.5 PRECISION NUTRITION AND AI-DRIVEN FORMULATION TOOLS
4.14.6 SUSTAINABILITY-FOCUSED INNOVATIONS
4.14.7 DIGITAL TRACEABILITY & BLOCKCHAIN INTEGRATION
4.14.8 USE OF IOT AND SENSORS IN MINERAL EFFICACY MONITORING
4.14.9 DEVELOPMENT OF MINERAL BLENDS WITH FUNCTIONAL ADDITIVES
4.14.10 ADVANCED QUALITY CONTROL AND ANALYTICAL TESTING
4.15 VENDOR SELECTION CRITERIA.
4.15.1 PRODUCT QUALITY AND CERTIFICATION
4.15.2 MANUFACTURING CAPABILITIES
4.15.3 RESEARCH AND DEVELOPMENT (R&D) AND INNOVATION
4.15.4 REGULATORY COMPLIANCE AND TRACEABILITY
4.15.5 SUPPLY CHAIN RELIABILITY
4.15.6 PRICING AND COMMERCIAL TERMS
4.15.7 PACKAGING AND LOGISTICS
4.15.8 TECHNICAL SUPPORT AND ADVISORY SERVICES
4.15.9 SUSTAINABILITY AND ESG PRACTICES
4.15.10 REPUTATION AND CLIENT REFERENCES
4.15.11 DOCUMENTATION AND LEGAL COMPLIANCE
4.15.12 CUSTOMER RELATIONSHIP MANAGEMENT
4.16 TARIFFS & IMPACT ON THE NORTH AMERICA ANIMAL FEED ORGANIC TRACE MINERALS MARKET
4.16.1 TARIFF LANDSCAPE: APPLICABLE DUTIES ON ORGANIC TRACE MINERAL INPUTS AND FINISHED PREMIXES
4.16.2 IMPACT OF TARIFFS ON COST AND SUPPLY CHAIN DYNAMICS
4.16.3 INFLUENCE OF TRADE POLICIES AND GEOPOLITICAL DEVELOPMENTS
4.16.4 MARKET TRENDS AMPLIFYING TARIFF IMPACT
4.16.5 COMPETITIVE IMPLICATIONS FOR MARKET PLAYERS
4.16.6 CHALLENGES AND OPPORTUNITIES ARISING FROM TARIFFS
4.16.7 KEY PLAYERS
4.16.8 CONCLUSION
5 REGULATION COVERAGE
6 MARKET OVERVIEW
6.1 DRIVERS
6.1.1 RISING DEMAND FOR NUTRIENT-ENRICHED ANIMAL-DERIVED FOOD PRODUCTS
6.1.2 INCREASED FOCUS ON IMPROVING LIVESTOCK HEALTH AND PRODUCTIVITY
6.1.3 GROWING SHIFT TOWARD ORGANIC AND SUSTAINABLE FEED ADDITIVES
6.1.4 GOVERNMENT REGULATIONS LIMITING USE OF SYNTHETIC FEED COMPONENTS
6.2 RESTRAINTS
6.2.1 HIGHER PRODUCTION AND FORMULATION COSTS OF ORGANIC TRACE MINERALS
6.2.2 LIMITED FARMER AWARENESS IN LOW-INCOME OR RURAL LIVESTOCK MARKETS
6.3 OPPORTUNITIES
6.3.1 TECHNOLOGICAL ADVANCEMENTS IN CHELATION AND MICRO-ENCAPSULATION
6.3.2 GROWING FOCUS ON PRECISION NUTRITION AND CUSTOMIZED FORMULATIONS
6.3.3 EXPANSION OF THE AQUAFEED MARKET
6.4 CHALLENGES
6.4.1 BALANCING NUTRITION WITH AFFORDABILITY
6.4.2 COMPETITION FROM CONVENTIONAL INORGANIC MINERALS
7 NORTH AMERICA ANIMAL FEED ORGANIC TRACE MINERALS MARKET, BY PRODUCT
7.1 OVERVIEW
7.2 CALCIUM
7.3 PHOSPHOROUS
7.4 MAGNESIUM
7.5 SODIUM
7.6 CHLORIDE
7.7 SULFUR
7.8 POTASSIUM
7.9 ZINC
7.1 IRON
7.11 COPPER
7.12 IODINE
7.13 COBALT
7.14 MANGANESE
7.15 SELENIUM
7.16 CHROMIUM
7.17 MOLYBDENUM
7.18 OTHERS
8 NORTH AMERICA ANIMAL FEED ORGANIC TRACE MINERALS MARKET, BY FORM
8.1 OVERVIEW
8.2 DRY
8.3 LIQUID
9 NORTH AMERICA ANIMAL FEED ORGANIC TRACE MINERALS MARKET, BY CHELATE TYPE
9.1 OVERVIEW
9.2 PROTEINATE
9.3 AMINO-ACID COMPLEX
9.4 POLYSACCHARIDE COMPLEX (ZN CHELATE)
9.5 COPPER CHELATE
9.6 MAGNESIUM CHELATE
9.7 OTHERS
10 NORTH AMERICA ANIMAL FEED ORGANIC TRACE MINERALS MARKET, BY LIFE CYCLE
10.1 OVERVIEW
10.2 GROWER FEED
10.3 FINISHER FEED
10.4 STARTER FEED
10.5 BROODER FEED
11 NORTH AMERICA ANIMAL FEED ORGANIC TRACE MINERALS MARKET, BY APPLICATION
11.1 OVERVIEW
11.2 GROWTH PROMOTION
11.3 DISEASE PREVENTION
11.4 FERTILITY ENHANCEMENT
11.5 PERFORMANCE OPTIMIZATION
11.6 OTHERS
12 NORTH AMERICA ANIMAL FEED ORGANIC TRACE MINERALS MARKET, BY LIVESTOCK
12.1 OVERVIEW
12.2 RUMINANTS
12.3 POULTRY
12.4 SWINE
12.5 AQUACULTURE
12.6 PETS
12.7 EQUINE
12.8 OTHERS
13 NORTH AMERICA ANIMAL FEED ORGANIC TRACE MINERALS MARKET, BY REGION
13.1 NORTH AMERICA
13.1.1 U.S.
13.1.2 CANADA
13.1.3 MEXICO
14 NORTH AMERICA ANIMAL FEED ORGANIC TRACE MINERALS MARKET, COMPANY LANDSCAPE
14.1 COMPANY SHARE ANALYSIS: NORTH AMERICA
15 SWOT ANALYSIS
16 COMPANY PROFILES
16.1 ADM
16.1.1 COMPANY SNAPSHOT
16.1.2 RECENT FINANCIALS
16.1.3 COMPANY SHARE ANALYSIS
16.1.4 PRODUCT PORTFOLIO
16.1.5 RECENT DEVELOPMENT
16.2 NUTRECO
16.2.1 COMPANY SNAPSHOT
16.2.2 COMPANY SHARE ANALYSIS
16.2.3 PRODUCT PORTFOLIO
16.2.4 RECENT DEVELOPMENT
16.3 ADISSEO
16.3.1 COMPANY SNAPSHOT
16.3.2 REVENUE ANALYSIS
16.3.3 COMPANY SHARE ANALYSIS
16.3.4 PRODUCT PORTFOLIO
16.3.5 RECENT DEVELOPMENTS
16.4 NOVUS INTERNATIONAL, INC.
16.4.1 COMPANY SNAPSHOT
16.4.2 COMPANY SHARE ANALYSIS
16.4.3 PRODUCT PORTFOLIO
16.4.4 RECENT DEVELOPMENTS
16.5 ALLTECH
16.5.1 COMPANY SNAPSHOT
16.5.2 COMPANY SHARE ANALYSIS
16.5.3 PRODUCT PORTFOLIO
16.5.4 RECENT DEVELOPMENT
16.6 BASF
16.6.1 COMPANY SNAPSHOT
16.6.2 REVENUE ANALYSIS
16.6.3 PRODUCT PORTFOLIO
16.6.4 RECENT DEVELOPMENTS/NEWS
16.7 BIOCHEM ZUSATZSTOFFE HANDELS- UND PRODUKTIONSGESELLSCHAFT MBH
16.7.1 COMPANY SNAPSHOT
16.7.2 PRODUCT PORTFOLIO
16.7.3 RECENT DEVELOPMENTS
16.8 CARGILL, INCORPORATED
16.8.1 COMPANY SNAPSHOT
16.8.2 PRODUCT PORTFOLIO
16.8.3 RECENT DEVELOPMENT
16.9 DSM-FIRMENICH
16.9.1 COMPANY SNAPSHOT
16.9.2 REVENUE ANALYSIS
16.9.3 PRODUCT PORTFOLIO
16.9.4 RECENT DEVELOPMENTS
16.1 PHIBRO ANIMAL HEALTH CORPORATION
16.10.1 COMPANY SNAPSHOT
16.10.2 REVENUE ANALYSIS
16.10.3 PRODUCT PORTFOLIO
16.10.4 RECENT DEVELOPMENTS/NEWS
16.11 ZINPRO
16.11.1 COMPANY SNAPSHOT
16.11.2 PRODUCT PORTFOLIO
16.11.3 RECENT DEVELOPMENT
17 QUESTIONNAIRE
18 RELATED REPORTS
List of Table
TABLE 1 TIMELINES AND MILESTONES
TABLE 2 RISK ASSESSMENT AND MITIGATION
TABLE 3 BRAND OUTLOOK: ANIMAL FEED ORGANIC TRACE MINERALS MARKET
TABLE 4 REGULATORY COVERAGE
TABLE 5 NORTH AMERICA ANIMAL FEED ORGANIC TRACE MINERALS MARKET, BY PRODUCT, 2018-2032 (USD THOUSAND)
TABLE 6 NORTH AMERICA ANIMAL FEED ORGANIC TRACE MINERALS MARKET, BY PRODUCT, 2018-2032 (USD THOUSAND TON)
TABLE 7 NORTH AMERICA CALCIUM ANIMAL FEED ORGANIC TRACE MINERALS MARKET, BY REGION, 2018-2032 (USD THOUSAND)
TABLE 8 NORTH AMERICA PHOSPHOROUS ANIMAL FEED ORGANIC TRACE MINERALS MARKET, BY REGION, 2018-2032 (USD THOUSAND)
TABLE 9 NORTH AMERICA MAGNESIUM ANIMAL FEED ORGANIC TRACE MINERALS MARKET, BY REGION, 2018-2032 (USD THOUSAND)
TABLE 10 NORTH AMERICA SODIUM ANIMAL FEED ORGANIC TRACE MINERALS MARKET, BY REGION, 2018-2032 (USD THOUSAND)
TABLE 11 NORTH AMERICA CHLORIDE ANIMAL FEED ORGANIC TRACE MINERALS MARKET, BY REGION, 2018-2032 (USD THOUSAND)
TABLE 12 NORTH AMERICA SULFUR ANIMAL FEED ORGANIC TRACE MINERALS MARKET, BY REGION, 2018-2032 (USD THOUSAND)
TABLE 13 NORTH AMERICA POTASSIUM ANIMAL FEED ORGANIC TRACE MINERALS MARKET, BY REGION, 2018-2032 (USD THOUSAND)
TABLE 14 NORTH AMERICA ZINC ANIMAL FEED ORGANIC TRACE MINERALS MARKET, BY REGION, 2018-2032 (USD THOUSAND)
TABLE 15 NORTH AMERICA IRON ANIMAL FEED ORGANIC TRACE MINERALS MARKET, BY REGION, 2018-2032 (USD THOUSAND)
TABLE 16 NORTH AMERICA COPPER ANIMAL FEED ORGANIC TRACE MINERALS MARKET, BY REGION, 2018-2032 (USD THOUSAND)
TABLE 17 NORTH AMERICA IODINE ANIMAL FEED ORGANIC TRACE MINERALS MARKET, BY REGION, 2018-2032 (USD THOUSAND)
TABLE 18 NORTH AMERICA COBALT ANIMAL FEED ORGANIC TRACE MINERALS MARKET, BY REGION, 2018-2032 (USD THOUSAND)
TABLE 19 NORTH AMERICA MANGANESE ANIMAL FEED ORGANIC TRACE MINERALS MARKET, BY REGION, 2018-2032 (USD THOUSAND)
TABLE 20 NORTH AMERICA SELENIUM ANIMAL FEED ORGANIC TRACE MINERALS MARKET, BY REGION, 2018-2032 (USD THOUSAND)
TABLE 21 NORTH AMERICA CHROMIUM ANIMAL FEED ORGANIC TRACE MINERALS MARKET, BY REGION, 2018-2032 (USD THOUSAND)
TABLE 22 NORTH AMERICA MOLYBDENUM ANIMAL FEED ORGANIC TRACE MINERALS MARKET, BY REGION, 2018-2032 (USD THOUSAND)
TABLE 23 NORTH AMERICA OTHERS ANIMAL FEED ORGANIC TRACE MINERALS MARKET, BY REGION, 2018-2032 (USD THOUSAND)
TABLE 24 NORTH AMERICA ANIMAL FEED ORGANIC TRACE MINERALS MARKET, BY FORM, 2018-2032 (USD THOUSAND)
TABLE 25 NORTH AMERICA ANIMAL FEED ORGANIC TRACE MINERALS MARKET, BY FORM, 2018-2032 (THOUSAND TONS)
TABLE 26 NORTH AMERICA DRY IN ANIMAL FEED ORGANIC TRACE MINERALS MARKET, BY REGION, 2018-2032 (USD THOUSAND)
TABLE 27 NORTH AMERICA DRY IN ANIMAL FEED ORGANIC TRACE MINERALS MARKET, BY TYPE, 2018-2032 (USD THOUSAND)
TABLE 28 NORTH AMERICA POWDER IN ANIMAL FEED ORGANIC TRACE MINERALS MARKET, BY TYPE, 2018-2032 (USD THOUSAND)
TABLE 29 NORTH AMERICA LIQUID IN ANIMAL FEED ORGANIC TRACE MINERALS MARKET, BY REGION, 2018-2032 (USD THOUSAND)
TABLE 30 NORTH AMERICA ANIMAL FEED ORGANIC TRACE MINERALS MARKET, BY CHELATE TYPE, 2018-2032 (USD THOUSAND)
TABLE 31 NORTH AMERICA ANIMAL FEED ORGANIC TRACE MINERALS MARKET, BY CHELATE TYPE, 2018-2032 (THOUSAND TONS)
TABLE 32 NORTH AMERICA PROTEINATE IN ANIMAL FEED ORGANIC TRACE MINERALS MARKET, BY REGION, 2018-2032 (USD THOUSAND)
TABLE 33 NORTH AMERICA AMINO-ACID COMPLEX IN ANIMAL FEED ORGANIC TRACE MINERALS MARKET, BY REGION, 2018-2032 (USD THOUSAND)
TABLE 34 NORTH AMERICA POLYSACCHARIDE COMPLEX (ZN CHELATE) IN ANIMAL FEED ORGANIC TRACE MINERALS MARKET, BY REGION, 2018-2032 (USD THOUSAND)
TABLE 35 NORTH AMERICA COPPER CHELATE IN ANIMAL FEED ORGANIC TRACE MINERALS MARKET, BY REGION, 2018-2032 (USD THOUSAND)
TABLE 36 NORTH AMERICA MAGNESIUM CHELATE IN ANIMAL FEED ORGANIC TRACE MINERALS MARKET, BY REGION, 2018-2032 (USD THOUSAND)
TABLE 37 NORTH AMERICA OTHERS IN ANIMAL FEED ORGANIC TRACE MINERALS MARKET, BY REGION, 2018-2032 (USD THOUSAND)
TABLE 38 NORTH AMERICA ANIMAL FEED ORGANIC TRACE MINERALS MARKET, BY LIFE CYCLE, 2018-2032 (USD THOUSAND)
TABLE 39 NORTH AMERICA ANIMAL FEED ORGANIC TRACE MINERALS MARKET, BY LIFE CYCLE, 2018-2032 (THOUSAND TON)
TABLE 40 NORTH AMERICA GROWER FEED IN ANIMAL FEED ORGANIC TRACE MINERALS MARKET, BY REGION, 2018-2032 (USD THOUSAND)
TABLE 41 NORTH AMERICA FINISHER FEED IN ANIMAL FEED ORGANIC TRACE MINERALS MARKET, BY REGION, 2018-2032 (USD THOUSAND)
TABLE 42 NORTH AMERICA STARTER FEED IN ANIMAL FEED ORGANIC TRACE MINERALS MARKET, BY REGION, 2018-2032 (USD THOUSAND)
TABLE 43 NORTH AMERICA BROODER FEED IN ANIMAL FEED ORGANIC TRACE MINERALS MARKET, BY REGION, 2018-2032 (USD THOUSAND)
TABLE 44 NORTH AMERICA ANIMAL FEED ORGANIC TRACE MINERALS MARKET, BY APPLICATION, 2018-2032 (USD THOUSAND)
TABLE 45 NORTH AMERICA ANIMAL FEED ORGANIC TRACE MINERALS MARKET, BY APPLICATION, 2018-2032 (THOUSAND TONS)
TABLE 46 NORTH AMERICA GROWTH PROMOTION IN ANIMAL FEED ORGANIC TRACE MINERALS MARKET, BY REGION, 2018-2032 (USD THOUSAND)
TABLE 47 NORTH AMERICA DISEASE PREVENTION IN ANIMAL FEED ORGANIC TRACE MINERALS MARKET, BY REGION, 2018-2032 (USD THOUSAND)
TABLE 48 NORTH AMERICA FERTILITY ENHANCEMENT IN ANIMAL FEED ORGANIC TRACE MINERALS MARKET, BY REGION, 2018-2032 (USD THOUSAND)
TABLE 49 NORTH AMERICA PERFORMANCE OPTIMIZATION IN ANIMAL FEED ORGANIC TRACE MINERALS MARKET, BY REGION, 2018-2032 (USD THOUSAND)
TABLE 50 NORTH AMERICA OTHERS IN ANIMAL FEED ORGANIC TRACE MINERALS MARKET, BY REGION, 2018-2032 (USD THOUSAND)
TABLE 51 NORTH AMERICA ANIMAL FEED ORGANIC TRACE MINERALS MARKET, BY LIVESTOCK, 2018-2032 (USD THOUSAND)
TABLE 52 NORTH AMERICA ANIMAL FEED ORGANIC TRACE MINERALS MARKET, BY LIVESTOCK, 2018-2032 (THOUSAND TONS)
TABLE 53 NORTH AMERICA RUMINANTS IN ANIMAL FEED ORGANIC TRACE MINERALS MARKET, BY REGION, 2018-2032 (USD THOUSAND)
TABLE 54 NORTH AMERICA RUMINANTS IN ANIMAL FEED ORGANIC TRACE MINERALS MARKET, BY TYPE, 2018-2032 (USD THOUSAND)
TABLE 55 NORTH AMERICA RUMINANTS IN ANIMAL FEED ORGANIC TRACE MINERALS MARKET, BY PRODUCT, 2018-2032 (USD THOUSAND)
TABLE 56 NORTH AMERICA POULTRY IN ANIMAL FEED ORGANIC TRACE MINERALS MARKET, BY REGION, 2018-2032 (USD THOUSAND)
TABLE 57 NORTH AMERICA POULTRY IN ANIMAL FEED ORGANIC TRACE MINERALS MARKET, BY TYPE, 2018-2032 (USD THOUSAND)
TABLE 58 NORTH AMERICA POULTRY IN ANIMAL FEED ORGANIC TRACE MINERALS MARKET, BY PRODUCT, 2018-2032 (USD THOUSAND)
TABLE 59 NORTH AMERICA SWINE IN ANIMAL FEED ORGANIC TRACE MINERALS MARKET, BY REGION, 2018-2032 (USD THOUSAND)
TABLE 60 NORTH AMERICA SWINE IN ANIMAL FEED ORGANIC TRACE MINERALS MARKET, BY TYPE, 2018-2032 (USD THOUSAND)
TABLE 61 NORTH AMERICA SWINE IN ANIMAL FEED ORGANIC TRACE MINERALS MARKET, BY PRODUCT, 2018-2032 (USD THOUSAND)
TABLE 62 NORTH AMERICA AQUACULTURE IN ANIMAL FEED ORGANIC TRACE MINERALS MARKET, BY REGION, 2018-2032 (USD THOUSAND)
TABLE 63 NORTH AMERICA AQUACULTURE IN ANIMAL FEED ORGANIC TRACE MINERALS MARKET, BY TYPE, 2018-2032 (USD THOUSAND)
TABLE 64 NORTH AMERICA CRUSTACEANS IN ANIMAL FEED ORGANIC TRACE MINERALS MARKET, BY TYPE, 2018-2032 (USD THOUSAND)
TABLE 65 NORTH AMERICA FISH IN ANIMAL FEED ORGANIC TRACE MINERALS MARKET, BY TYPE, 2018-2032 (USD THOUSAND)
TABLE 66 NORTH AMERICA MOLLUSKS IN ANIMAL FEED ORGANIC TRACE MINERALS MARKET, BY TYPE, 2018-2032 (USD THOUSAND)
TABLE 67 NORTH AMERICA AQUACULTURE IN ANIMAL FEED ORGANIC TRACE MINERALS MARKET, BY PRODUCT, 2018-2032 (USD THOUSAND)
TABLE 68 NORTH AMERICA PETS IN ANIMAL FEED ORGANIC TRACE MINERALS MARKET, BY REGION, 2018-2032 (USD THOUSAND)
TABLE 69 NORTH AMERICA PETS IN ANIMAL FEED ORGANIC TRACE MINERALS MARKET, BY TYPE, 2018-2032 (USD THOUSAND)
TABLE 70 NORTH AMERICA PETS IN ANIMAL FEED ORGANIC TRACE MINERALS MARKET, BY PRODUCT, 2018-2032 (USD THOUSAND)
TABLE 71 NORTH AMERICA EQUINE IN ANIMAL FEED ORGANIC TRACE MINERALS MARKET, BY REGION, 2018-2032 (USD THOUSAND)
TABLE 72 NORTH AMERICA EQUINE IN ANIMAL FEED ORGANIC TRACE MINERALS MARKET, BY PRODUCT, 2018-2032 (USD THOUSAND)
TABLE 73 NORTH AMERICA OTHERS IN ANIMAL FEED ORGANIC TRACE MINERALS MARKET, BY REGION, 2018-2032 (USD THOUSAND)
TABLE 74 NORTH AMERICA OTHERS IN ANIMAL FEED ORGANIC TRACE MINERALS MARKET, BY PRODUCT, 2018-2032 (USD THOUSAND)
TABLE 75 NORTH AMERICA ANIMAL FEED ORGANIC TRACE MINERALS MARKET, BY COUNTRY, 2018-2032 (USD THOUSAND)
TABLE 76 NORTH AMERICA ANIMAL FEED ORGANIC TRACE MINERALS MARKET, BY COUNTRY, 2018-2032 (THOUSAND TONS)
TABLE 77 NORTH AMERICA ANIMAL FEED ORGANIC TRACE MINERALS MARKET, BY PRODUCT, 2018-2032 (USD THOUSAND)
TABLE 78 NORTH AMERICA ANIMAL FEED ORGANIC TRACE MINERALS MARKET, BY PRODUCT, 2018-2032 (THOUSAND TONS)
TABLE 79 NORTH AMERICA ANIMAL FEED ORGANIC TRACE MINERALS MARKET, BY FORM, 2018-2032 (USD THOUSAND)
TABLE 80 NORTH AMERICA ANIMAL FEED ORGANIC TRACE MINERALS MARKET, BY FORM, 2018-2032 (THOUSAND TONS)
TABLE 81 NORTH AMERICA DRY IN ANIMAL FEED ORGANIC TRACE MINERALS MARKET, BY TYPE, 2018-2032 (USD THOUSAND)
TABLE 82 NORTH AMERICA POWDER IN ANIMAL FEED ORGANIC TRACE MINERALS MARKET, BY TYPE, 2018-2032 (USD THOUSAND)
TABLE 83 NORTH AMERICA ANIMAL FEED ORGANIC TRACE MINERALS MARKET, BY CHELATE TYPE, 2018-2032 (USD THOUSAND)
TABLE 84 NORTH AMERICA ANIMAL FEED ORGANIC TRACE MINERALS MARKET, BY CHELATE TYPE, 2018-2032 (THOUSAND TONS)
TABLE 85 NORTH AMERICA ANIMAL FEED ORGANIC TRACE MINERALS MARKET, BY LIFE CYCLE, 2018-2032 (USD THOUSAND)
TABLE 86 NORTH AMERICA ANIMAL FEED ORGANIC TRACE MINERALS MARKET, BY LIFE CYCLE, 2018-2032 (THOUSAND TONS)
TABLE 87 NORTH AMERICA ANIMAL FEED ORGANIC TRACE MINERALS MARKET, BY APPLICATION, 2018-2032 (USD THOUSAND)
TABLE 88 NORTH AMERICA ANIMAL FEED ORGANIC TRACE MINERALS MARKET, BY APPLICATION, 2018-2032 (THOUSAND TONS)
TABLE 89 NORTH AMERICA ANIMAL FEED ORGANIC TRACE MINERALS MARKET, BY LIVESTOCK, 2018-2032 (USD THOUSAND)
TABLE 90 NORTH AMERICA ANIMAL FEED ORGANIC TRACE MINERALS MARKET, BY LIVESTOCK, 2018-2032 (THOUSAND TONS)
TABLE 91 NORTH AMERICA RUMINANTS IN ANIMAL FEED ORGANIC TRACE MINERALS MARKET, BY TYPE, 2018-2032 (USD THOUSAND)
TABLE 92 NORTH AMERICA RUMINANTS IN ANIMAL FEED ORGANIC TRACE MINERALS MARKET, BY PRODUCT, 2018-2032 (USD THOUSAND)
TABLE 93 NORTH AMERICA POULTRY IN ANIMAL FEED ORGANIC TRACE MINERALS MARKET, BY TYPE, 2018-2032 (USD THOUSAND)
TABLE 94 NORTH AMERICA POULTRY IN ANIMAL FEED ORGANIC TRACE MINERALS MARKET, BY PRODUCT, 2018-2032 (USD THOUSAND)
TABLE 95 NORTH AMERICA SWINE IN ANIMAL FEED ORGANIC TRACE MINERALS MARKET, BY TYPE, 2018-2032 (USD THOUSAND)
TABLE 96 NORTH AMERICA SWINE IN ANIMAL FEED ORGANIC TRACE MINERALS MARKET, BY PRODUCT, 2018-2032 (USD THOUSAND)
TABLE 97 NORTH AMERICA AQUACULTURE IN ANIMAL FEED ORGANIC TRACE MINERALS MARKET, BY TYPE, 2018-2032 (USD THOUSAND)
TABLE 98 NORTH AMERICA CRUSTACEANS IN ANIMAL FEED ORGANIC TRACE MINERALS MARKET, BY TYPE, 2018-2032 (USD THOUSAND)
TABLE 99 NORTH AMERICA FISH IN ANIMAL FEED ORGANIC TRACE MINERALS MARKET, BY TYPE, 2018-2032 (USD THOUSAND)
TABLE 100 NORTH AMERICA MOLLUSKS IN ANIMAL FEED ORGANIC TRACE MINERALS MARKET, BY TYPE, 2018-2032 (USD THOUSAND)
TABLE 101 NORTH AMERICA AQUACULTURE IN ANIMAL FEED ORGANIC TRACE MINERALS MARKET, BY PRODUCT, 2018-2032 (USD THOUSAND)
TABLE 102 NORTH AMERICA PETS IN ANIMAL FEED ORGANIC TRACE MINERALS MARKET, BY TYPE, 2018-2032 (USD THOUSAND)
TABLE 103 NORTH AMERICA PETS IN ANIMAL FEED ORGANIC TRACE MINERALS MARKET, BY PRODUCT, 2018-2032 (USD THOUSAND)
TABLE 104 NORTH AMERICA EQUINE IN ANIMAL FEED ORGANIC TRACE MINERALS MARKET, BY PRODUCT, 2018-2032 (USD THOUSAND)
TABLE 105 NORTH AMERICA OTHERS IN ANIMAL FEED ORGANIC TRACE MINERALS MARKET, BY PRODUCT, 2018-2032 (USD THOUSAND)
TABLE 106 U.S. ANIMAL FEED ORGANIC TRACE MINERALS MARKET, BY PRODUCT, 2018-2032 (USD THOUSAND)
TABLE 107 U.S. ANIMAL FEED ORGANIC TRACE MINERALS MARKET, BY PRODUCT, 2018-2032 (THOUSAND TONS)
TABLE 108 U.S. ANIMAL FEED ORGANIC TRACE MINERALS MARKET, BY FORM, 2018-2032 (USD THOUSAND)
TABLE 109 U.S. ANIMAL FEED ORGANIC TRACE MINERALS MARKET, BY FORM, 2018-2032 (THOUSAND TONS)
TABLE 110 U.S. DRY IN ANIMAL FEED ORGANIC TRACE MINERALS MARKET, BY TYPE, 2018-2032 (USD THOUSAND)
TABLE 111 U.S. POWDER IN ANIMAL FEED ORGANIC TRACE MINERALS MARKET, BY TYPE, 2018-2032 (USD THOUSAND)
TABLE 112 U.S. ANIMAL FEED ORGANIC TRACE MINERALS MARKET, BY CHELATE TYPE, 2018-2032 (USD THOUSAND)
TABLE 113 U.S. ANIMAL FEED ORGANIC TRACE MINERALS MARKET, BY CHELATE TYPE, 2018-2032 (THOUSAND TONS)
TABLE 114 U.S. ANIMAL FEED ORGANIC TRACE MINERALS MARKET, BY LIFE CYCLE, 2018-2032 (USD THOUSAND)
TABLE 115 U.S. ANIMAL FEED ORGANIC TRACE MINERALS MARKET, BY LIFE CYCLE, 2018-2032 (THOUSAND TONS)
TABLE 116 U.S. ANIMAL FEED ORGANIC TRACE MINERALS MARKET, BY APPLICATION, 2018-2032 (USD THOUSAND)
TABLE 117 U.S. ANIMAL FEED ORGANIC TRACE MINERALS MARKET, BY APPLICATION, 2018-2032 (THOUSAND TONS)
TABLE 118 U.S. ANIMAL FEED ORGANIC TRACE MINERALS MARKET, BY LIVESTOCK, 2018-2032 (USD THOUSAND)
TABLE 119 U.S. ANIMAL FEED ORGANIC TRACE MINERALS MARKET, BY LIVESTOCK, 2018-2032 (THOUSAND TONS)
TABLE 120 U.S. RUMINANTS IN ANIMAL FEED ORGANIC TRACE MINERALS MARKET, BY TYPE, 2018-2032 (USD THOUSAND)
TABLE 121 U.S. RUMINANTS IN ANIMAL FEED ORGANIC TRACE MINERALS MARKET, BY PRODUCT, 2018-2032 (USD THOUSAND)
TABLE 122 U.S. POULTRY IN ANIMAL FEED ORGANIC TRACE MINERALS MARKET, BY TYPE, 2018-2032 (USD THOUSAND)
TABLE 123 U.S. POULTRY IN ANIMAL FEED ORGANIC TRACE MINERALS MARKET, BY PRODUCT, 2018-2032 (USD THOUSAND)
TABLE 124 U.S. SWINE IN ANIMAL FEED ORGANIC TRACE MINERALS MARKET, BY TYPE, 2018-2032 (USD THOUSAND)
TABLE 125 U.S. SWINE IN ANIMAL FEED ORGANIC TRACE MINERALS MARKET, BY PRODUCT, 2018-2032 (USD THOUSAND)
TABLE 126 U.S. AQUACULTURE IN ANIMAL FEED ORGANIC TRACE MINERALS MARKET, BY TYPE, 2018-2032 (USD THOUSAND)
TABLE 127 U.S. CRUSTACEANS IN ANIMAL FEED ORGANIC TRACE MINERALS MARKET, BY TYPE, 2018-2032 (USD THOUSAND)
TABLE 128 U.S. FISH IN ANIMAL FEED ORGANIC TRACE MINERALS MARKET, BY TYPE, 2018-2032 (USD THOUSAND)
TABLE 129 U.S. MOLLUSKS IN ANIMAL FEED ORGANIC TRACE MINERALS MARKET, BY TYPE, 2018-2032 (USD THOUSAND)
TABLE 130 U.S. AQUACULTURE IN ANIMAL FEED ORGANIC TRACE MINERALS MARKET, BY PRODUCT, 2018-2032 (USD THOUSAND)
TABLE 131 U.S. PETS IN ANIMAL FEED ORGANIC TRACE MINERALS MARKET, BY TYPE, 2018-2032 (USD THOUSAND)
TABLE 132 U.S. PETS IN ANIMAL FEED ORGANIC TRACE MINERALS MARKET, BY PRODUCT, 2018-2032 (USD THOUSAND)
TABLE 133 U.S. EQUINE IN ANIMAL FEED ORGANIC TRACE MINERALS MARKET, BY PRODUCT, 2018-2032 (USD THOUSAND)
TABLE 134 U.S. OTHERS IN ANIMAL FEED ORGANIC TRACE MINERALS MARKET, BY PRODUCT, 2018-2032 (USD THOUSAND)
TABLE 135 CANADA ANIMAL FEED ORGANIC TRACE MINERALS MARKET, BY PRODUCT, 2018-2032 (USD THOUSAND)
TABLE 136 CANADA ANIMAL FEED ORGANIC TRACE MINERALS MARKET, BY PRODUCT, 2018-2032 (THOUSAND TONS)
TABLE 137 CANADA ANIMAL FEED ORGANIC TRACE MINERALS MARKET, BY FORM, 2018-2032 (USD THOUSAND)
TABLE 138 CANADA ANIMAL FEED ORGANIC TRACE MINERALS MARKET, BY FORM, 2018-2032 (THOUSAND TONS)
TABLE 139 CANADA DRY IN ANIMAL FEED ORGANIC TRACE MINERALS MARKET, BY TYPE, 2018-2032 (USD THOUSAND)
TABLE 140 CANADA POWDER IN ANIMAL FEED ORGANIC TRACE MINERALS MARKET, BY TYPE, 2018-2032 (USD THOUSAND)
TABLE 141 CANADA ANIMAL FEED ORGANIC TRACE MINERALS MARKET, BY CHELATE TYPE, 2018-2032 (USD THOUSAND)
TABLE 142 CANADA ANIMAL FEED ORGANIC TRACE MINERALS MARKET, BY CHELATE TYPE, 2018-2032 (THOUSAND TONS)
TABLE 143 CANADA ANIMAL FEED ORGANIC TRACE MINERALS MARKET, BY LIFE CYCLE, 2018-2032 (USD THOUSAND)
TABLE 144 CANADA ANIMAL FEED ORGANIC TRACE MINERALS MARKET, BY LIFE CYCLE, 2018-2032 (THOUSAND TONS)
TABLE 145 CANADA ANIMAL FEED ORGANIC TRACE MINERALS MARKET, BY APPLICATION, 2018-2032 (USD THOUSAND)
TABLE 146 CANADA ANIMAL FEED ORGANIC TRACE MINERALS MARKET, BY APPLICATION, 2018-2032 (THOUSAND TONS)
TABLE 147 CANADA ANIMAL FEED ORGANIC TRACE MINERALS MARKET, BY LIVESTOCK, 2018-2032 (USD THOUSAND)
TABLE 148 CANADA ANIMAL FEED ORGANIC TRACE MINERALS MARKET, BY LIVESTOCK, 2018-2032 (THOUSAND TONS)
TABLE 149 CANADA RUMINANTS IN ANIMAL FEED ORGANIC TRACE MINERALS MARKET, BY TYPE, 2018-2032 (USD THOUSAND)
TABLE 150 CANADA RUMINANTS IN ANIMAL FEED ORGANIC TRACE MINERALS MARKET, BY PRODUCT, 2018-2032 (USD THOUSAND)
TABLE 151 CANADA POULTRY IN ANIMAL FEED ORGANIC TRACE MINERALS MARKET, BY TYPE, 2018-2032 (USD THOUSAND)
TABLE 152 CANADA POULTRY IN ANIMAL FEED ORGANIC TRACE MINERALS MARKET, BY PRODUCT, 2018-2032 (USD THOUSAND)
TABLE 153 CANADA SWINE IN ANIMAL FEED ORGANIC TRACE MINERALS MARKET, BY TYPE, 2018-2032 (USD THOUSAND)
TABLE 154 CANADA SWINE IN ANIMAL FEED ORGANIC TRACE MINERALS MARKET, BY PRODUCT, 2018-2032 (USD THOUSAND)
TABLE 155 CANADA AQUACULTURE IN ANIMAL FEED ORGANIC TRACE MINERALS MARKET, BY TYPE, 2018-2032 (USD THOUSAND)
TABLE 156 CANADA CRUSTACEANS IN ANIMAL FEED ORGANIC TRACE MINERALS MARKET, BY TYPE, 2018-2032 (USD THOUSAND)
TABLE 157 CANADA FISH IN ANIMAL FEED ORGANIC TRACE MINERALS MARKET, BY TYPE, 2018-2032 (USD THOUSAND)
TABLE 158 CANADA MOLLUSKS IN ANIMAL FEED ORGANIC TRACE MINERALS MARKET, BY TYPE, 2018-2032 (USD THOUSAND)
TABLE 159 CANADA AQUACULTURE IN ANIMAL FEED ORGANIC TRACE MINERALS MARKET, BY PRODUCT, 2018-2032 (USD THOUSAND)
TABLE 160 CANADA PETS IN ANIMAL FEED ORGANIC TRACE MINERALS MARKET, BY TYPE, 2018-2032 (USD THOUSAND)
TABLE 161 CANADA PETS IN ANIMAL FEED ORGANIC TRACE MINERALS MARKET, BY PRODUCT, 2018-2032 (USD THOUSAND)
TABLE 162 CANADA EQUINE IN ANIMAL FEED ORGANIC TRACE MINERALS MARKET, BY PRODUCT, 2018-2032 (USD THOUSAND)
TABLE 163 CANADA OTHERS IN ANIMAL FEED ORGANIC TRACE MINERALS MARKET, BY PRODUCT, 2018-2032 (USD THOUSAND)
TABLE 164 MEXICO ANIMAL FEED ORGANIC TRACE MINERALS MARKET, BY PRODUCT, 2018-2032 (USD THOUSAND)
TABLE 165 MEXICO ANIMAL FEED ORGANIC TRACE MINERALS MARKET, BY PRODUCT, 2018-2032 (THOUSAND TONS)
TABLE 166 MEXICO ANIMAL FEED ORGANIC TRACE MINERALS MARKET, BY FORM, 2018-2032 (USD THOUSAND)
TABLE 167 MEXICO ANIMAL FEED ORGANIC TRACE MINERALS MARKET, BY FORM, 2018-2032 (THOUSAND TONS)
TABLE 168 MEXICO DRY IN ANIMAL FEED ORGANIC TRACE MINERALS MARKET, BY TYPE, 2018-2032 (USD THOUSAND)
TABLE 169 MEXICO POWDER IN ANIMAL FEED ORGANIC TRACE MINERALS MARKET, BY TYPE, 2018-2032 (USD THOUSAND)
TABLE 170 MEXICO ANIMAL FEED ORGANIC TRACE MINERALS MARKET, BY CHELATE TYPE, 2018-2032 (USD THOUSAND)
TABLE 171 MEXICO ANIMAL FEED ORGANIC TRACE MINERALS MARKET, BY CHELATE TYPE, 2018-2032 (THOUSAND TONS)
TABLE 172 MEXICO ANIMAL FEED ORGANIC TRACE MINERALS MARKET, BY LIFE CYCLE, 2018-2032 (USD THOUSAND)
TABLE 173 MEXICO ANIMAL FEED ORGANIC TRACE MINERALS MARKET, BY LIFE CYCLE, 2018-2032 (THOUSAND TONS)
TABLE 174 MEXICO ANIMAL FEED ORGANIC TRACE MINERALS MARKET, BY APPLICATION, 2018-2032 (USD THOUSAND)
TABLE 175 MEXICO ANIMAL FEED ORGANIC TRACE MINERALS MARKET, BY APPLICATION, 2018-2032 (THOUSAND TONS)
TABLE 176 MEXICO ANIMAL FEED ORGANIC TRACE MINERALS MARKET, BY LIVESTOCK, 2018-2032 (USD THOUSAND)
TABLE 177 MEXICO ANIMAL FEED ORGANIC TRACE MINERALS MARKET, BY LIVESTOCK, 2018-2032 (THOUSAND TONS)
TABLE 178 MEXICO RUMINANTS IN ANIMAL FEED ORGANIC TRACE MINERALS MARKET, BY TYPE, 2018-2032 (USD THOUSAND)
TABLE 179 MEXICO RUMINANTS IN ANIMAL FEED ORGANIC TRACE MINERALS MARKET, BY PRODUCT, 2018-2032 (USD THOUSAND)
TABLE 180 MEXICO POULTRY IN ANIMAL FEED ORGANIC TRACE MINERALS MARKET, BY TYPE, 2018-2032 (USD THOUSAND)
TABLE 181 MEXICO POULTRY IN ANIMAL FEED ORGANIC TRACE MINERALS MARKET, BY PRODUCT, 2018-2032 (USD THOUSAND)
TABLE 182 MEXICO SWINE IN ANIMAL FEED ORGANIC TRACE MINERALS MARKET, BY TYPE, 2018-2032 (USD THOUSAND)
TABLE 183 MEXICO SWINE IN ANIMAL FEED ORGANIC TRACE MINERALS MARKET, BY PRODUCT, 2018-2032 (USD THOUSAND)
TABLE 184 MEXICO AQUACULTURE IN ANIMAL FEED ORGANIC TRACE MINERALS MARKET, BY TYPE, 2018-2032 (USD THOUSAND)
TABLE 185 MEXICO CRUSTACEANS IN ANIMAL FEED ORGANIC TRACE MINERALS MARKET, BY TYPE, 2018-2032 (USD THOUSAND)
TABLE 186 MEXICO FISH IN ANIMAL FEED ORGANIC TRACE MINERALS MARKET, BY TYPE, 2018-2032 (USD THOUSAND)
TABLE 187 MEXICO MOLLUSKS IN ANIMAL FEED ORGANIC TRACE MINERALS MARKET, BY TYPE, 2018-2032 (USD THOUSAND)
TABLE 188 MEXICO AQUACULTURE IN ANIMAL FEED ORGANIC TRACE MINERALS MARKET, BY PRODUCT, 2018-2032 (USD THOUSAND)
TABLE 189 MEXICO PETS IN ANIMAL FEED ORGANIC TRACE MINERALS MARKET, BY TYPE, 2018-2032 (USD THOUSAND)
TABLE 190 MEXICO PETS IN ANIMAL FEED ORGANIC TRACE MINERALS MARKET, BY PRODUCT, 2018-2032 (USD THOUSAND)
TABLE 191 MEXICO EQUINE IN ANIMAL FEED ORGANIC TRACE MINERALS MARKET, BY PRODUCT, 2018-2032 (USD THOUSAND)
TABLE 192 MEXICO OTHERS IN ANIMAL FEED ORGANIC TRACE MINERALS MARKET, BY PRODUCT, 2018-2032 (USD THOUSAND)
List of Figure
FIGURE 1 NORTH AMERICA ANIMAL FEED ORGANIC TRACE MINERALS MARKET
FIGURE 2 NORTH AMERICA ANIMAL FEED ORGANIC TRACE MINERALS MARKET: DATA TRIANGULATION
FIGURE 3 NORTH AMERICA ANIMAL FEED ORGANIC TRACE MINERALS MARKET: DROC ANALYSIS
FIGURE 4 NORTH AMERICA ANIMAL FEED ORGANIC TRACE MINERALS MARKET: NORTH AMERICA VS REGIONAL MARKET ANALYSIS
FIGURE 5 NORTH AMERICA ANIMAL FEED ORGANIC TRACE MINERALS MARKET: COMPANY RESEARCH ANALYSIS
FIGURE 6 NORTH AMERICA ANIMAL FEED ORGANIC TRACE MINERALS MARKET: MULTIVARIATE MODELLING
FIGURE 7 NORTH AMERICA ANIMAL FEED ORGANIC TRACE MINERALS MARKET: INTERVIEW DEMOGRAPHICS
FIGURE 8 NORTH AMERICA ANIMAL FEED ORGANIC TRACE MINERALS MARKET: DBMR MARKET POSITION GRID
FIGURE 9 NORTH AMERICA ANIMAL FEED ORGANIC TRACE MINERALS MARKET: VENDOR SHARE ANALYSIS
FIGURE 10 NORTH AMERICA ANIMAL FEED ORGANIC TRACE MINERALS MARKET: MARKET APPLICATION COVERAGE GRID
FIGURE 11 NORTH AMERICA ANIMAL FEED ORGANIC TRACE MINERALS MARKET: SEGMENTATION
FIGURE 12 NORTH AMERICA ANIMAL FEED ORGANIC TRACE MINERALS MARKET: EXECUTIVE SUMMARY
FIGURE 13 SEVENTEEN SEGMENTS COMPRISE THE NORTH AMERICA ANIMAL FEED ORGANIC TRACE MINERALS MARKET, BY PRODUCT (2024)
FIGURE 14 NORTH AMERICA ANIMAL FEED ORGANIC TRACE MINERALS MARKET: STRATEGIC DECISIONS
FIGURE 15 RISING DEMAND FOR NUTRIENT-ENRICHED ANIMAL-DERIVED FOOD PRODUCTS IS EXPECTED TO DRIVE THE NORTH AMERICA ANIMAL FEED ORGANIC TRACE MINERALS MARKET IN THE FORECAST PERIOD
FIGURE 16 THE CALCIUM SEGMENT IS EXPECTED TO ACCOUNT FOR THE LARGEST SHARE OF THE NORTH AMERICA ANIMAL FEED ORGANIC TRACE MINERALS MARKET IN 2025 AND 2032
FIGURE 17 PORTER’S FIVE FORCES ANALYSIS
FIGURE 18 NUMBER OF PATENTS V/S YEAR
FIGURE 19 NUMBER OF PATENTS PER APPLICANT
FIGURE 20 COUNTRY V/S NUMBER OF PATENTS
FIGURE 21 PRICING ANALYSIS
FIGURE 22 IMPORT EXPORT SCENARIO (USD THOUSAND)
FIGURE 23 DROC ANALYSIS
FIGURE 24 NORTH AMERICA ANIMAL FEED ORGANIC TRACE MINERALS MARKET: BY PRODUCT, 2024
FIGURE 25 NORTH AMERICA ANIMAL FEED ORGANIC TRACE MINERALS MARKET: BY FORM, 2024
FIGURE 26 NORTH AMERICA ANIMAL FEED ORGANIC TRACE MINERALS MARKET: BY CHELATE TYPE, 2024
FIGURE 27 NORTH AMERICA ANIMAL FEED ORGANIC TRACE MINERALS MARKET: BY LIFE CYCLE, 2024
FIGURE 28 NORTH AMERICA ANIMAL FEED ORGANIC TRACE MINERALS MARKET: BY APPLICATION, 2024
FIGURE 29 NORTH AMERICA ANIMAL FEED ORGANIC TRACE MINERALS MARKET: BY LIVESTOCK, 2024
FIGURE 30 NORTH AMERICA ANIMAL FEED ORGANIC TRACE MINERALS MARKET: SNAPSHOT (2024)
FIGURE 31 NORTH AMERICA ANIMAL FEED ORGANIC TRACE MINERALS MARKET: COMPANY SHARE 2024 (%)
North America Animal Feed Organic Trace Minerals Market, Supply Chain Analysis and Ecosystem Framework
To support market growth and help clients navigate the impact of geopolitical shifts, DBMR has integrated in-depth supply chain analysis into its North America Animal Feed Organic Trace Minerals Market research reports. This addition empowers clients to respond effectively to global changes affecting their industries. The supply chain analysis section includes detailed insights such as North America Animal Feed Organic Trace Minerals Market consumption and production by country, price trend analysis, the impact of tariffs and geopolitical developments, and import and export trends by country and HSN code. It also highlights major suppliers with data on production capacity and company profiles, as well as key importers and exporters. In addition to research, DBMR offers specialized supply chain consulting services backed by over a decade of experience, providing solutions like supplier discovery, supplier risk assessment, price trend analysis, impact evaluation of inflation and trade route changes, and comprehensive market trend analysis.
Data collection and base year analysis are done using data collection modules with large sample sizes. The stage includes obtaining market information or related data through various sources and strategies. It includes examining and planning all the data acquired from the past in advance. It likewise envelops the examination of information inconsistencies seen across different information sources. The market data is analysed and estimated using market statistical and coherent models. Also, market share analysis and key trend analysis are the major success factors in the market report. To know more, please request an analyst call or drop down your inquiry.
The key research methodology used by DBMR research team is data triangulation which involves data mining, analysis of the impact of data variables on the market and primary (industry expert) validation. Data models include Vendor Positioning Grid, Market Time Line Analysis, Market Overview and Guide, Company Positioning Grid, Patent Analysis, Pricing Analysis, Company Market Share Analysis, Standards of Measurement, Global versus Regional and Vendor Share Analysis. To know more about the research methodology, drop in an inquiry to speak to our industry experts.
Data Bridge Market Research is a leader in advanced formative research. We take pride in servicing our existing and new customers with data and analysis that match and suits their goal. The report can be customized to include price trend analysis of target brands understanding the market for additional countries (ask for the list of countries), clinical trial results data, literature review, refurbished market and product base analysis. Market analysis of target competitors can be analyzed from technology-based analysis to market portfolio strategies. We can add as many competitors that you require data about in the format and data style you are looking for. Our team of analysts can also provide you data in crude raw excel files pivot tables (Fact book) or can assist you in creating presentations from the data sets available in the report.


