
North America Anti Money Laundering Market
Market Size in USD Billion
 USD
1.17 Billion
USD
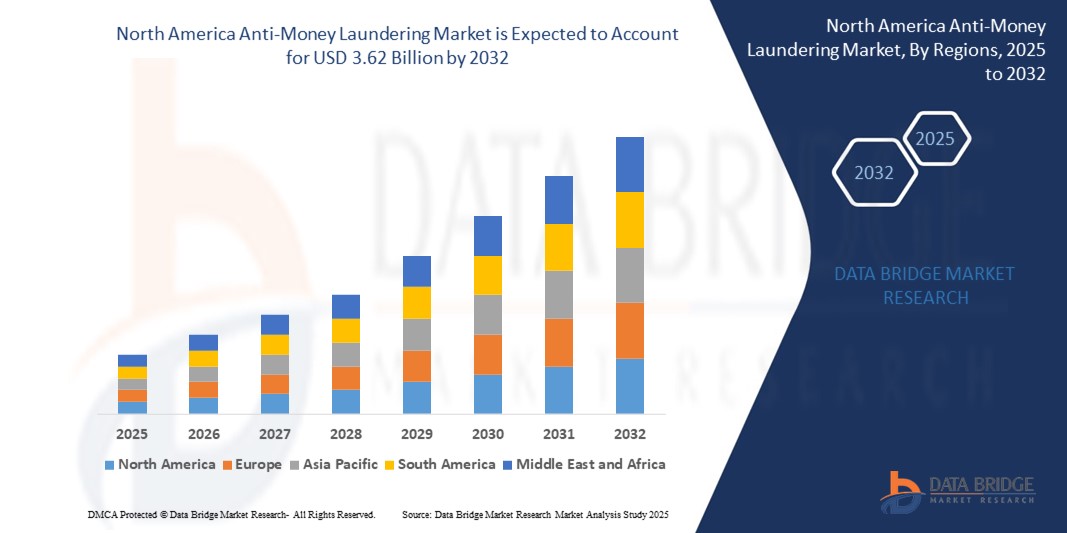
3.62 Billion
2024
2032
USD
1.17 Billion
USD
3.62 Billion
2024
2032
| 2025 - 2032 | |
| USD 1.17 Billion | |
| USD 3.62 Billion | |
| % | |
|
Anti-Money Laundering Market Size
- The North America anti-money laundering market size was valued at USD 1.17 billion in 2024 and is expected to reach USD 3.62 billion by 2032, at a CAGR of 15.1% during the forecast period
- The market growth is primarily driven by increasing regulatory scrutiny, advancements in financial technology, and the rising adoption of digital banking solutions, necessitating robust anti-money laundering (AML) systems
- In addition, heightened awareness of financial crimes, such as money laundering and terrorist financing, coupled with stringent government regulations, is propelling the demand for advanced AML solutions across various sectors
Anti-Money Laundering Market Analysis
- Anti-money laundering solutions, encompassing software and services designed to detect and prevent financial crimes, are critical for ensuring compliance with regulatory frameworks and safeguarding financial systems in North America
- The surge in demand for anti-money laundering solutions is fueled by the growing complexity of financial transactions, increasing digitalization of banking services, and the need for real-time transaction monitoring to combat illicit activities
- The U.S. dominated the North America anti-money laundering market with the largest revenue share of 65.4% in 2024, driven by stringent regulatory requirements, a well-established financial sector, and significant investments in anti-money laundering technologies by banks and financial institutions
- Canada is expected to be the fastest-growing country in the North America anti-money laundering market during the forecast period, attributed to increasing government initiatives to combat financial crimes, rapid digital transformation in the financial sector, and growing adoption of cloud-based anti-money laundering solutions
- The solutions segment held the largest market revenue share of 60.2% in 2024, driven by the increasing demand for advanced anti-money laundering software that enables real-time transaction monitoring, compliance management, and customer identity verification
Report Scope and Anti-Money Laundering Market Segmentation
|
Attributes |
Anti-Money Laundering Key Market Insights |
|
Segments Covered |
|
|
Countries Covered |
North America
|
|
Key Market Players |
|
|
Market Opportunities |
|
|
Value Added Data Infosets |
In addition to the market insights such as market value, growth rate, market segments, geographical coverage, market players, and market scenario, the market report curated by the Data Bridge Market Research team includes in-depth expert analysis, import/export analysis, pricing analysis, production consumption analysis, and pestle analysis. |
Anti-Money Laundering Market Trends
“Increasing Integration of AI and Machine Learning Technologies”
- The North America Anti-Money Laundering (AML) market is experiencing a significant trend toward the integration of Artificial Intelligence (AI) and Machine Learning (ML) technologies
- These technologies enable advanced data processing and analysis, providing deeper insights into transaction patterns, customer behavior, and potential financial crime risks
- AI-powered anti-money laundering solutions facilitate proactive risk management by identifying suspicious activities and patterns before they escalate into major compliance issues
- For instance, companies such as ThetaRay and Oracle are developing AI-driven platforms that analyze transactional data to detect financial crimes such as money laundering, terrorist financing, and fraud, while also optimizing compliance processes
- This trend enhances the efficiency and accuracy of AML systems, making them more appealing to financial institutions, government bodies, and other regulated entities
- AI algorithms can analyze vast datasets, including unusual transaction behaviors, cross-border activities, and historical patterns, to reduce false positives and improve detection accuracy
Anti-Money Laundering Market Dynamics
Driver
“Rising Demand for Regulatory Compliance and Advanced Fraud Detection”
- The increasing regulatory scrutiny and demand for robust compliance frameworks, driven by laws such as the U.S. Bank Secrecy Act (BSA), USA PATRIOT Act, and Canada’s Proceeds of Crime (Money Laundering) and Terrorist Financing Act, are major drivers for the North America AML market
- Anti-money laundering systems enhance financial security by providing features such as real-time transaction monitoring, customer identity verification, and automated suspicious activity reporting
- Government mandates in the U.S. and Canada are pushing financial institutions to adopt advanced anti-money laundering solutions to meet stringent compliance requirements
- The proliferation of digital banking, online payments, and cryptocurrency transactions is further expanding anti-money laundering applications, supported by faster data transmission and lower latency enabled by 5G technology
- Financial institutions are increasingly adopting integrated anti-money laundering systems as standard solutions to meet regulatory expectations and enhance operational integrity
Restraint/Challenge
“High Implementation Costs and Data Privacy Concerns”
- The significant initial investment required for anti-money laundering hardware, software, and integration can be a major barrier to adoption, particularly for small and medium enterprises (SMEs) in North America
- Implementing anti-money laundering systems into existing financial infrastructures can be complex and costly, requiring specialized expertise and resources
- Data security and privacy concerns are a critical challenge, as anti-money laundering systems collect and transmit large volumes of sensitive customer and transaction data, raising risks of breaches or misuse
- The fragmented regulatory landscape across the U.S. and Canada regarding data protection and compliance standards complicates operations for multinational organizations and service providers
- These factors can deter adoption, particularly in regions with high cost sensitivity or heightened awareness of data privacy issues, potentially limiting market growth
Anti-Money Laundering market Scope
The market is segmented on the basis of offering, function, deployment, enterprise size, and end use.
- By Offering
On the basis of offering, the North America anti-money laundering market is segmented into solutions and services. The solutions segment held the largest market revenue share of 60.2% in 2024, driven by the increasing demand for advanced anti-money laundering software that enables real-time transaction monitoring, compliance management, and customer identity verification. These solutions leverage AI and machine learning to enhance detection of financial crimes such as money laundering and terrorist financing.
The services segment is expected to witness the fastest growth rate of 15.8% from 2025 to 2032, driven by the rising need for expert guidance and managed services to navigate complex anti-money laundering regulations. Financial institutions are increasingly outsourcing compliance tasks to ensure cost-effective regulatory adherence and reduce operational risks.
- By Function
On the basis of function, the North America anti-money laundering market is segmented into compliance management, customer identity management, transaction monitoring, currency transaction reporting, and others. The compliance management segment dominated the market with a 32.6% revenue share in 2024, owing to stringent regulations and the need for financial institutions to strengthen their anti-money laundering frameworks to avoid penalties and ensure regulatory compliance.
The transaction monitoring segment is anticipated to experience the fastest growth rate of 16.4% from 2025 to 2032, driven by the increasing adoption of AI-driven systems that enhance the detection of suspicious transactions and reduce false positives, improving efficiency in combating financial crimes.
- By Deployment
On the basis of deployment, the North America anti-money laundering market is segmented into cloud and on-premise. The cloud segment held the largest market revenue share of 54.4% in 2024, attributed to its flexibility, scalability, and cost-effectiveness, enabling financial institutions to integrate advanced technologies such as AI and real-time analytics without significant infrastructure investments.
The on-premise segment is expected to witness significant growth from 2025 to 2032, driven by organizations prioritizing control and security over their compliance systems. On-premise solutions offer customization and integration with existing IT infrastructure, which is crucial for large enterprises with complex regulatory needs.
- By Enterprise Size
On the basis of enterprise size, the North America anti-money laundering market is segmented into large enterprises and small & medium enterprises (SMEs). The large enterprises segment dominated the market with a 56.8% revenue share in 2024, driven by their focus on digital payment systems and the need for robust anti-money laundering solutions to address transaction monitoring and compliance requirements in high-volume financial operations.
The SMEs segment is anticipated to grow rapidly at a CAGR of 17.2% from 2025 to 2032, fueled by increasing awareness of anti-money laundering regulations and the adoption of cost-effective cloud-based solutions that cater to smaller organizations with limited resources.
- By End Use
On the basis of end use, the North America anti-money laundering market is segmented into banks & financial institutions, insurance providers, government, gaming & gambling, and others. The banks & financial institutions segment held the largest market revenue share of 45.3% in 2024, driven by the critical need for anti-money laundering solutions to combat financial crimes such as fraud, terrorist financing, and money laundering in the banking sector.
The gaming & gambling segment is expected to witness the fastest growth rate of 18.1% from 2025 to 2032, fueled by the rising adoption of anti-money laundering solutions to monitor high-risk transactions and ensure compliance with regulations, particularly in online gambling platforms where illicit financial flows are a concern.
Anti-Money Laundering Market Regional Analysis
- The U.S. dominated the North America anti-money laundering market with the largest revenue share of 65.4% in 2024, driven by stringent regulatory requirements, a well-established financial sector, and significant investments in anti-money laundering technologies by banks and financial institutions
- The trend towards digital banking and stringent regulations, such as the Bank Secrecy Act and the USA PATRIOT Act, further boost market expansion. Financial institutions’ growing adoption of AI and machine learning-based AML solutions complements traditional compliance measures, creating a robust market ecosystem
Canada Anti-Money Laundering Market Insight
Canada is expected to witness the fastest growth rate in the North America AML market, driven by increasing regulatory emphasis on financial crime prevention and rising adoption of advanced AML technologies. Financial institutions seek solutions that enhance transaction monitoring and customer identity management while ensuring compliance with the Proceeds of Crime (Money Laundering) and Terrorist Financing Act. The growth is prominent in both large financial institutions and smaller enterprises, with significant uptake due to rising cybercrime concerns and digital transaction volumes.
Europe Anti-Money Laundering Market Insight
The Europe AML market is expected to witness significant growth, supported by stringent regulatory frameworks and a focus on financial transparency. Organizations seek AML solutions that improve compliance management and transaction monitoring while addressing complex financial crime patterns. Growth is notable in both cloud and on-premise deployments, with countries such as Germany and the U.K. showing increased adoption due to heightened regulatory scrutiny and financial crime risks.
Anti-Money Laundering Market Share
The anti-money laundering industry is primarily led by well-established companies, including:
- NICE (Israel)
- IBM (U.S.)
- sanctions.io (U.S.)
- Intel Corporation (U.S.)
- Oracle (U.S.)
- SAP SE (Germany)
- Accenture (U.S.)
- Experian Information Solution
- Inc. (Ireland)
- Open Text Corporation (Canada)
- BAE Systems (U.K.)
- SAS Institute Inc (U.S.)
- ACI Worldwide (U.S.)
- Cognizant (U.S.)
- Trulioo (Canada)
- Temenos Headquarters SA (Switzerland)
- WorkFusion, Inc, (U.S.)
- Vixio Regulatory Intelligence (England)
What are the Recent Developments in North America Anti-Money Laundering Market?
- In April 2025, FIS announced the acquisition of Global Payments’ Issuer Solutions business reinforcing its position as a globally scaled fintech leader. The deal adds a robust suite of credit processing, fraud prevention, loyalty, and value-added services to FIS’s existing debit and banking capabilities, creating a comprehensive offering for financial institutions. The acquisition is expected to generate in annual revenue synergies and $150 million in EBITDA synergies within three years. This strategic move also supports AML compliance, expands FIS’s reach across 75+ countries, and replaces its minority stake in Worldpay with high-margin recurring revenues
- In February 2025, LexisNexis Risk Solutions, a subsidiary of RELX, completed its acquisition of IDVerse™, a pioneer in AI-powered document authentication and fraud detection. Founded in Australia, IDVerse uses deep neural networks and biometric algorithms to verify over 16,000 types of identity documents globally. The technology will be integrated into LexisNexis’s RiskNarrative®, IDU®, and Dynamic Decision Platform®, enhancing its multi-layered identity verification and AML compliance capabilities. This strategic move bolsters defenses against AI-generated fraud, including deepfakes, and supports financial inclusion by enabling secure, scalable onboarding across industries
- In October 2024, Oracle Financial Services launched its AI-powered Investigation Hub, a cloud-based case management solution designed to transform financial crime investigations. Built on Oracle Cloud Infrastructure (OCI), the platform leverages graph analytics and embedded AI to automate manual tasks, eliminate data silos, and deliver auto-generated narratives that reduce investigation time by up to 70%. The tool integrates seamlessly with Oracle’s FCCM suite and third-party data providers, enabling compliance teams to collaborate more effectively and focus on high-value analysis. This innovation supports AML efforts by enhancing speed, accuracy, and regulatory adaptability across financial institutions
- In April 2024, Oracle Financial Services introduced the Compliance Agent, an AI-powered cloud service designed to help banks proactively combat anti-money laundering (AML) risks. Leveraging hypothetical scenario testing, the platform enables institutions to fine-tune transaction monitoring systems (TMS), assess risk profiles of new products, and optimize controls for high-risk typologies such as human trafficking. By automating model risk analysis and supporting evidence-based decisions, Compliance Agent reduces compliance costs and enhances regulatory readiness. This launch underscores the growing adoption of AI and cloud technologies in financial crime prevention and reflects Oracle’s commitment to scalable, data-driven compliance solutions
- In November 2023, SAS Institute entered a strategic collaboration agreement (SCA) with Amazon Web Services (AWS) to enhance cloud-native analytics and data performance for enterprise clients. The partnership includes the integration of SAS Customer Intelligence 360 into AWS Marketplace, simplifying access to AI-powered customer engagement tools. While not an AML-specific launch, this cloud infrastructure advancement supports scalable, secure platforms that can underpin anti-money laundering (AML) solutions, fraud detection, and compliance analytics. The collaboration also sets the stage for future integration with Amazon Bedrock and SAS Viya, expanding generative AI capabilities across financial services and other regulated industries
SKU-

- Interactive Data Analysis Dashboard
- Company Analysis Dashboard for high growth potential opportunities
- Research Analyst Access for customization & queries
- Competitor Analysis with Interactive dashboard
- Latest News, Updates & Trend analysis
- Harness the Power of Benchmark Analysis for Comprehensive Competitor Tracking
Data collection and base year analysis are done using data collection modules with large sample sizes. The stage includes obtaining market information or related data through various sources and strategies. It includes examining and planning all the data acquired from the past in advance. It likewise envelops the examination of information inconsistencies seen across different information sources. The market data is analysed and estimated using market statistical and coherent models. Also, market share analysis and key trend analysis are the major success factors in the market report. To know more, please request an analyst call or drop down your inquiry.
The key research methodology used by DBMR research team is data triangulation which involves data mining, analysis of the impact of data variables on the market and primary (industry expert) validation. Data models include Vendor Positioning Grid, Market Time Line Analysis, Market Overview and Guide, Company Positioning Grid, Patent Analysis, Pricing Analysis, Company Market Share Analysis, Standards of Measurement, Global versus Regional and Vendor Share Analysis. To know more about the research methodology, drop in an inquiry to speak to our industry experts.
Data Bridge Market Research is a leader in advanced formative research. We take pride in servicing our existing and new customers with data and analysis that match and suits their goal. The report can be customized to include price trend analysis of target brands understanding the market for additional countries (ask for the list of countries), clinical trial results data, literature review, refurbished market and product base analysis. Market analysis of target competitors can be analyzed from technology-based analysis to market portfolio strategies. We can add as many competitors that you require data about in the format and data style you are looking for. Our team of analysts can also provide you data in crude raw excel files pivot tables (Fact book) or can assist you in creating presentations from the data sets available in the report.


