
North America Auv And Rov Market
Market Size in USD Billion
 USD
1.71 Billion
USD
3.86 Billion
2025
2033
USD
1.71 Billion
USD
3.86 Billion
2025
2033
| 2026 - 2033 | |
| USD 1.71 Billion | |
| USD 3.86 Billion | |
| % | |
|
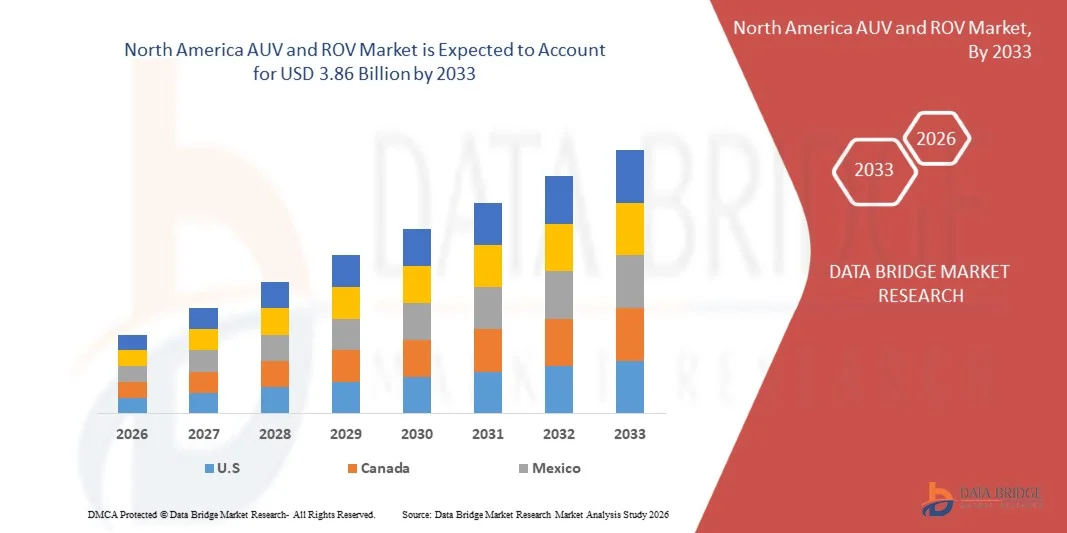
North America AUV and ROV Market Size
- The North America AUV and ROV Market is expected to reach USD 3.86 Billion by 2033 from USD 1.71 Billion in 2025, growing with a CAGR of 10.9% in the forecast period of 2026 to 2033.
- The North America AUV and ROV Market is witnessing steady expansion, supported by the growing deployment of autonomous and remotely operated underwater vehicles across key sectors such as offshore oil & gas, marine research, defense, renewable energy, and underwater infrastructure inspection. These systems are increasingly valued for their ability to enhance operational efficiency, improve subsea data accuracy, and reduce human risk in complex underwater environments.
- Ongoing technological advancements in vehicle design, navigation systems, sensor integration, artificial intelligence, and communication capabilities—along with improvements in reliability and performance standards—are accelerating the adoption of advanced AUV and ROV platforms. These innovations are enabling high-end applications including deep-sea exploration, pipeline inspection, seabed mapping, and precision underwater monitoring, thereby driving improved operational outcomes and long-term cost efficiencies.
- Favorable regulatory initiatives supporting maritime safety, environmental monitoring, and offshore energy development, combined with stricter compliance requirements for underwater inspections and ecological protection, are prompting industry stakeholders to increasingly adopt AUV and ROV solutions. These systems are emerging as efficient, sustainable, and safer alternatives to conventional manned underwater operations.
North America AUV and ROV Market Analysis
- The North America AUV and ROV Market supports a broad spectrum of end-use industries, including offshore oil & gas, defense and naval operations, marine research, underwater construction, and renewable energy. Market demand is largely driven by the vehicles’ advanced navigation, imaging, and manipulation capabilities, positioning them as critical platforms for complex subsea operations and mission-critical underwater tasks.
- Increasing integration of advanced technologies such as artificial intelligence, machine learning–based navigation, autonomous mission planning, and real-time data analytics is enhancing the operational efficiency and accuracy of AUV and ROV systems. These innovations are supporting market growth across commercial, industrial, and defense-related underwater applications.
- The U.S. is expected to dominate the North America AUV & ROV market with the largest market share of 77.75% in 2026 and is also projected to record strong growth. This dominance is supported by the country’s well-established offshore energy sector, advanced maritime engineering capabilities, and extensive subsea operations ecosystem. Strong demand from oil & gas, offshore wind, naval defense, and marine research activities, along with the presence of leading subsea service providers and continuous technological innovation, further strengthens the U.K.’s market leadership and sustained growth potential in the region.
- The U.S. AUV & ROV market is poised to grow at the fastest CAGR 11.1% from 2026 to 2033, driven by increasing investments in offshore renewable energy projects, expanding naval defense initiatives, and rising adoption of autonomous and remotely operated underwater systems. Growth is further supported by technological advancements in navigation, sensors, and robotics, as well as strong government support for marine research and subsea infrastructure development, enabling improved operational efficiency, safety, and precision in underwater missions.
- In 2025, the Remotely Operated Vehicles (ROV) segment is expected to hold a dominant share of approximately 53.21% of the North America AUV and ROV Market, driven by its widespread adoption across offshore oil & gas operations, subsea inspection, and underwater construction activities. The segment benefits from proven operational reliability, high payload capacity, and cost-effectiveness for complex and long-duration missions, positioning ROVs as the preferred solution compared to fully autonomous alternatives in demanding underwater environments
Report Scope and North America AUV and ROV Market Segmentation
|
Attributes |
North America AUV & ROV Key Market Insights |
|
Segments Covered |
|
|
Countries Covered |
|
|
Key Market Players |
|
|
Market Opportunities |
|
|
Value Added Data Infosets |
In addition to the market insights such as market value, growth rate, market segments, geographical coverage, market players, and market scenario, the market report curated by the Data Bridge Market Research team includes in-depth expert analysis, import/export analysis, pricing analysis, production consumption analysis, and pestle analysis. |
AUV & ROV Market Trends
“Integration with Smart Marine Operations, Offshore Infrastructure, and Autonomous Underwater Ecosystems”
- AUV and ROV systems are increasingly integrated into smart marine and offshore operational environments, supporting subsea inspection, asset monitoring, seabed mapping, and environmental assessment activities. These platforms enable continuous underwater data acquisition, precision navigation, and autonomous or remote-controlled operations aligned with Industry 4.0 principles in offshore and maritime industries.
- In offshore production, subsea construction, and underwater maintenance facilities, AUV and ROV technologies support structural inspection, corrosion monitoring, and equipment diagnostics, enhancing operational efficiency, asset reliability, and long-term infrastructure integrity across harsh marine environments.
- The growing integration of AUVs and ROVs into autonomous vessels, offshore wind farms, digital twin platforms, and real-time subsea monitoring systems supports large-scale offshore efficiency by improving inspection accuracy, reducing human intervention, minimizing operational risk, and enabling data-driven decision-making across marine operations.
For instance,
- In January 2025, advanced AUV and ROV platforms were increasingly integrated into offshore inspection and monitoring systems. These systems, combined with high-resolution sonar, underwater sensors, and digital analytics platforms, improved operational efficiency, data consistency, and safety across subsea operations, highlighting the role of underwater robotic systems in next-generation offshore ecosystems.
- Recent industry developments indicate rising adoption of modular ROV systems, AI-enabled AUV navigation, and sensor-rich underwater platforms in high-performance offshore, defense, and scientific research applications. Expanding automation, data-centric marine operations, and environmental compliance requirements reinforce the growing importance of AUV and ROV systems beyond traditional underwater inspection activities.
AUV & ROV Market Dynamics
Driver
“Rising Offshore Modernization and Performance-Driven Subsea Operation Requirements”
- The North America offshore and maritime sector is witnessing accelerated adoption of advanced AUV and ROV systems driven by increasingly complex operational requirements across oil & gas, renewable energy, defense, scientific research, and subsea infrastructure applications. Operators are prioritizing these systems for their ability to enhance operational safety, precision, endurance, and reliability while minimizing human exposure to deepwater and hazardous environments. As offshore operations evolve toward higher efficiency, automation, and sustainability, demand is growing for underwater robotic solutions that support continuous monitoring, accurate intervention, and optimized asset management.
- The expanding role of AUV and ROV technologies within offshore modernization initiatives has created a dynamic environment for innovation, leading to advancements in vehicle autonomy, sensor integration, power efficiency, and mission flexibility. In response to this demand-driven shift, manufacturers are investing in the development of application-specific underwater systems tailored for deepwater exploration, pipeline inspection, offshore wind farm monitoring, and defense surveillance, including work-class ROVs, long-endurance AUVs, and hybrid autonomous platforms.
- These innovations are largely driven by the operational needs of modern offshore industries, which require adaptable underwater systems capable of performing reliably under extreme depths, variable sea conditions, and strict regulatory environments. As operators increasingly integrate AUVs and ROVs into inspection, maintenance, and environmental monitoring workflows, this momentum not only influences supplier investment strategies but also reinforces underwater robotics as a critical enabler of safe, efficient, and technology-driven offshore operations.
For Instance,
- In September 2023, offshore industry reports highlighted increased deployment of work-class ROVs and autonomous inspection systems in deepwater oil & gas and subsea construction projects to improve operational safety, inspection accuracy, and maintenance efficiency while reducing reliance on diver-based operations.
The growing adoption of advanced AUV and ROV systems across North America offshore industries underscores their increasing importance as multifunctional platforms aligned with evolving performance, safety, and sustainability requirements. As offshore operations continue to advance toward automation, precision, and digital integration, these systems’ functional capabilities position them as critical enablers of efficient subsea operations, infrastructure integrity, and long-term marine asset productivity.
Restraint/Challenge
“Lack of Harmonized North America Regulatory Frameworks for AUV & ROV Operations”
- The absence of harmonized North America regulations governing the deployment, operation, and certification of AUV and ROV systems presents a notable challenge for the North America AUV and ROV Market, as regulatory requirements vary significantly across maritime jurisdictions and offshore regions.
- Regulatory authorities apply differing standards related to operational safety, data security, environmental impact, underwater navigation permissions, and defense-related restrictions. This regulatory fragmentation compels AUV and ROV manufacturers, service providers, and offshore operators to adapt system configurations, documentation, operational protocols, and compliance strategies for each region, increasing operational complexity, compliance costs, and deployment timelines.
- As a result, companies face constraints in scaling AUV and ROV manufacturing, cross-border deployment, and service operations globally, particularly for multinational offshore projects, defense applications, and long-term subsea monitoring programs.
For instance,.
- In May 2025, national and regional maritime regulators in emerging offshore markets enforced additional operational and safety approvals beyond existing international guidelines, creating temporary deployment delays for AUV and ROV service providers who were required to modify mission planning, documentation, and equipment certifications during the enforcement period.
The lack of harmonized North America regulatory frameworks continues to pose a structural challenge for the AUV & ROV Market, limiting the ease of standardized system deployment, cross-border operations, and North America scalability, while increasing the need for region-specific regulatory compliance strategies.
AUV & ROV Market Scope
The North America AUV and ROV Market is segmented into seven segments based on product type, system component, depth, application, propulsion type, operating modality, and distribution channel
By Product Type
On the basis of product type, the market is segmented into Autonomous Underwater Vehicles (AUV), Remotely Operated Vehicles (ROV), hybrid vehicles, gliders, and others
In 2026, the Remotely Operated Vehicles (ROV) segment is expected to dominate the North America AUV and ROV Market, accounting for the highest share of 53.13%, reflecting its deep integration across a wide range of offshore, marine, and subsea industrial applications. This dominance is primarily driven by the extensive use of ROVs in oil & gas exploration, subsea inspection, underwater construction, defense operations, and environmental monitoring, where continuous operation, high payload capacity, and real-time human control are essential to ensure operational accuracy, safety, and reliability. Their ability to perform complex intervention tasks, carry advanced tooling, and operate effectively in deep and hazardous underwater environments makes them a preferred choice for operators managing large-scale, mission-critical subsea operations.
The Autonomous Underwater Vehicles (AUV) segment in the North America AUV and ROV Market is expected to grow 11.3 % CAGR the fastest during the forecast period from 2026 to 2033, driven by increasing demand for autonomous subsea exploration, seabed mapping, and long-duration inspection missions that require minimal human intervention. Growth is supported by advancements in artificial intelligence, navigation systems, battery technology, and sensor integration, enabling enhanced operational endurance, real-time data analytics, and cost-efficient offshore operations across oil & gas, defense, and marine research sectors
By System Component
On the basis of system component, the market is segmented into sensors & payloads, structure & frames, and launch and recovery systems
In 2026, the Sensors & Payloads segment is expected to dominate the North America AUV and ROV Market, accounting for the highest share of 73.31%, driven by its critical role in enabling advanced underwater sensing, navigation, imaging, and data acquisition across a wide range of subsea applications. Sensors and payload systems integrated into AUVs and ROVs offer enhanced situational awareness, high-resolution data capture, and mission-specific functionality, making them essential for operations requiring precision, reliability, and real-time or autonomous decision-making. These capabilities significantly support adoption in offshore oil & gas exploration, seabed mapping, defense surveillance, environmental monitoring, and scientific research, where accurate underwater data directly influences operational outcomes, safety, and efficiency.
The Sensors & Payloads segment is expected to grow 11.1 % CAGR at the fastest rate from 2026 to 2033 due to rising offshore deployment activities and increasing investments in deepwater and harsh-environment subsea operations. Growing demand for automated, safe, and efficient deployment solutions that reduce operational downtime and improve crew safety is accelerating adoption, particularly across offshore energy, naval defense, and large-scale marine infrastructure projects.
By Depth
On the basis of depth, the market is segmented into Up to 300 m, 301–1,000 m, 1,001–3,000 m, and Above 3,000 m
In 2026, the Up To 300M segment is expected to dominate the North America AUV and ROV Market, accounting for the highest share of 38.10%, driven by its superior operational efficiency and strong alignment with shallow-water and nearshore subsea requirements. This depth range enables effective deployment of AUVs and ROVs for coastal surveillance, port and harbor inspection, offshore wind infrastructure monitoring, environmental assessment, and shallow-water oil & gas activities. Compared to deeper-water operations, systems operating up to 300 meters benefit from lower deployment complexity, reduced operational risk, and faster mission turnaround, making them particularly well suited for routine, high-frequency underwater tasks requiring reliability and cost control.
The 1,001M-3,000M segment is projected to witness the fastest growth 11.8% CAGR during the forecast period from 2026 to 2033, driven by expanding deepwater oil & gas exploration, subsea mining prospects, and increasing defense surveillance activities in deeper maritime zones. Technological advancements in pressure-resistant materials, high-capacity propulsion systems, and advanced communication technologies are enabling reliable operations at greater depths, supporting increased adoption in technically demanding underwater environments.
By Application
On the basis of application, the North America AUV and ROV Market is segmented into oil & gas, defense & security, scientific research, environmental monitoring, search & salvage, commercial, and others
In 2026, the Oil & Gas segment is expected to dominate the market, accounting for the highest share of 54.45%, driven by its extensive reliance on AUV and ROV systems for critical subsea operations across offshore exploration, production, and maintenance activities. These underwater vehicles are widely deployed for pipeline inspection, subsea equipment installation, integrity assessment, and intervention tasks, where precision, safety, and continuous operation are essential. Their ability to operate in deep and hazardous underwater environments while reducing human exposure makes them particularly well aligned with the complex operational requirements of offshore oil & gas projects.
The Defense & Security segment is expected to grow at the fastest 11.8% CAGR from 2026 to 2033, supported by rising maritime security concerns, increasing naval modernization programs, and growing investments in underwater surveillance and mine countermeasure systems. The integration of autonomous underwater technologies for intelligence gathering, border protection, and strategic defense operations is significantly accelerating adoption across North American naval forces.
By Propulsion Type
On the basis of propulsion type, the market is segmented into electric, hydraulic, mechanical, and hybrid
In 2026, the Hydraulic segment is expected to dominate the market, accounting for the highest share of 28.20%, driven by its widespread application in heavy-duty and high-power subsea operations. Hydraulic propulsion systems are extensively used in work-class ROVs for offshore oil & gas, subsea construction, and deepwater intervention activities, where high torque, precise control, and reliable performance under extreme pressure conditions are essential. Their ability to support complex tooling, manipulation tasks, and continuous operation in harsh underwater environments makes them a preferred propulsion choice for demanding industrial applications
The Electric propulsion segment is projected to grow 11.2% CAGR the fastest during the forecast period from 2026 to 2033, driven by increasing demand for energy-efficient, low-noise, and environmentally sustainable underwater systems. Advancements in lithium-ion battery technology, improved energy density, and reduced maintenance requirements are encouraging adoption of electric propulsion in AUVs and light-duty ROVs, particularly for scientific research, environmental monitoring, and offshore renewable energy applications.
By operating modality
On the basis of operating modality, the market is segmented into Fully Autonomous, Semi-Autonomous, Remote-Controlled, Hybrid Control
In 2026, the Remote-Controlled segment is expected to dominate the market, accounting for the highest share of 52.71%, supported by its widespread adoption across offshore energy, defense, and marine research operations. Direct procurement channels enable end users to engage directly with original equipment manufacturers (OEMs) for customized AUV and ROV systems, ensuring precise alignment with mission requirements, system integration needs, and technical specifications. This approach supports improved system reliability, streamlined deployment, and enhanced after-sales support, making it the preferred procurement method for large-scale and mission-critical subsea operations.
The Hybrid Control segment is expected to witness the fastest growth 11.6% CAGR from 2026 to 2033 due to rising demand for long-duration, self-navigating underwater missions that reduce operational costs and human dependency. Rapid developments in machine learning, obstacle avoidance systems, and autonomous navigation technologies are enabling complex subsea tasks to be executed with minimal supervision, supporting growth across defense, scientific research, and offshore energy sectors.
By Distribution Channel
On the basis of Distribution Channel, the market is segmented into Direct (OEM), indirect (third-party distributed).
In 2026, the Direct (OEM) segment is projected to lead the market with a dominant share of 64.73%%, driven by its extensive deployment across offshore oil & gas, subsea infrastructure inspection, and marine research applications. AUV and ROV solutions in this segment are critical for improving operational efficiency, enhancing data accuracy, and supporting complex underwater missions, making them the preferred choice for large-scale industrial operations and high-demand subsea environments.
The Direct segment is projected to grow 11.1% CAGR at the fastest rate during the forecast period from 2026 to 2033, driven by expanding regional market penetration and increasing demand from small and mid-sized operators seeking cost-effective procurement channels. Third-party distributors provide localized technical support, flexible financing options, and quicker market access, supporting broader adoption of AUV and ROV systems across emerging subsea markets.
AUV & ROV Market Country Analysis
- In 2026, the U.S. is expected to hold the largest share of the North America AUV and ROV Market, accounting for 77.75 % of regional demand. With a projected CAGR of 11.1%, growth is driven by expanding offshore energy exploration, increased subsea infrastructure development, rising adoption of autonomous and remotely operated underwater vehicles, and growing demand for advanced inspection and monitoring solutions across defense, marine research, and commercial applications.
- The region benefits from upgraded maritime infrastructure, supportive government regulations, and increasing investments in offshore operations, subsea research, and environmental monitoring technologies. Expanding end-use applications across oil & gas, renewable energy, underwater construction, and scientific research continue to drive market penetration and long-term growth potential.
U.S. AUV & ROV Market Insight
The U.S. AUV & ROV market holds the largest share within North America, driven by the country’s strong offshore energy infrastructure, advanced maritime capabilities, and well-established subsea engineering ecosystem. The United Kingdom’s extensive offshore oil & gas operations in the North Sea, expanding offshore wind installations, and growing investments in marine research and defense modernization are significantly accelerating the deployment of autonomous and remotely operated underwater systems. Operators across the U.K. increasingly adopt AUV and ROV technologies for subsea inspection, pipeline monitoring, underwater construction, seabed mapping, and surveillance activities to enhance operational efficiency, ensure asset integrity, and minimize human exposure to high-risk offshore environments.
Canada AUV & ROV Market Insight
The Canada AUV & ROV market is projected to witness the fastest growth within North America, driven by increasing investments in offshore renewable energy projects, expanding naval defense modernization programs, and rising focus on deep-sea exploration and marine research initiatives. France’s strong maritime economy, supported by extensive coastlines and strategic naval presence, is accelerating the adoption of advanced autonomous and remotely operated underwater systems for subsea inspection, offshore wind farm monitoring, underwater surveillance, and environmental assessment applications. Growing emphasis on maritime security, sustainable ocean resource management, and technological innovation in underwater robotics is further contributing to market expansion. Additionally, the presence of established marine engineering firms, government-backed research institutions, and collaborative defense-industrial programs is fostering rapid technological advancements and system integration capabilities. France’s commitment to renewable energy expansion, digital transformation of maritime operations, and strategic defense investments positions it as the fastest-growing and increasingly innovation-driven market within the North America AUV & ROV landscape.
AUV & ROV Market Share
The AUV & ROV market is primarily led by well-established companies, including
Kongsberg Maritime (Norway)
- Oceaneering International (U.S.)
- Saab AB (Saab Seaeye) (Sweden)
- Teledyne Marine (U.S.)
- Forum Energy Technologies (U.S.)
- TechnipFMC (U.K.)
- ECA Group (France)
- DOF Subsea (Norway)
- Atlas Elektronik GmbH (Germany)
- Boston Engineering Corporation (U.S.)
- IKM Subsea (Norway)
- VideoRay (U.S.)
- Soil Machine Dynamics (SMD) (U.K.)
- Hydroid (HII) (U.S.)
- Aquabotix Technology Corporation (U.S.)
- Strategic Robotic Systems (U.S.)
- ROVOP (U.K.)
- Seamor Marine Ltd. (Canada)
- SeaRobotics Corporation (U.S.)
- Mariscope Meerestechnik (Germany)
- International Submarine Engineering Ltd. (Canada)
- Deep Ocean Engineering, Inc. (U.S.)
- Boxfish Robotics Ltd. (New Zealand)
- Planys Technologies (Spain)
- Cellula Robotics Ltd. (Canada)
- L3Harris Technologies, Inc. (U.S.)
- Subsea Tech (France)
- Eelume (Norway)
- Blueye Robotics AS (Norway)
Latest Developments in the North America AUV and ROV Market
- In October 2025, Kongsberg Maritime was recognized among the Top 10 Underwater Robotics Companies 2025 by Industry Outlook Magazine, highlighting its commitment to innovation, reliability, and advanced subsea solutions in the AUV and ROV sector. In July 2025, the company also conducted a technology outreach program in collaboration with maritime research institutes, engaging employees and the community to promote education and skill development in marine robotics.
- In February 2024, Oceaneering International participated in Offshore Technology Conference (OTC) 2024, strengthening its presence in subsea engineering and inspection services while engaging with customers and partners to showcase its expanding portfolio of autonomous and remotely operated underwater vehicles.
- In October 2024, Saab AB (Saab Seaeye) expanded its portfolio of high-capacity ROVs and modular AUV platforms, enhancing its presence in offshore oil & gas, defense, and subsea research sectors. The company also strengthened its North America service and support network to meet growing demand across North America, Asia-Pacific, and North America.
- In July 2024, Teledyne Marine organized an environmental awareness and coastal clean-up initiative in collaboration with local maritime authorities, reflecting the company’s commitment to corporate social responsibility and sustainable marine practices.
- In March 2025, Forum Energy Technologies implemented energy-efficient propulsion systems and eco-friendly manufacturing practices in its AUV and ROV production and assembly processes, reinforcing the company’s dedication to sustainable, high-performance underwater robotics solutions.
SKU-

- Interactive Data Analysis Dashboard
- Company Analysis Dashboard for high growth potential opportunities
- Research Analyst Access for customization & queries
- Competitor Analysis with Interactive dashboard
- Latest News, Updates & Trend analysis
- Harness the Power of Benchmark Analysis for Comprehensive Competitor Tracking
Table of Content
1 INTRODUCTION
1.1 OBJECTIVES OF THE STUDY
1.2 MARKET DEFINITION
1.3 OVERVIEW OF NORTH AMERICA AUV & ROV MARKET
1.4 LIMITATIONS
1.5 MARKETS COVERED
2 MARKET SEGMENTATION
2.1 MARKETS COVERED
2.2 GEOGRAPHICAL SCOPE
2.3 YEARS CONSIDERED FOR THE STUDY
2.4 CURRENCY AND PRICING
2.5 DBMR TRIPOD DATA VALIDATION MODEL
2.6 MULTIVARIATE MODELING
2.7 PRIMARY INTERVIEWS WITH KEY OPINION LEADERS
2.8 DBMR MARKET POSITION GRID
2.9 MARKET APPLICATION COVERAGE GRID
2.1 VENDOR SHARE ANALYSIS
2.11 SECONDARY SOURCES
2.12 ASSUMPTIONS
3 EXECUTIVE SUMMARY
4 PREMIUM INSIGHTS
4.1 PORTERS FIVE FORCES ANALYSIS
4.2 RAW MATERIAL COVERAGE
4.2.1 STRUCTURAL & HULL MATERIALS
4.2.2 POWER SYSTEMS
4.2.3 ELECTRONICS & SENSORS
4.2.4 PROPULSION MATERIALS
4.2.5 BUOYANCY MATERIALS
4.2.6 TETHER & CONNECTIVITY MATERIALS
4.2.7 QUALITY, REGULATORY & SUPPLY CONSIDERATIONS
4.2.8 CONCLUSION
4.3 BRAND OUTLOOK
4.3.1 BRAND COMPARATIVE ANALYSIS
4.3.2 COMPANY VS BRAND OVERVIEW
4.4 CONSUMER BUYING BEHAVIOUR
4.4.1 GROUP 1 MISSION-CRITICAL & STRATEGIC USERS
4.4.2 GROUP 2 PROFESSIONAL & COMMERCIAL OPERATORS
4.4.3 GROUP 3 COST-CONSCIOUS INDUSTRIAL USERS
4.4.4 GROUP 4 VOLUME-DRIVEN COMMERCIAL BUYERS
4.4.5 GROUP 5 RESEARCH & INNOVATION-FOCUSED INSTITUTIONS
4.4.6 GROUP 6 ENTRY-LEVEL & BUDGET-FOCUSED USERS
4.5 VENDOR SELECTION CRITERIA
4.5.1 PERFORMANCE AND DEPTH RATING
4.5.2 MANEUVERABILITY AND PAYLOAD CAPACITY
4.5.3 SENSOR AND IMAGING QUALITY
4.5.4 RELIABILITY, DURABILITY, AND MAINTENANCE
4.5.5 MANUFACTURER TRACK RECORD AND SUPPORT
4.6 TECHNOLIGICAL ADVANCEMENT
4.7 VALUE CHAIN ANALYSIS – NORTH AMERICA AUV & ROV MARKET
4.7.1 OVERVIEW
4.7.2 RAW MATERIALS & COMPONENTS (20–30%)
4.7.3 VEHICLE DESIGN, R&D & MANUFACTURING (30–40%)
4.7.4 ASSEMBLY, TESTING & VALIDATION (15–25%)
4.7.5 PACKAGING, DEPLOYMENT & DOCUMENTATION (05–10%)
4.7.6 LOGISTICS, DISTRIBUTION & COMMERCIALIZATION (10–15%)
4.8 SUPPLY CHAIN ANALYSIS
4.8.1 OVERVIEW
4.8.2 LOGISTIC COST SCENARIO
4.8.2.1 ROUTE DISRUPTION AND DISTANCE INFLATION
4.8.2.2 CANAL AND WATERWAY CONSTRAINTS
4.8.2.3 REGULATORY AND FUEL-TRANSITION PASS-THROUGHS
4.8.2.4 AIR FREIGHT AS A COST ESCALATOR FOR CRITICAL-PATH ITEMS
4.8.3 IMPORTANCE OF LOGISTIC SERVICE PROVIDERS
4.8.3.1 PROJECT LOGISTICS ORCHESTRATION FOR OFFSHORE MOBILIZATIONS.
4.8.3.2 CUSTOMS, LICENSING, AND CROSS-BORDER COMPLIANCE
4.8.3.3 HANDLING OF SPECIALIZED CARGO AND HAZARDOUS GOODS
4.8.3.4 RESILIENCE PLANNING DURING NORTH AMERICA DISRUPTIONS
4.8.3.5 FIELD-SERVICE LOGISTICS AND LIFECYCLE SUPPORT
4.9 PRODUCTION CONSUMPTION ANALYSIS
4.9.1 NORTH AMERICA PRODUCTION LANDSCAPE
4.9.2 CONSUMPTION TRENDS AND REGIONAL DEMAND PATTERNS
4.9.3 SUPPLY–DEMAND BALANCE AND REGIONAL IMBALANCES
4.9.4 OVERALL MARKET OUTLOOK
4.1 PROFIT MARGINS SCENARIO
4.10.1 PRODUCT-BASED MARGIN DIFFERENTIATION
4.10.2 APPLICATION-SPECIFIC MARGIN DYNAMICS
4.10.3 ROLE OF SERVICES AND AFTERMARKET OFFERING
4.10.4 COST STRUCTURE AND MARGIN PRESSURES
4.10.5 OUTLOOK AND COMPETITIVE IMPLICATIONS
4.11 PRICING ANALAYSIS
4.12 CLIMATE CHANGE SCENARIO
4.12.1 ENVIRONMENTAL CONCERNS
4.12.2 INDUSTRY RESPONSE
4.12.3 GOVERNMENT’S ROLE
4.12.4 ANALYST RECOMMENDATIONS
4.13 INDUSTRY ECOSYSTEM ANALYSIS
4.13.1 PROMINENT COMPANIES
4.13.2 SMALL & MEDIUM SIZE COMPANIES
4.13.3 END USERS
4.14 INNOVATION TRACKER AND STRATEGIC ANALYSIS
4.14.1 MAJOR DEALS AND STRATEGIC ALLIANCES ANALYSIS
4.14.2 ACTIVE DEVELOPMENT
4.14.3 STAGE OF DEVELOPMENT
4.14.4 TIMELINES AND MILESTONES
4.14.5 INNOVATION STRATEGIES AND METHODOLOGIES
4.14.6 RISK ASSESSMENT AND MITIGATION
4.14.6.1 OPERATIONAL FAILURE
4.14.6.2 ENVIRONMENTAL HAZARDS
4.14.6.3 COMMUNICATION & NAVIGATION LOSS
4.14.6.4 CYBERSECURITY THREATS
4.14.6.5 DATA LOSS OR INACCURACY
4.14.6.6 ENERGY & ENDURANCE FAILURE
4.14.6.7 HUMAN ERROR
4.14.6.8 REGULATORY / LEGAL RISKS
4.14.6.9 EMERGING TECHNOLOGY RISKS
4.14.7 FUTURE OUTLOOK
5 TARIFFS & IMPACT ON THE MARKET
5.1 CURRENT TARIFF RATE (S) IN TOP-5 COUNTRY MARKETS
5.1.1 UNITED STATES
5.1.2 EUROPEAN UNION
5.1.3 CHINA
5.1.4 JAPAN
5.1.5 INDIA
5.2 OUTLOOK: LOCAL PRODUCTION VS IMPORT RELIANCE
5.3 VENDOR SELECTION CRITERIA DYNAMICS
5.3.1 TECHNICAL CAPABILITIES
5.3.2 COMPLIANCE & CERTIFICATIONS
5.3.3 FINANCIAL & COMMERCIAL FACTORS
5.3.4 OPERATIONAL SUPPORT & TRAINING
5.3.5 STRATEGIC FIT & COLLABORATION
5.3.6 RISK & RELIABILITY ASSESSMENT
5.4 IMPACT ON SUPPLY CHAIN
5.4.1 RAW MATERIAL PROCUREMENT:
5.4.2 MANUFACTURING AND PRODUCTION:
5.4.3 LOGISTICS AND DISTRIBUTION:
5.4.4 PRICE PITCHING AND POSITION IN MARKET:
5.5 INDUSTRY PARTICIPANTS: PROACTIVE MOVES
5.5.1 SUPPLY CHAIN OPTIMIZATION
5.5.2 JOINT VENTURE ESTABLISHMENTS
5.6 IMPACT ON PRICES
5.7 REGULATORY INCLINATION
5.7.1 GEOPOLITICAL SITUATION
5.7.1.1 STRATEGIC IMPORTANCE OF UNDERSEA DOMAINS
5.7.1.2 DEFENSE MODERNIZATION AND INDO‑PACIFIC DYNAMICS
5.7.1.3 SUPPLY CHAINS, SOVEREIGNTY, AND EXPORT CONTROL PRESSURES
5.7.1.4 MARITIME SECURITY THREATS AND INFRASTRUCTURE PROTECTION
5.7.1.5 REGULATORY ENVIRONMENTS AND INTERNATIONAL LAW
5.7.1.6 DUAL‑USE TENSIONS AND INDUSTRY IMPLICATIONS
5.7.2 TRADE PARTNERSHIPS BETWEEN COUNTRIES
5.7.2.1 FREE TRADE AGREEMENTS
5.7.2.2 ALLIANCES ESTABLISHMENTS
5.7.3 STATUS ACCREDITATION (INCLUDING MFTN)
5.7.3.1 MOST-FAVORED-NATION (MFN) STATUS
5.7.3.2 ROLE IN AUV/ROV TRADE AND MARKET ENTRY
5.7.3.3 PREFERENTIAL TRADE AGREEMENTS (PTAS) LAYERING
5.7.3.4 CERTIFICATION AND COMPLIANCE ACCREDITATION
5.7.3.5 STRATEGIC IMPLICATIONS FOR MANUFACTURERS
5.7.3.6 MARKET IMPACT AND FUTURE OUTLOOK
5.7.4 DOMESTIC COURSE OF CORRECTION
5.7.4.1 INCENTIVE SCHEMES TO BOOST PRODUCTION OUTPUTS
5.7.4.2 ESTABLISHMENT OF SEZS/INDUSTRIAL PARKS
6 REGULATION COVERAGE
6.1 PRODUCT CODES
6.2 CERTIFIED STANDARDS
6.3 SAFETY STANDARDS
6.3.1 MATERIAL HANDLING & STORAGE
6.3.2 TRANSPORT & PRECAUTIONS
6.3.3 HAZARD IDENTIFICATION
7 MARKET OVERVIEW
7.1 DRIVER
7.1.1 GROWING OFFSHORE OIL & GAS EXPLORATION AND DEEPWATER FIELD DEVELOPMENT INCREASE DEMAND FOR AUVS AND ROVS FOR INSPECTION, REPAIR, AND MAINTENANCE ACTIVITIES
7.1.2 RISING ADOPTION OF AUTONOMOUS AND REMOTELY OPERATED SYSTEMS TO REDUCE HUMAN RISK AND OPERATIONAL DOWNTIME IN HARSH UNDERWATER ENVIRONMENTS
7.1.3 ADVANCEMENTS IN AI, SENSOR INTEGRATION, NAVIGATION, AND IMAGING TECHNOLOGIES ENHANCE MISSION ACCURACY AND OPERATIONAL EFFICIENCY.
7.1.4 INCREASING DEFENSE AND NAVAL INVESTMENTS DRIVE DEPLOYMENT OF AUVS AND ROVS FOR SURVEILLANCE, MINE COUNTERMEASURES, AND UNDERSEA SECURITY
7.2 RESTRAINT
7.2.1 HIGH CAPITAL INVESTMENT AND MAINTENANCE COSTS LIMIT ADOPTION AMONG SMALL AND MID-SIZED OPERATORS
7.2.2 LIMITED UNDERWATER COMMUNICATION BANDWIDTH AND NAVIGATION CONSTRAINTS RESTRICT FULL AUTONOMY IN DEEP-SEA OPERATIONS.
7.3 OPPORTUNITIES
7.3.1 DEVELOPMENT OF COMPACT, MODULAR, AND HYBRID AUV–ROV PLATFORMS ENHANCES DEPLOYMENT FLEXIBILITY AND MISSION ADAPTABILITY
7.3.2 EMERGING OFFSHORE ACTIVITIES IN ASIA-PACIFIC, LATIN AMERICA, AND AFRICA OFFER UNTAPPED MARKET POTENTIAL
7.3.3 INCREASED GOVERNMENT FUNDING FOR OCEAN EXPLORATION AND MARITIME SECURITY PROGRAMS ACCELERATES TECHNOLOGY ADOPTION
7.4 CHALLENGES
7.4.1 REGULATORY APPROVALS AND ENVIRONMENTAL COMPLIANCE REQUIREMENTS CAN DELAY PROJECT EXECUTION
7.4.2 HARSH OCEAN CONDITIONS AFFECTING RELIABILITY AND ENDURANCE
8 NORTH AMERICA AUV & ROV MARKET, BY PRODUCT TYPE
8.1 OVERVIEW
8.2 REMOTELY OPERATED VEHICLES (ROV)
8.2.1 WORK CLASS ROVS
8.2.1.1 HEAVY DUTY WORK CLASS ROVS
8.2.1.2 LIGHT WORK CLASS ROVS
8.2.2 OBSERVATION CLASS ROVS
8.2.2.1 INSPECTION
8.2.2.2 UTILITY
8.2.2.3 SAMPLE COLLECTION
8.2.2.4 REPAIR
8.2.3 TOY / MICRO ROVS
8.2.4 NORTH AMERICA
8.2.5 EUROPE
8.2.6 ASIA-PACIFIC
8.2.7 MIDDLE EAST AND AFRICA
8.2.8 SOUTH AMERICA
8.3 AUTONOMOUS UNDERWATER VEHICLES (AUV)
8.3.1 MEDIUM WATER AUVS (100M – 1,000M)
8.3.1.1 Application
8.3.1.1.1 PIPELINE INSPECTION
8.3.1.1.2 ENVIRONMENTAL MONITORING
8.3.1.1.3 OTHERS
8.3.1.2 Sensors used
8.3.1.2.1 SONAR
8.3.1.2.2 IMAGING SYSTEMS
8.3.1.3 Deployment Method
8.3.1.3.1 SHIP-LAUNCH
8.3.1.3.2 SHORE-LAUNCH
8.3.2 DEEP WATER AUVS (> 1,000M)
8.3.3 SHALLOW WATER AUVS (< 100M)
8.3.4 NORTH AMERICA
8.3.5 EUROPE
8.3.6 ASIA-PACIFIC
8.3.7 MIDDLE EAST AND AFRICA
8.3.8 SOUTH AMERICA
8.3.9 NORTH AMERICA
8.3.10 EUROPE
8.3.11 ASIA-PACIFIC
8.3.12 MIDDLE EAST AND AFRICA
8.3.13 SOUTH AMERICA
8.4 HYBRID VEHICLES
8.4.1 NORTH AMERICA
8.4.2 EUROPE
8.4.3 ASIA-PACIFIC
8.4.4 MIDDLE EAST AND AFRICA
8.4.5 SOUTH AMERICA
8.5 GLIDERS
8.5.1 NORTH AMERICA
8.5.2 EUROPE
8.5.3 ASIA-PACIFIC
8.5.4 MIDDLE EAST AND AFRICA
8.5.5 SOUTH AMERICA
8.6 OTHERS
8.6.1 NORTH AMERICA
8.6.2 EUROPE
8.6.3 ASIA-PACIFIC
8.6.4 MIDDLE EAST AND AFRICA
8.6.5 SOUTH AMERICA
9 NORTH AMERICA AUV & ROV MARKET, BY SYSTEM COMPONENT
9.1 OVERVIEW
9.2 SENSORS & PAYLOADS
9.2.1 SONAR SYSTEMS
9.2.1.1 MULTIBEAM SONAR
9.2.1.2 SIDE-SCAN SONAR
9.2.2 NAVIGATION SYSTEMS
9.2.2.1 INERTIAL NAVIGATION
9.2.2.2 ACOUSTIC POSITIONING
9.2.2.3 GPS INTEGRATION
9.2.3 CAMERAS
9.2.3.1 OPTICAL
9.2.3.2 INFRARED
9.2.3.3 MULTISPECTRAL
9.2.4 CONTROL & COMMUNICATION SYSTEMS
9.2.5 MANIPULATORS & ARMS
9.2.6 BATTERY & ENERGY SYSTEMS
9.2.7 PROPULSION SYSTEMS
9.2.8 NORTH AMERICA
9.2.9 EUROPE
9.2.10 ASIA-PACIFIC
9.2.11 MIDDLE EAST AND AFRICA
9.2.12 SOUTH AMERICA
9.3 STRUCTURE & FRAMES
9.3.1 NORTH AMERICA
9.3.2 EUROPE
9.3.3 ASIA-PACIFIC
9.3.4 MIDDLE EAST AND AFRICA
9.3.5 SOUTH AMERICA
9.4 LAUNCH AND RECOVERY SYSTEMS
9.4.1 NORTH AMERICA
9.4.2 EUROPE
9.4.3 ASIA-PACIFIC
9.4.4 MIDDLE EAST AND AFRICA
9.4.5 SOUTH AMERICA
10 NORTH AMERICA AUV & ROV MARKET, BY DEPTH
10.1 OVERVIEW
10.2 UP TO 300M
10.2.1 APPLICATION
10.2.1.1 PIPELINE INSPECTION
10.2.1.2 FISHERY INSPECTION
10.2.2 NORTH AMERICA
10.2.3 EUROPE
10.2.4 ASIA-PACIFIC
10.2.5 MIDDLE EAST AND AFRICA
10.2.6 SOUTH AMERICA
10.3 301M-1,000M
10.3.1 USAGE TYPE
10.3.1.1 OFFSHORE OIL FIELD
10.3.1.2 DEFENSE
10.3.2 NORTH AMERICA
10.3.3 EUROPE
10.3.4 ASIA-PACIFIC
10.3.5 MIDDLE EAST AND AFRICA
10.3.6 SOUTH AMERICA
10.4 1,001M-3,000M
10.4.1 NORTH AMERICA
10.4.2 EUROPE
10.4.3 ASIA-PACIFIC
10.4.4 MIDDLE EAST AND AFRICA
10.4.5 SOUTH AMERICA
10.5 >3,000M
10.5.1 NORTH AMERICA
10.5.2 EUROPE
10.5.3 ASIA-PACIFIC
10.5.4 MIDDLE EAST AND AFRICA
10.5.5 SOUTH AMERICA
11 NORTH AMERICA AUV & ROV MARKET, BY APPLICATION
11.1 OVERVIEW
11.2 OIL & GAS
11.2.1 PIPELINE & STRUCTURE INSPECTION
11.2.1.1 ROUTINE INSPECTION
11.2.1.2 SENSORS
11.2.1.3 VISUAL
11.2.1.4 FIXED SCHEDULE
11.2.1.5 ON-DEMAND
11.2.1.6 ULTRASONIC
11.2.1.7 REPORTING FREQUENCY
11.2.1.8 DAMAGE ASSESSMENT
11.3 UNDERWATER INSTALLATION
11.3.1 NORTH AMERICA
11.3.2 EUROPE
11.3.3 ASIA-PACIFIC
11.3.4 MIDDLE EAST AND AFRICA
11.3.5 SOUTH AMERICA
11.4 DEFENSE & SECURITY
11.4.1 NAVY SURVEILLANCE
11.4.2 MINE COUNTERMEASURES
11.4.3 HARBOR/MARITIME SECURITY
11.4.4 NORTH AMERICA
11.4.5 EUROPE
11.4.6 ASIA-PACIFIC
11.4.7 MIDDLE EAST AND AFRICA
11.4.8 SOUTH AMERICA
11.5 SCIENTIFIC RESEARCH
11.5.1 OCEANOGRAPHIC SURVEYS
11.5.2 BIOLOGICAL SAMPLING
11.5.3 NORTH AMERICA
11.5.4 EUROPE
11.5.5 ASIA-PACIFIC
11.5.6 MIDDLE EAST AND AFRICA
11.5.7 SOUTH AMERICA
11.6 ENVIRONMENTAL MONITORING
11.6.1 WATER QUALITY
11.6.2 SUBSEA HABITAT MONITORING
11.6.3 NORTH AMERICA
11.6.4 EUROPE
11.6.5 ASIA-PACIFIC
11.6.6 MIDDLE EAST AND AFRICA
11.6.7 SOUTH AMERICA
11.7 COMMERCIAL
11.7.1 NORTH AMERICA
11.7.2 EUROPE
11.7.3 ASIA-PACIFIC
11.7.4 MIDDLE EAST AND AFRICA
11.7.5 SOUTH AMERICA
11.8 SEARCH & SALVAGE
11.8.1 NORTH AMERICA
11.8.2 EUROPE
11.8.3 ASIA-PACIFIC
11.8.4 MIDDLE EAST AND AFRICA
11.8.5 SOUTH AMERICA
11.9 OTHERS
11.9.1 NORTH AMERICA
11.9.2 EUROPE
11.9.3 ASIA-PACIFIC
11.9.4 MIDDLE EAST AND AFRICA
11.9.5 SOUTH AMERICA
12 NORTH AMERICA AUV & ROV MARKET, BY PROPULSION TYPE
12.1 OVERVIEW
12.2 HYDRAULIC
12.2.1 NORTH AMERICA
12.2.2 EUROPE
12.2.3 ASIA-PACIFIC
12.2.4 MIDDLE EAST AND AFRICA
12.2.5 SOUTH AMERICA
12.3 ELECTRIC
12.3.1 NORTH AMERICA
12.3.2 EUROPE
12.3.3 ASIA-PACIFIC
12.3.4 MIDDLE EAST AND AFRICA
12.3.5 SOUTH AMERICA
12.4 HYBRID
12.4.1 NORTH AMERICA
12.4.2 EUROPE
12.4.3 ASIA-PACIFIC
12.4.4 MIDDLE EAST AND AFRICA
12.4.5 SOUTH AMERICA
12.5 MECHANICAL
12.5.1 NORTH AMERICA
12.5.2 EUROPE
12.5.3 ASIA-PACIFIC
12.5.4 MIDDLE EAST AND AFRICA
12.5.5 SOUTH AMERICA
13 NORTH AMERICA AUV & ROV MARKET, BY OPERATING MODALITY
13.1 OVERVIEW
13.2 REMOTE-CONTROLLED
13.2.1 BY PROPULSION TYPE
13.2.1.1 HYDRAULIC
13.2.1.2 ELECTRIC
13.2.1.3 HYBRID
13.2.1.4 MECHANICAL
13.2.2 NORTH AMERICA
13.2.3 EUROPE
13.2.4 ASIA-PACIFIC
13.2.5 MIDDLE EAST AND AFRICA
13.2.6 SOUTH AMERICA
13.3 FULLY AUTONOMOUS
13.3.1 BY PROPULSION TYPE
13.3.1.1 ELECTRIC
13.3.1.2 HYBRID
13.3.1.3 HYDRAULIC
13.3.1.4 MECHANICAL
13.3.2 NORTH AMERICA
13.3.3 EUROPE
13.3.4 ASIA-PACIFIC
13.3.5 MIDDLE EAST AND AFRICA
13.3.6 SOUTH AMERICA
13.4 SEMI-AUTONOMOUS
13.4.1 BY PROPULSION TYPE
13.4.1.1 ELECTRIC
13.4.1.2 HYDRAULIC
13.4.1.3 HYBRID
13.4.1.4 MECHANICAL
13.4.2 NORTH AMERICA
13.4.3 EUROPE
13.4.4 ASIA-PACIFIC
13.4.5 MIDDLE EAST AND AFRICA
13.4.6 SOUTH AMERICA
13.5 HYBRID CONTROL
13.5.1 BY PROPULSION TYPE
13.5.1.1 ELECTRIC
13.5.1.2 HYBRID
13.5.1.3 HYDRAULIC
13.5.1.4 MECHANICAL
13.5.2 NORTH AMERICA
13.5.3 EUROPE
13.5.4 ASIA-PACIFIC
13.5.5 MIDDLE EAST AND AFRICA
13.5.6 SOUTH AMERICA
14 NORTH AMERICA AUV & ROV MARKET, BY DISTRIBUTION CHANNEL
14.1 OVERVIEW
14.2 DIRECT
14.2.1 NORTH AMERICA
14.2.2 EUROPE
14.2.3 ASIA-PACIFIC
14.2.4 MIDDLE EAST AND AFRICA
14.2.5 SOUTH AMERICA
14.3 INDIRECT
14.3.1 NORTH AMERICA
14.3.2 EUROPE
14.3.3 ASIA-PACIFIC
14.3.4 MIDDLE EAST AND AFRICA
14.3.5 SOUTH AMERICA
15 NORTH AMERICA AUV & ROV MARKET, BY REGION
15.1 NORTH AMERICA
15.1.1 U.S.
15.1.2 CANADA
15.1.3 MEXICO
16 NORTH AMERICA AUV & ROV MARKET: COMPANY LANDSCAPE
16.1 COMPANY SHARE ANALYSIS: GLOBAL
17 SWOT ANALYSIS
18 COMAPANY PROFILES MANUFACTURES
18.1 KONGSBERG DISCOVERY
18.1.1 COMPANY SNAPSHOT
18.1.2 COMPANY SHARE ANALYSIS
18.1.3 PRODUCT PORTFOLIO
18.1.4 RECENT DEVEOPMENT
18.2 OCEANEERING INTERNATIONAL, INC.
18.2.1 COMPANY SNAPSHOT
18.2.2 REVENUE ANALYSIS
18.2.3 COMPANY SHARE ANALYSIS
18.2.4 SERVICE PORTFOLIO
18.2.5 RECENT DEVELOPMENT
18.3 TECHNIPFMC PLC
18.3.1 COMPANY SNAPSHOT
18.3.2 REVENUE ANALYSIS
18.3.3 COMPANY SHARE ANALYSIS
18.3.4 PRODUCT PORTFOLIO
18.3.5 RECENT DEVELOPMENT
18.4 TELEDYNE MARINE TECHNOLOGIES INCORPORATED.
18.4.1 COMPANY SNAPSHOT
18.4.2 COMPANY SHARE ANALYSIS
18.4.3 PRODUCT PORTFOLIO
18.4.4 RECENT DEVEOPMENT
18.5 SAAB AB
18.5.1 COMPANY SNAPSHOT
18.5.2 REVENUE ANALYSIS
18.5.3 COMPANY SHARE ANALYSIS
18.5.4 PRODUCT PORTFOLIO
18.5.5 RECENT DEVEOPMENT
18.6 AQUABOTIX CORPORATION.
18.6.1 COMPANY SNAPSHOT
18.6.2 PRODUCT PORTFOLIO
18.6.3 RECENT DEVELOPMENT
18.7 TKMS
18.7.1 COMPANY SNAPSHOT
18.7.2 REVENUE ANALYSIS
18.7.3 PRODUCT PORTFOLIO
18.7.4 RECENT DEVEOPMENT
18.8 BLUEYE
18.8.1 COMPANY SNAPSHOT
18.8.2 PRODUCT PORTFOLIO
18.8.3 RECENT DEVELOPMENT
18.9 BOSTON ENGINEERING
18.9.1 COMPANY SNAPSHOT
18.9.2 PRODUCT PORTFOLIO
18.9.3 RECENT DEVEOPMENT
18.1 BOXFISH ROBOTICS LIMITED.
18.10.1 COMPANY SNAPSHOT
18.10.2 PRODUCT PORTFOLIO
18.10.3 RECENT DEVELOPMENT
18.11 CELLULA ROBOTICS LTD
18.11.1 COMPANY SNAPSHOT
18.11.2 PRODUCT PORTFOLIO
18.11.3 RECENT DEVEOPMENT
18.12 DEEP OCEAN ENGINEERING, INC.
18.12.1 COMPANY SNAPSHOT
18.12.2 PRODUCT PORTFOLIO
18.12.3 RECENT DEVELOPMENT
18.13 DOF
18.13.1 COMPANY SNAPSHOT
18.13.2 REVENUE ANALYSIS
18.13.3 PRODUCT PORTFOLIO
18.13.4 RECENT DEVEOPMENT
18.14 ECA GROUP (EXAIL)
18.14.1 COMPANY SNAPSHOT
18.14.2 REVENUE ANALYSIS
18.14.3 PRODUCT PORTFOLIO
18.14.4 RECENT DEVELOPMENT
18.15 EELUME
18.15.1 COMPANY SNAPSHOT
18.15.2 PRODUCT PORTFOLIO
18.15.3 RECENT DEVELOPMENT
18.16 FORSSEA ROBOTICS
18.16.1 COMPANY SNAPSHOT
18.16.2 PRODUCT PORTFOLIO
18.16.3 RECENT DEVELOPMENT
18.17 FORUM ENERGY TECHNOLOGIES, INC.
18.17.1 COMPANY SNAPSHOT
18.17.2 REVENUE ANALYSIS
18.17.3 PRODUCT PORTFOLIO
18.17.4 RECENT DEVELOPMENT
18.18 GENERAL DYNAMICS MISSION SYSTEMS, INC.
18.18.1 COMPANY SNAPSHOT
18.18.2 PRODUCT PORTFOLIO
18.18.3 RECENT DEVEOPMENT
18.19 HII.
18.19.1 COMPANY SNAPSHOT
18.19.2 REVENUE ANALYSIS
18.19.3 PRODUCT PORTFOLIO
18.19.4 RECENT DEVELOPMENT
18.2 IKM SUBSEA (SUBSIDIARY OF IKM GRUPPEN AS)
18.20.1 COMPANY SNAPSHOT
18.20.2 PRODUCT PORTFOLIO
18.20.3 RECENT DEVELOPMENT
18.21 INTERNATIONAL SUBMARINE ENGINEERING LIMITED
18.21.1 COMPANY SNAPSHOT
18.21.2 PRODUCT PORTFOLIO
18.21.3 RECENT DEVEOPMENT
18.22 L3HARRIS TECHNOLOGIES, INC.
18.22.1 COMPANY SNAPSHOT
18.22.2 REVENUE ANALYSIS
18.22.3 PRODUCT PORTFOLIO
18.22.4 RECENT DEVEOPMENT
18.23 MARISCOPE
18.23.1 COMPANY SNAPSHOT
18.23.2 PRODUCT PORTFOLIO
18.23.3 RECENT DEVEOPMENT
18.24 PLANYS TECHNOLOGIES.
18.24.1 COMPANY SNAPSHOT
18.24.2 PRODUCT PORTFOLIO
18.24.3 RECENT DEVELOPMENT
18.25 ROVOP
18.25.1 COMPANY SNAPSHOT
18.25.2 PRODUCT PORTFOLIO
18.25.3 RECENT DEVEOPMENT
18.26 SEAMOR MARINE LTD
18.26.1 COMPANY SNAPSHOT
18.26.2 PRODUCT PORTFOLIO
18.26.3 RECENT DEVEOPMENT
18.27 SEEBYTE.
18.27.1 COMPANY SNAPSHOT
18.27.2 PRODUCT PORTFOLIO
18.27.3 RECENT DEVELOPMENT
18.28 SEAROBOTICS CORP., AN ADVANCED OCEAN SYSTEMS COMPANY
18.28.1 COMPANY SNAPSHOT
18.28.2 PRODUCT PORTFOLIO
18.28.3 RECENT DEVEOPMENT
18.29 SOIL MACHINE DYNAMICS LTD.
18.29.1 COMPANY SNAPSHOT
18.29.2 PRODUCT PORTFOLIO
18.29.3 RECENT DEVELOPMENT
18.3 STRATEGIC ROBOTIC SYSTEM.
18.30.1 COMPANY SNAPSHOT
18.30.2 PRODUCT PORTFOLIO
18.30.3 RECENT DEVELOPMENT
18.31 SUBSEA TECH
18.31.1 COMPANY SNAPSHOT
18.31.2 PRODUCT PORTFOLIO
18.31.3 RECENT DEVEOPMENT
18.32 VIDEORAY LLC
18.32.1 COMPANY SNAPSHOT
18.32.2 PRODUCT PORTFOLIO
18.32.3 RECENT DEVELOPMENT
19 COMPANY PROFILES DISTRIBUTORS
19.1 ASHTEAD TECHNOLOGY
19.1.1 COMPANY SNAPSHOT
19.1.2 REVENUE ANALYSIS
19.1.3 PRODUCT PORTFOLIO
19.1.4 RECENT DEVELOPMENT
19.2 DEEP OCEAN ENGINEERING, INC.
19.2.1 COMPANY SNAPSHOT
19.2.2 PRODUCT PORTFOLIO
19.2.3 RECENT DEVELOPMENT
19.3 DEEP TREKKER INC.
19.3.1 COMPANY SNAPSHOT
19.3.2 PRODUCT PORTFOLIO
19.3.3 RECENT DEVELOPMENT
19.4 MACARTNEY UNDERWATER TECHNOLOGY
19.4.1 COMPANY SNAPSHOT
19.4.2 PRODUCT PORTFOLIO
19.4.3 RECENT DEVELOPMENT
19.5 UNIQUE GROUP
19.5.1 COMPANY SNAPSHOT
19.5.2 PRODUCT PORTFOLIO
19.5.3 RECENT DEVELOPMENT
20 QUESTIONNAIRE
21 RELATED REPORT
List of Table
TABLE 1 PROFIT MARGIN COMPARISON BY SEGMENT
TABLE 2 TIMELINE AND MILESTONES SUMMARY
TABLE 3 KEY INNOVATION STRATEGIES, METHODOLOGIES, AND STRATEGIC IMPACTS IN THE NORTH AMERICA AUV & ROV MARKET
TABLE 4 PRICE IMPACT ANALYSIS
TABLE 5 NORTH AMERICA AUV & ROV MARKET, BY PRODUCT TYPE, 2018-2033 (USD THOUSAND)
TABLE 6 NORTH AMERICA AUV & ROV MARKET, BY PRODUCT TYPE, 2018-2033 (UNITS)
TABLE 7 NORTH AMERICA REMOTELY OPERATED VEHICLES (ROV) IN AUV & ROV MARKET, BY TYPE, 2018-2033 (USD THOUSAND)
TABLE 8 NORTH AMERICA WORK CLASS ROVS IN AUV & ROV MARKET, BY TYPE, 2018-2033 (USD THOUSAND)
TABLE 9 NORTH AMERICA OBSERVATION CLASS ROVS IN AUV & ROV MARKET, BY TYPE, 2018-2033 (USD THOUSAND)
TABLE 10 NORTH AMERICA REMOTELY OPERATED VEHICLES (ROV) IN AUR & ROV MARKET, BY REGION, 2018-2033 (USD THOUSAND)
TABLE 11 NORTH AMERICA REMOTELY OPERATED VEHICLES (ROV) IN AUR & ROV MARKET, BY REGION, 2018-2033 (UNITS)
TABLE 12 NORTH AMERICA AUTONOMOUS UNDERWATER VEHICLES (AUV) IN AUV & ROV MARKET, BY TYPE, 2018-2033 (USD THOUSAND)
TABLE 13 NORTH AMERICA MEDIUM WATER AUVS (100M – 1,000M) IN AUV & ROV MARKET, BY APPLICATION, 2018-2033 (USD THOUSAND)
TABLE 14 NORTH AMERICA MEDIUM WATER AUVS (100M – 1,000M) IN AUV & ROV MARKET, BY SENSORS USED, 2018-2033 (USD THOUSAND)
TABLE 15 NORTH AMERICA MEDIUM WATER AUVS (100M – 1,000M) IN AUV & ROV MARKET, BY DEPLOYMENT METHOD, 2018-2033 (USD THOUSAND)
TABLE 16 NORTH AMERICA AUTONOMOUS UNDERWATER VEHICLES (AUV) IN AUR & ROV MARKET, BY REGION, 2018-2033 (USD THOUSAND)
TABLE 17 NORTH AMERICA AUTONOMOUS UNDERWATER VEHICLES (AUV) IN AUR & ROV MARKET, BY REGION, 2018-2033 (UNITS)
TABLE 18 NORTH AMERICA HYBRID VEHICLES IN AUR & ROV MARKET, BY REGION, 2018-2033 (USD THOUSAND)
TABLE 19 NORTH AMERICA HYBRID VEHICLES IN AUR & ROV MARKET, BY REGION, 2018-2033 (UNITS)
TABLE 20 NORTH AMERICA GLIDERS IN AUR & ROV MARKET, BY REGION, 2018-2033 (USD THOUSAND)
TABLE 21 NORTH AMERICA GLIDERS IN AUR & ROV MARKET, BY REGION, 2018-2033 (UNITS)
TABLE 22 NORTH AMERICA OTHERS IN AUR & ROV MARKET, BY REGION, 2018-2033 (USD THOUSAND)
TABLE 23 NORTH AMERICA OTHERS IN AUR & ROV MARKET, BY REGION, 2018-2033 (UNITS)
TABLE 24 NORTH AMERICA AUV & ROV MARKET, BY SYSTEM COMPONENT, 2018-2033 (USD THOUSAND)
TABLE 25 NORTH AMERICA AUV & ROV MARKET, BY SYSTEM COMPONENT, 2018-2033 (UNITS)
TABLE 26 NORTH AMERICA SENSORS & PAYLOADS IN AUV & ROV MARKET, BY TYPE, 2018-2033 (USD THOUSAND)
TABLE 27 NORTH AMERICA SONAR SYSTEMS IN AUV & ROV MARKET, BY TYPE, 2018-2033 (USD THOUSAND)
TABLE 28 NORTH AMERICA NAVIGATION SYSTEMS IN AUV & ROV MARKET, BY TYPE, 2018-2033 (USD THOUSAND)
TABLE 29 NORTH AMERICA CAMERAS IN AUV & ROV MARKET, BY TYPE, 2018-2033 (USD THOUSAND)
TABLE 30 NORTH AMERICA SENSORS & PAYLOADS IN AUR & ROV MARKET, BY REGION, 2018-2033 (USD THOUSAND)
TABLE 31 NORTH AMERICA SENSORS & PAYLOADS IN AUR & ROV MARKET, BY REGION, 2018-2033 (UNITS)
TABLE 32 NORTH AMERICA STRUCTURE & FRAMES IN AUR & ROV MARKET, BY REGION, 2018-2033 (USD THOUSAND)
TABLE 33 NORTH AMERICA STRUCTURE & FRAMES IN AUR & ROV MARKET, BY REGION, 2018-2033 (UNITS)
TABLE 34 NORTH AMERICA LAUNCH AND RECOVERY SYSTEMS IN AUR & ROV MARKET, BY REGION, 2018-2033 (USD THOUSAND)
TABLE 35 NORTH AMERICA LAUNCH AND RECOVERY SYSTEMS IN AUR & ROV MARKET, BY REGION, 2018-2033 (UNITS)
TABLE 36 NORTH AMERICA AUV & ROV MARKET, BY DEPTH, 2018-2033 (USD THOUSAND)
TABLE 37 NORTH AMERICA AUV & ROV MARKET, BY DEPTH, 2018-2033 (UNITS)
TABLE 38 NORTH AMERICA UP TO 300M IN AUV & ROV MARKET, BY APPLICATION, 2018-2033 (USD THOUSAND)
TABLE 39 NORTH AMERICA UP TO 300M IN AUR & ROV MARKET, BY REGION, 2018-2033 (USD THOUSAND)
TABLE 40 NORTH AMERICA UP TO 300M IN AUR & ROV MARKET, BY REGION, 2018-2033 (UNITS)
TABLE 41 NORTH AMERICA 301M-1,000M IN AUV & ROV MARKET, BY USAGE TYPE, 2018-2033 (USD THOUSAND)
TABLE 42 NORTH AMERICA 301M-1,000M IN AUR & ROV MARKET, BY REGION, 2018-2033 (USD THOUSAND)
TABLE 43 NORTH AMERICA 301M-1,000M IN AUR & ROV MARKET, BY REGION, 2018-2033 (UNITS)
TABLE 44 NORTH AMERICA 1,001M-3,000M IN AUR & ROV MARKET, BY REGION, 2018-2033 (USD THOUSAND)
TABLE 45 NORTH AMERICA 1,001M-3,000M IN AUR & ROV MARKET, BY REGION, 2018-2033 (UNITS)
TABLE 46 NORTH AMERICA >3,000M IN AUR & ROV MARKET, BY REGION, 2018-2033 (USD THOUSAND)
TABLE 47 NORTH AMERICA >3,000M IN AUR & ROV MARKET, BY REGION, 2018-2033 (UNITS)
TABLE 48 NORTH AMERICA AUV & ROV MARKET, BY APPLICATION, 2018-2033 (USD THOUSAND)
TABLE 49 NORTH AMERICA AUV & ROV MARKET, BY APPLICATION, 2018-2033 (UNITS)
TABLE 50 NORTH AMERICA OIL & GAS IN AUV & ROV MARKET, BY CHANNEL TYPE, 2018-2033 (USD THOUSAND)
TABLE 51 NORTH AMERICA PIPELINE & STRUCTURE INSPECTION IN AUV & ROV MARKET, BY PACKAGING, 2018-2033 (USD THOUSAND)
TABLE 52 NORTH AMERICA OIL & GAS IN AUR & ROV MARKET, BY REGION, 2018-2033 (USD THOUSAND)
TABLE 53 NORTH AMERICA OIL & GAS IN AUR & ROV MARKET, BY REGION, 2018-2033 (UNITS)
TABLE 54 NORTH AMERICA DEFENSE & SECURITY IN AUV & ROV MARKET, BY PACKAGING, 2018-2033 (USD THOUSAND)
TABLE 55 NORTH AMERICA DEFENSE & SECURITY IN AUR & ROV MARKET, BY REGION, 2018-2033 (USD THOUSAND)
TABLE 56 NORTH AMERICA DEFENSE & SECURITY IN AUR & ROV MARKET, BY REGION, 2018-2033 (UNITS)
TABLE 57 NORTH AMERICA SCIENTIFIC RESEARCH IN AUV & ROV MARKET, BY TYPE, 2018-2033 (USD THOUSAND)
TABLE 58 NORTH AMERICA SCIENTIFIC RESEARCH IN AUR & ROV MARKET, BY REGION, 2018-2033 (USD THOUSAND)
TABLE 59 NORTH AMERICA SCIENTIFIC RESEARCH IN AUR & ROV MARKET, BY REGION, 2018-2033 (UNITS)
TABLE 60 NORTH AMERICA ENVIRONMENTAL MONITORING IN AUV & ROV MARKET, BY CHANNEL TYPE, 2018-2033 (USD THOUSAND)
TABLE 61 NORTH AMERICA ENVIRONMENTAL MONITORING IN AUR & ROV MARKET, BY REGION, 2018-2033 (USD THOUSAND)
TABLE 62 NORTH AMERICA ENVIRONMENTAL MONITORING IN AUR & ROV MARKET, BY REGION, 2018-2033 (UNITS)
TABLE 63 NORTH AMERICA COMMERCIAL IN AUR & ROV MARKET, BY REGION, 2018-2033 (USD THOUSAND)
TABLE 64 NORTH AMERICA COMMERCIAL IN AUR & ROV MARKET, BY REGION, 2018-2033 (UNITS)
TABLE 65 NORTH AMERICA SEARCH & SALVAGE IN AUR & ROV MARKET, BY REGION, 2018-2033 (USD THOUSAND)
TABLE 66 NORTH AMERICA SEARCH & SALVAGE IN AUR & ROV MARKET, BY REGION, 2018-2033 (UNITS)
TABLE 67 NORTH AMERICA OTHERS IN AUR & ROV MARKET, BY REGION, 2018-2033 (USD THOUSAND)
TABLE 68 NORTH AMERICA OTHERS IN AUR & ROV MARKET, BY REGION, 2018-2033 (UNITS)
TABLE 69 NORTH AMERICA AUV & ROV MARKET, BY PROPULSION TYPE , 2018-2033 (USD THOUSAND)
TABLE 70 NORTH AMERICA AUV & ROV MARKET, BY PROPULSION TYPE, 2018-2033 (UNITS )
TABLE 71 NORTH AMERICA HYDRAULIC IN AUR & ROV MARKET, BY REGION, 2018-2033 (USD THOUSAND)
TABLE 72 NORTH AMERICA HYDRAULIC IN AUR & ROV MARKET, BY REGION, 2018-2033 (UNITS)
TABLE 73 NORTH AMERICA ELECTRIC IN AUR & ROV MARKET, BY REGION, 2018-2033 (USD THOUSAND)
TABLE 74 NORTH AMERICA ELECTRIC IN AUR & ROV MARKET, BY REGION, 2018-2033 (UNITS)
TABLE 75 NORTH AMERICA HYBRID IN AUR & ROV MARKET, BY REGION, 2018-2033 (USD THOUSAND)
TABLE 76 NORTH AMERICA HYBRID IN AUR & ROV MARKET, BY REGION, 2018-2033 (UNITS)
TABLE 77 NORTH AMERICA MECHANICAL IN AUR & ROV MARKET, BY REGION, 2018-2033 (USD THOUSAND)
TABLE 78 NORTH AMERICA MECHANICAL IN AUR & ROV MARKET, BY REGION, 2018-2033 (UNITS)
TABLE 79 NORTH AMERICA AUV & ROV MARKET, BY OPERATING MODALITY, 2018-2033 (USD THOUSAND)
TABLE 80 NORTH AMERICA AUV & ROV MARKET, BY OPERATING MODALITY, 2018-2033 (UNITS)
TABLE 81 NORTH AMERICA REMOTE-CONTROLLED IN AUV & ROV MARKET, BY PROPULSION TYPE, 2018-2033 (USD THOUSAND)
TABLE 82 NORTH AMERICA REMOTE-CONTROLLED IN AUR & ROV MARKET, BY REGION, 2018-2033 (USD THOUSAND)
TABLE 83 NORTH AMERICA REMOTE-CONTROLLED IN AUR & ROV MARKET, BY REGION, 2018-2033 (UNITS)
TABLE 84 NORTH AMERICA FULLY AUTONOMOUS IN AUV & ROV MARKET, BY PROPULSION TYPE, 2018-2033 (USD THOUSAND)
TABLE 85 NORTH AMERICA FULLY AUTONOMUS IN AUR & ROV MARKET, BY REGION, 2018-2033 (USD THOUSAND)
TABLE 86 NORTH AMERICA FULLY AUTONOMUS IN AUR & ROV MARKET, BY REGION, 2018-2033 (UNITS)
TABLE 87 NORTH AMERICA SEMI-AUTONOMOUS IN AUV & ROV MARKET, BY PROPULSION TYPE, 2018-2033 (USD THOUSAND)
TABLE 88 NORTH AMERICA SEMI-AUTONOMUS IN AUR & ROV MARKET, BY REGION, 2018-2033 (USD THOUSAND)
TABLE 89 NORTH AMERICA SEMI-AUTONOMUS IN AUR & ROV MARKET, BY REGION, 2018-2033 (UNITS)
TABLE 90 NORTH AMERICA HYBRID CONTROL IN AUV & ROV MARKET, BY PROPULSION TYPE, 2018-2033 (USD THOUSAND)
TABLE 91 NORTH AMERICA HYBRID CONTROL IN AUR & ROV MARKET, BY REGION, 2018-2033 (USD THOUSAND)
TABLE 92 NORTH AMERICA HYBRID CONTROL IN AUR & ROV MARKET, BY REGION, 2018-2033 (UNITS)
TABLE 93 NORTH AMERICA AUV & ROV MARKET, BY DISTRIBUTION CHANNEL, 2018-2033 (USD THOUSAND)
TABLE 94 NORTH AMERICA AUV & ROV MARKET, BY DISTRIBUTION CHANNEL, 2018-2033 (UNITS)
TABLE 95 NORTH AMERICA DIRECT IN AUR & ROV MARKET, BY REGION, 2018-2033 (USD THOUSAND)
TABLE 96 NORTH AMERICA DIRECT IN AUR & ROV MARKET, BY REGION, 2018-2033 (UNITS)
TABLE 97 NORTH AMERICA INDIRECT IN AUR & ROV MARKET, BY REGION, 2018-2033 (USD THOUSAND)
TABLE 98 NORTH AMERICA INDIRECT IN AUR & ROV MARKET, BY REGION, 2018-2033 (UNITS)
TABLE 99 NORTH AMERICA AUV & ROV MARKET, BY COUNTRY, 2018-2033 (USD THOUSAND)
TABLE 100 NORTH AMERICA AUV & ROV MARKET, BY COUNTRY, 2018-2033 (THOUSAND UNITS)
TABLE 101 NORTH AMERICA AUV & ROV MARKET, BY PRODUCT TYPE, 2018-2033 (USD THOUSAND)
TABLE 102 NORTH AMERICA AUV & ROV MARKET, BY PRODUCT TYPE, 2018-2033 (UNITS)
TABLE 103 NORTH AMERICA REMOTELY OPERATED VEHICLES (ROV) IN AUV & ROV MARKET, BY TYPE, 2018-2033 (USD THOUSAND)
TABLE 104 NORTH AMERICA WORK CLASS ROVS IN AUV & ROV MARKET, BY TYPE, 2018-2033 (USD THOUSAND)
TABLE 105 NORTH AMERICA OBSERVATION CLASS ROVS IN AUV & ROV MARKET, BY TYPE, 2018-2033 (USD THOUSAND)
TABLE 106 NORTH AMERICA AUTONOMOUS UNDERWATER VEHICLES (AUV) IN AUV & ROV MARKET, BY TYPE, 2018-2033 (USD THOUSAND)
TABLE 107 NORTH AMERICA MEDIUM WATER AUVS (100M – 1,000M) IN AUV & ROV MARKET, BY APPLICATION, 2018-2033 (USD THOUSAND)
TABLE 108 NORTH AMERICA MEDIUM WATER AUVS (100M – 1,000M) IN AUV & ROV MARKET, BY SENSORS USED, 2018-2033 (USD THOUSAND)
TABLE 109 NORTH AMERICA MEDIUM WATER AUVS (100M – 1,000M) IN AUV & ROV MARKET, BY DEPLOYMENT METHOD, 2018-2033 (USD THOUSAND)
TABLE 110 NORTH AMERICA AUV & ROV MARKET, BY SYSTEM COMPONENT, 2018-2033 (USD THOUSAND)
TABLE 111 NORTH AMERICA AUV & ROV MARKET, BY SYSTEM COMPONENT, 2018-2033 (UNITS)
TABLE 112 NORTH AMERICA SENSORS & PAYLOADS IN AUV & ROV MARKET, BY TYPE, 2018-2033 (USD THOUSAND)
TABLE 113 NORTH AMERICA SONAR SYSTEMS IN AUV & ROV MARKET, BY TYPE, 2018-2033 (USD THOUSAND)
TABLE 114 NORTH AMERICA NAVIGATION SYSTEMS IN AUV & ROV MARKET, BY TYPE, 2018-2033 (USD THOUSAND)
TABLE 115 NORTH AMERICA CAMERAS IN AUV & ROV MARKET, BY TYPE, 2018-2033 (USD THOUSAND)
TABLE 116 NORTH AMERICA AUV & ROV MARKET, BY DEPTH, 2018-2033 (USD THOUSAND)
TABLE 117 NORTH AMERICA AUV & ROV MARKET, BY DEPTH, 2018-2033 (UNITS)
TABLE 118 NORTH AMERICA UP TO 300M IN AUV & ROV MARKET, BY APPLICATION, 2018-2033 (USD THOUSAND)
TABLE 119 NORTH AMERICA 301M-1,000M IN AUV & ROV MARKET, BY USAGE TYPE, 2018-2033 (USD THOUSAND)
TABLE 120 NORTH AMERICA AUV & ROV MARKET, BY APPLICATION, 2018-2033 (USD THOUSAND)
TABLE 121 NORTH AMERICA AUV & ROV MARKET, BY APPLICATION, 2018-2033 (UNITS)
TABLE 122 NORTH AMERICA OIL & GAS IN AUV & ROV MARKET, BY CHANNEL TYPE, 2018-2033 (USD THOUSAND)
TABLE 123 NORTH AMERICA PIPELINE & STRUCTURE INSPECTION IN AUV & ROV MARKET, BY PACKAGING, 2018-2033 (USD THOUSAND)
TABLE 124 NORTH AMERICA DEFENSE & SECURITY IN AUV & ROV MARKET, BY PACKAGING, 2018-2033 (USD THOUSAND)
TABLE 125 NORTH AMERICA SCIENTIFIC RESEARCH IN AUV & ROV MARKET, BY TYPE, 2018-2033 (USD THOUSAND)
TABLE 126 NORTH AMERICA ENVIRONMENTAL MONITORING IN AUV & ROV MARKET, BY CHANNEL TYPE, 2018-2033 (USD THOUSAND)
TABLE 127 NORTH AMERICA AUV & ROV MARKET, BY PROPULSION TYPE , 2018-2033 (USD THOUSAND)
TABLE 128 NORTH AMERICA AUV & ROV MARKET, BY PROPULSION TYPE, 2018-2033 (UNITS )
TABLE 129 NORTH AMERICA AUV & ROV MARKET, BY OPERATING MODALITY, 2018-2033 (USD THOUSAND)
TABLE 130 NORTH AMERICA AUV & ROV MARKET, BY OPERATING MODALITY, 2018-2033 (UNITS)
TABLE 131 NORTH AMERICA REMOTE-CONTROLLED IN AUV & ROV MARKET, BY PROPULSION TYPE, 2018-2033 (USD THOUSAND)
TABLE 132 NORTH AMERICA FULLY AUTONOMOUS IN AUV & ROV MARKET, BY PROPULSION TYPE, 2018-2033 (USD THOUSAND)
TABLE 133 NORTH AMERICA SEMI-AUTONOMOUS IN AUV & ROV MARKET, BY PROPULSION TYPE, 2018-2033 (USD THOUSAND)
TABLE 134 NORTH AMERICA HYBRID CONTROL IN AUV & ROV MARKET, BY PROPULSION TYPE, 2018-2033 (USD THOUSAND)
TABLE 135 NORTH AMERICA AUV & ROV MARKET, BY DISTRIBUTION CHANNEL, 2018-2033 (USD THOUSAND)
TABLE 136 NORTH AMERICA AUV & ROV MARKET, BY DISTRIBUTION CHANNEL, 2018-2033 (UNITS)
TABLE 137 U.S. AUV & ROV MARKET, BY PRODUCT TYPE, 2018-2033 (USD THOUSAND)
TABLE 138 U.S. AUV & ROV MARKET, BY PRODUCT TYPE, 2018-2033 (UNITS)
TABLE 139 U.S. REMOTELY OPERATED VEHICLES (ROV) IN AUV & ROV MARKET, BY TYPE, 2018-2033 (USD THOUSAND)
TABLE 140 U.S. WORK CLASS ROVS IN AUV & ROV MARKET, BY TYPE, 2018-2033 (USD THOUSAND)
TABLE 141 U.S. OBSERVATION CLASS ROVS IN AUV & ROV MARKET, BY TYPE, 2018-2033 (USD THOUSAND)
TABLE 142 U.S. AUTONOMOUS UNDERWATER VEHICLES (AUV) IN AUV & ROV MARKET, BY TYPE, 2018-2033 (USD THOUSAND)
TABLE 143 U.S. MEDIUM WATER AUVS (100M – 1,000M) IN AUV & ROV MARKET, BY APPLICATION, 2018-2033 (USD THOUSAND)
TABLE 144 U.S. MEDIUM WATER AUVS (100M – 1,000M) IN AUV & ROV MARKET, BY SENSORS USED, 2018-2033 (USD THOUSAND)
TABLE 145 U.S. MEDIUM WATER AUVS (100M – 1,000M) IN AUV & ROV MARKET, BY DEPLOYMENT METHOD, 2018-2033 (USD THOUSAND)
TABLE 146 U.S. AUV & ROV MARKET, BY SYSTEM COMPONENT, 2018-2033 (USD THOUSAND)
TABLE 147 U.S. AUV & ROV MARKET, BY SYSTEM COMPONENT, 2018-2033 (UNITS)
TABLE 148 U.S. SENSORS & PAYLOADS IN AUV & ROV MARKET, BY TYPE, 2018-2033 (USD THOUSAND)
TABLE 149 U.S. SONAR SYSTEMS IN AUV & ROV MARKET, BY TYPE, 2018-2033 (USD THOUSAND)
TABLE 150 U.S. NAVIGATION SYSTEMS IN AUV & ROV MARKET, BY TYPE, 2018-2033 (USD THOUSAND)
TABLE 151 U.S. CAMERAS IN AUV & ROV MARKET, BY TYPE, 2018-2033 (USD THOUSAND)
TABLE 152 U.S. AUV & ROV MARKET, BY DEPTH, 2018-2033 (USD THOUSAND)
TABLE 153 U.S. AUV & ROV MARKET, BY DEPTH, 2018-2033 (UNITS)
TABLE 154 U.S. UP TO 300M IN AUV & ROV MARKET, BY APPLICATION, 2018-2033 (USD THOUSAND)
TABLE 155 U.S. 301M-1,000M IN AUV & ROV MARKET, BY USAGE TYPE, 2018-2033 (USD THOUSAND)
TABLE 156 U.S. AUV & ROV MARKET, BY APPLICATION, 2018-2033 (USD THOUSAND)
TABLE 157 U.S. AUV & ROV MARKET, BY APPLICATION, 2018-2033 (UNITS)
TABLE 158 U.S. OIL & GAS IN AUV & ROV MARKET, BY CHANNEL TYPE, 2018-2033 (USD THOUSAND)
TABLE 159 U.S. PIPELINE & STRUCTURE INSPECTION IN AUV & ROV MARKET, BY PACKAGING, 2018-2033 (USD THOUSAND)
TABLE 160 U.S. DEFENSE & SECURITY IN AUV & ROV MARKET, BY PACKAGING, 2018-2033 (USD THOUSAND)
TABLE 161 U.S. SCIENTIFIC RESEARCH IN AUV & ROV MARKET, BY TYPE, 2018-2033 (USD THOUSAND)
TABLE 162 U.S. ENVIRONMENTAL MONITORING IN AUV & ROV MARKET, BY CHANNEL TYPE, 2018-2033 (USD THOUSAND)
TABLE 163 U.S. AUV & ROV MARKET, BY PROPULSION TYPE , 2018-2033 (USD THOUSAND)
TABLE 164 U.S. AUV & ROV MARKET, BY PROPULSION TYPE, 2018-2033 (UNITS )
TABLE 165 U.S. AUV & ROV MARKET, BY OPERATING MODALITY, 2018-2033 (USD THOUSAND)
TABLE 166 U.S. AUV & ROV MARKET, BY OPERATING MODALITY, 2018-2033 (UNITS)
TABLE 167 U.S. REMOTE-CONTROLLED IN AUV & ROV MARKET, BY PROPULSION TYPE, 2018-2033 (USD THOUSAND)
TABLE 168 U.S. FULLY AUTONOMOUS IN AUV & ROV MARKET, BY PROPULSION TYPE, 2018-2033 (USD THOUSAND)
TABLE 169 U.S. SEMI-AUTONOMOUS IN AUV & ROV MARKET, BY PROPULSION TYPE, 2018-2033 (USD THOUSAND)
TABLE 170 U.S. HYBRID CONTROL IN AUV & ROV MARKET, BY PROPULSION TYPE, 2018-2033 (USD THOUSAND)
TABLE 171 U.S. AUV & ROV MARKET, BY DISTRIBUTION CHANNEL, 2018-2033 (USD THOUSAND)
TABLE 172 U.S. AUV & ROV MARKET, BY DISTRIBUTION CHANNEL, 2018-2033 (UNITS)
TABLE 173 CANADA AUV & ROV MARKET, BY PRODUCT TYPE, 2018-2033 (USD THOUSAND)
TABLE 174 CANADA AUV & ROV MARKET, BY PRODUCT TYPE, 2018-2033 (UNITS)
TABLE 175 CANADA REMOTELY OPERATED VEHICLES (ROV) IN AUV & ROV MARKET, BY TYPE, 2018-2033 (USD THOUSAND)
TABLE 176 CANADA WORK CLASS ROVS IN AUV & ROV MARKET, BY TYPE, 2018-2033 (USD THOUSAND)
TABLE 177 CANADA OBSERVATION CLASS ROVS IN AUV & ROV MARKET, BY TYPE, 2018-2033 (USD THOUSAND)
TABLE 178 CANADA AUTONOMOUS UNDERWATER VEHICLES (AUV) IN AUV & ROV MARKET, BY TYPE, 2018-2033 (USD THOUSAND)
TABLE 179 CANADA MEDIUM WATER AUVS (100M – 1,000M) IN AUV & ROV MARKET, BY APPLICATION, 2018-2033 (USD THOUSAND)
TABLE 180 CANADA MEDIUM WATER AUVS (100M – 1,000M) IN AUV & ROV MARKET, BY SENSORS USED, 2018-2033 (USD THOUSAND)
TABLE 181 CANADA MEDIUM WATER AUVS (100M – 1,000M) IN AUV & ROV MARKET, BY DEPLOYMENT METHOD, 2018-2033 (USD THOUSAND)
TABLE 182 CANADA AUV & ROV MARKET, BY SYSTEM COMPONENT, 2018-2033 (USD THOUSAND)
TABLE 183 CANADA AUV & ROV MARKET, BY SYSTEM COMPONENT, 2018-2033 (UNITS)
TABLE 184 CANADA SENSORS & PAYLOADS IN AUV & ROV MARKET, BY TYPE, 2018-2033 (USD THOUSAND)
TABLE 185 CANADA SONAR SYSTEMS IN AUV & ROV MARKET, BY TYPE, 2018-2033 (USD THOUSAND)
TABLE 186 CANADA NAVIGATION SYSTEMS IN AUV & ROV MARKET, BY TYPE, 2018-2033 (USD THOUSAND)
TABLE 187 CANADA CAMERAS IN AUV & ROV MARKET, BY TYPE, 2018-2033 (USD THOUSAND)
TABLE 188 CANADA AUV & ROV MARKET, BY DEPTH, 2018-2033 (USD THOUSAND)
TABLE 189 CANADA AUV & ROV MARKET, BY DEPTH, 2018-2033 (UNITS)
TABLE 190 CANADA UP TO 300M IN AUV & ROV MARKET, BY APPLICATION, 2018-2033 (USD THOUSAND)
TABLE 191 CANADA 301M-1,000M IN AUV & ROV MARKET, BY USAGE TYPE, 2018-2033 (USD THOUSAND)
TABLE 192 CANADA AUV & ROV MARKET, BY APPLICATION, 2018-2033 (USD THOUSAND)
TABLE 193 CANADA AUV & ROV MARKET, BY APPLICATION, 2018-2033 (UNITS)
TABLE 194 CANADA OIL & GAS IN AUV & ROV MARKET, BY CHANNEL TYPE, 2018-2033 (USD THOUSAND)
TABLE 195 CANADA PIPELINE & STRUCTURE INSPECTION IN AUV & ROV MARKET, BY PACKAGING, 2018-2033 (USD THOUSAND)
TABLE 196 CANADA DEFENSE & SECURITY IN AUV & ROV MARKET, BY PACKAGING, 2018-2033 (USD THOUSAND)
TABLE 197 CANADA SCIENTIFIC RESEARCH IN AUV & ROV MARKET, BY TYPE, 2018-2033 (USD THOUSAND)
TABLE 198 CANADA ENVIRONMENTAL MONITORING IN AUV & ROV MARKET, BY CHANNEL TYPE, 2018-2033 (USD THOUSAND)
TABLE 199 CANADA AUV & ROV MARKET, BY PROPULSION TYPE , 2018-2033 (USD THOUSAND)
TABLE 200 CANADA AUV & ROV MARKET, BY PROPULSION TYPE, 2018-2033 (UNITS )
TABLE 201 CANADA AUV & ROV MARKET, BY OPERATING MODALITY, 2018-2033 (USD THOUSAND)
TABLE 202 CANADA AUV & ROV MARKET, BY OPERATING MODALITY, 2018-2033 (UNITS)
TABLE 203 CANADA REMOTE-CONTROLLED IN AUV & ROV MARKET, BY PROPULSION TYPE, 2018-2033 (USD THOUSAND)
TABLE 204 CANADA FULLY AUTONOMOUS IN AUV & ROV MARKET, BY PROPULSION TYPE, 2018-2033 (USD THOUSAND)
TABLE 205 CANADA SEMI-AUTONOMOUS IN AUV & ROV MARKET, BY PROPULSION TYPE, 2018-2033 (USD THOUSAND)
TABLE 206 CANADA HYBRID CONTROL IN AUV & ROV MARKET, BY PROPULSION TYPE, 2018-2033 (USD THOUSAND)
TABLE 207 CANADA AUV & ROV MARKET, BY DISTRIBUTION CHANNEL, 2018-2033 (USD THOUSAND)
TABLE 208 CANADA AUV & ROV MARKET, BY DISTRIBUTION CHANNEL, 2018-2033 (UNITS)
TABLE 209 MEXICO AUV & ROV MARKET, BY PRODUCT TYPE, 2018-2033 (USD THOUSAND)
TABLE 210 MEXICO AUV & ROV MARKET, BY PRODUCT TYPE, 2018-2033 (UNITS)
TABLE 211 MEXICO REMOTELY OPERATED VEHICLES (ROV) IN AUV & ROV MARKET, BY TYPE, 2018-2033 (USD THOUSAND)
TABLE 212 MEXICO WORK CLASS ROVS IN AUV & ROV MARKET, BY TYPE, 2018-2033 (USD THOUSAND)
TABLE 213 MEXICO OBSERVATION CLASS ROVS IN AUV & ROV MARKET, BY TYPE, 2018-2033 (USD THOUSAND)
TABLE 214 MEXICO AUTONOMOUS UNDERWATER VEHICLES (AUV) IN AUV & ROV MARKET, BY TYPE, 2018-2033 (USD THOUSAND)
TABLE 215 MEXICO MEDIUM WATER AUVS (100M – 1,000M) IN AUV & ROV MARKET, BY APPLICATION, 2018-2033 (USD THOUSAND)
TABLE 216 MEXICO MEDIUM WATER AUVS (100M – 1,000M) IN AUV & ROV MARKET, BY SENSORS USED, 2018-2033 (USD THOUSAND)
TABLE 217 MEXICO MEDIUM WATER AUVS (100M – 1,000M) IN AUV & ROV MARKET, BY DEPLOYMENT METHOD, 2018-2033 (USD THOUSAND)
TABLE 218 MEXICO AUV & ROV MARKET, BY SYSTEM COMPONENT, 2018-2033 (USD THOUSAND)
TABLE 219 MEXICO AUV & ROV MARKET, BY SYSTEM COMPONENT, 2018-2033 (UNITS)
TABLE 220 MEXICO SENSORS & PAYLOADS IN AUV & ROV MARKET, BY TYPE, 2018-2033 (USD THOUSAND)
TABLE 221 MEXICO SONAR SYSTEMS IN AUV & ROV MARKET, BY TYPE, 2018-2033 (USD THOUSAND)
TABLE 222 MEXICO NAVIGATION SYSTEMS IN AUV & ROV MARKET, BY TYPE, 2018-2033 (USD THOUSAND)
TABLE 223 MEXICO CAMERAS IN AUV & ROV MARKET, BY TYPE, 2018-2033 (USD THOUSAND)
TABLE 224 MEXICO AUV & ROV MARKET, BY DEPTH, 2018-2033 (USD THOUSAND)
TABLE 225 MEXICO AUV & ROV MARKET, BY DEPTH, 2018-2033 (UNITS)
TABLE 226 MEXICO UP TO 300M IN AUV & ROV MARKET, BY APPLICATION, 2018-2033 (USD THOUSAND)
TABLE 227 MEXICO 301M-1,000M IN AUV & ROV MARKET, BY USAGE TYPE, 2018-2033 (USD THOUSAND)
TABLE 228 MEXICO AUV & ROV MARKET, BY APPLICATION, 2018-2033 (USD THOUSAND)
TABLE 229 MEXICO AUV & ROV MARKET, BY APPLICATION, 2018-2033 (UNITS)
TABLE 230 MEXICO OIL & GAS IN AUV & ROV MARKET, BY CHANNEL TYPE, 2018-2033 (USD THOUSAND)
TABLE 231 MEXICO PIPELINE & STRUCTURE INSPECTION IN AUV & ROV MARKET, BY PACKAGING, 2018-2033 (USD THOUSAND)
TABLE 232 MEXICO DEFENSE & SECURITY IN AUV & ROV MARKET, BY PACKAGING, 2018-2033 (USD THOUSAND)
TABLE 233 MEXICO SCIENTIFIC RESEARCH IN AUV & ROV MARKET, BY TYPE, 2018-2033 (USD THOUSAND)
TABLE 234 MEXICO ENVIRONMENTAL MONITORING IN AUV & ROV MARKET, BY CHANNEL TYPE, 2018-2033 (USD THOUSAND)
TABLE 235 MEXICO AUV & ROV MARKET, BY PROPULSION TYPE , 2018-2033 (USD THOUSAND)
TABLE 236 MEXICO AUV & ROV MARKET, BY PROPULSION TYPE, 2018-2033 (UNITS )
TABLE 237 MEXICO AUV & ROV MARKET, BY OPERATING MODALITY, 2018-2033 (USD THOUSAND)
TABLE 238 MEXICO AUV & ROV MARKET, BY OPERATING MODALITY, 2018-2033 (UNITS)
TABLE 239 MEXICO REMOTE-CONTROLLED IN AUV & ROV MARKET, BY PROPULSION TYPE, 2018-2033 (USD THOUSAND)
TABLE 240 MEXICO FULLY AUTONOMOUS IN AUV & ROV MARKET, BY PROPULSION TYPE, 2018-2033 (USD THOUSAND)
TABLE 241 MEXICO SEMI-AUTONOMOUS IN AUV & ROV MARKET, BY PROPULSION TYPE, 2018-2033 (USD THOUSAND)
TABLE 242 MEXICO HYBRID CONTROL IN AUV & ROV MARKET, BY PROPULSION TYPE, 2018-2033 (USD THOUSAND)
TABLE 243 MEXICO AUV & ROV MARKET, BY DISTRIBUTION CHANNEL, 2018-2033 (USD THOUSAND)
TABLE 244 MEXICO AUV & ROV MARKET, BY DISTRIBUTION CHANNEL, 2018-2033 (UNITS)
List of Figure
FIGURE 1 NORTH AMERICA AUV & ROV MARKET: SEGMENTATION
FIGURE 2 NORTH AMERICA AUV & ROV MARKET: DATA TRIANGULATION
FIGURE 3 NORTH AMERICA AUV & ROV MARKET: DROC ANALYSIS
FIGURE 4 NORTH AMERICA AUV & ROV MARKET: NORTH AMERICA VS REGIONAL MARKET ANALYSIS
FIGURE 5 NORTH AMERICA AUV & ROV MARKET: COMPANY RESEARCH ANALYSIS
FIGURE 6 NORTH AMERICA AUV & ROV MARKET: MULTIVARIATE MODELLING
FIGURE 7 NORTH AMERICA AUV & ROV MARKET: INTERVIEW DEMOGRAPHICS
FIGURE 8 NORTH AMERICA AUV & ROV MARKET: DBMR MARKET POSITION GRID
FIGURE 9 NORTH AMERICA AUV & ROV MARKET: MARKET APPLICATION COVERAGE GRID
FIGURE 10 NORTH AMERICA AUV & ROV MARKET: VENDOR SHARE ANALYSIS
FIGURE 11 NORTH AMERICA AUV & ROV MARKET: SEGMENTATION
FIGURE 12 EXECUTIVE SUMMARY
FIGURE 13 FIVE SEGMENTS COMPRISE THE NORTH AMERICA AUV & ROV MARKET, BY PRODUCT TYPE (2025)
FIGURE 14 STRATEGIC DECISIONS
FIGURE 15 GROWING OFFSHORE OIL & GAS EXPLORATION AND DEEPWATER FIELD DEVELOPMENT DRIVING THE NORTH AMERICA AUV & ROV MARKET FROM 2026 TO 2033
FIGURE 16 REMOTELY OPERATED VEHICLES (ROV) SEGMENT IS EXPECTED TO ACCOUNT FOR THE LARGEST SHARE OF THE NORTH AMERICA AUV & ROV MARKET IN 2025& 2033
FIGURE 17 NORTH AMERICA IS EXPECTED TO DOMINATE THE NORTH AMERICA AUV & ROV MARKET AND ASIA-PACIFIC TO GROW WITH THE HIGHEST CAGR IN THE FORECAST PERIOD OF 2026 TO 2033
FIGURE 18 NORTH AMERICA IS THE FASTEST GROWING MARKET FOR HOP WATER MANUFACTURERS IN THE FORECAST PERIOD OF 2026 TO 2033
FIGURE 19 VENDOR SELECTION CRITERIA
FIGURE 20 PRICING ANALAYSIS
FIGURE 21 DROC ANALYSIS
FIGURE 22 NORTH AMERICA AUV & ROV MARKET: BY PRODUCT TYPE, 2025
FIGURE 23 NORTH AMERICA AUV & ROV MARKET: BY SYSTEM COMPONENT, 2025
FIGURE 24 NORTH AMERICA AUV & ROV MARKET: BY DEPTH, 2025
FIGURE 25 NORTH AMERICA AUV & ROV MARKET: BY APPLICATION, 2025
FIGURE 26 NORTH AMERICA AUV & ROV MARKET: BY PROPULSION TYPE, 2025
FIGURE 27 NORTH AMERICA AUV & ROV MARKET: BY OPERATING MODALITY, 2025
FIGURE 28 NORTH AMERICA AUV & ROV MARKET: BY DISTRIBUTION CHANNEL, 2025
FIGURE 29 NORTH AMERICA AUV & ROV MARKET: SNAPSHOT
FIGURE 30 NORTH AMERICA AUV & ROV MARKET: COMPANY SHARE 2025 (%)
Data collection and base year analysis are done using data collection modules with large sample sizes. The stage includes obtaining market information or related data through various sources and strategies. It includes examining and planning all the data acquired from the past in advance. It likewise envelops the examination of information inconsistencies seen across different information sources. The market data is analysed and estimated using market statistical and coherent models. Also, market share analysis and key trend analysis are the major success factors in the market report. To know more, please request an analyst call or drop down your inquiry.
The key research methodology used by DBMR research team is data triangulation which involves data mining, analysis of the impact of data variables on the market and primary (industry expert) validation. Data models include Vendor Positioning Grid, Market Time Line Analysis, Market Overview and Guide, Company Positioning Grid, Patent Analysis, Pricing Analysis, Company Market Share Analysis, Standards of Measurement, Global versus Regional and Vendor Share Analysis. To know more about the research methodology, drop in an inquiry to speak to our industry experts.
Data Bridge Market Research is a leader in advanced formative research. We take pride in servicing our existing and new customers with data and analysis that match and suits their goal. The report can be customized to include price trend analysis of target brands understanding the market for additional countries (ask for the list of countries), clinical trial results data, literature review, refurbished market and product base analysis. Market analysis of target competitors can be analyzed from technology-based analysis to market portfolio strategies. We can add as many competitors that you require data about in the format and data style you are looking for. Our team of analysts can also provide you data in crude raw excel files pivot tables (Fact book) or can assist you in creating presentations from the data sets available in the report.


