
North America Bag In Box Packaging Machine Market
Market Size in USD Billion
 USD
53.31 Billion
USD
73.52 Billion
2025
2033
USD
53.31 Billion
USD
73.52 Billion
2025
2033
| 2026 - 2033 | |
| USD 53.31 Billion | |
| USD 73.52 Billion | |
| % | |
|
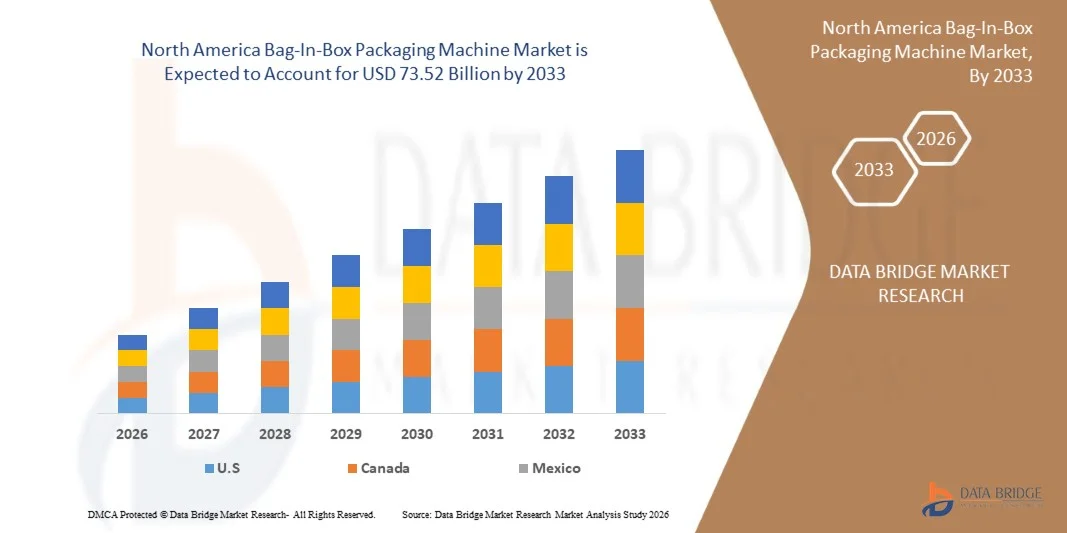
North America Bag-In-Box Packaging Machine Market Size
- The North America Bag-In-Box Packaging Machine Market size was valued at USD 53.31 billion in 2025 and is expected to reach USD 73.52 billion by 2033, at a CAGR of 4.10% during the forecast period
- The market growth is largely fueled by the rising demand for efficient, hygienic, and cost-effective packaging solutions in the food and beverage industry, where Bag-In-Box systems are increasingly adopted for liquid products such as wine, dairy, juices, and edible oils, supported by the expansion of large-scale retail and bulk distribution channels
- Furthermore, growing emphasis on sustainability, reduced packaging waste, and extended product shelf life is driving manufacturers to adopt flexible packaging formats that minimize material usage and improve transportation efficiency, thereby strengthening the shift toward Bag-In-Box packaging systems across global supply chains
North America Bag-In-Box Packaging Machine Market Analysis
- Bag-In-Box packaging machines are automated systems designed to fill, seal, and package liquid or semi-liquid products into flexible bags placed inside corrugated boxes, ensuring aseptic conditions, product safety, and longer shelf stability while supporting high-speed industrial production requirements
- The escalating demand for Bag-In-Box packaging machines is primarily fueled by the expansion of processed food and beverage consumption, increasing adoption of automated packaging lines, and growing need for sustainable, space-efficient, and low-cost bulk packaging solutions across commercial and industrial applications
- U.S. dominated the North America Bag-In-Box Packaging Machine Market in 2025, due to strong demand from beverage, dairy, wine, and liquid food packaging industries along with rapid automation adoption across filling and packaging operations
- Canada is expected to be the fastest growing country in the North America Bag-In-Box Packaging Machine Market during the forecast period due to rising adoption of sustainable packaging solutions, growing demand from the alcoholic beverage and dairy sectors, and increasing focus on reducing packaging waste across food processing industries
- Automatic segment dominated the market with a market share of 68.5% in 2025, due to rising demand for high-speed, precise, and continuous packaging operations across large manufacturing units. Automatic machines minimize human intervention, improve accuracy in filling volumes, and reduce operational downtime. Industries such as food and beverages and chemicals increasingly rely on fully automated systems to maintain hygiene standards and production efficiency
Report Scope and North America Bag-In-Box Packaging Machine Market Segmentation
|
Attributes |
Bag-In-Box Packaging Machine Key Market Insights |
|
Segments Covered |
|
|
Countries Covered |
North America
|
|
Key Market Players |
|
|
Market Opportunities |
|
|
Value Added Data Infosets |
In addition to the insights on market scenarios such as market value, growth rate, segmentation, geographical coverage, and major players, the market reports curated by the Data Bridge Market Research also include import export analysis, production capacity overview, production consumption analysis, price trend analysis, climate change scenario, supply chain analysis, value chain analysis, raw material/consumables overview, vendor selection criteria, PESTLE Analysis, Porter Analysis, and regulatory framework. |
North America Bag-In-Box Packaging Machine Market Trends
“Growing Adoption of Sustainable Aseptic Packaging”
- A significant trend in the North America Bag-In-Box Packaging Machine Market is the increasing shift toward sustainable and aseptic packaging solutions, driven by rising demand for longer shelf life, reduced food waste, and environmentally responsible packaging formats across beverage, dairy, and liquid food industries. This transition is strengthening the role of Bag-In-Box systems as a preferred alternative to rigid plastic containers and traditional bulk packaging methods
- For instance, companies such as Smurfit Kappa and DS Smith are expanding sustainable Bag-In-Box packaging portfolios that use recyclable materials and optimized box structures to reduce carbon footprint. These developments support food and beverage manufacturers in meeting sustainability targets while maintaining product safety and packaging efficiency
- The adoption of aseptic Bag-In-Box technology is growing rapidly in applications such as wine, juice, and dairy packaging, where contamination-free filling and extended shelf stability are critical. This is driving increased investment in sterile filling systems and advanced sealing technologies across production facilities
- The beverage industry is increasingly integrating Bag-In-Box formats for bulk dispensing systems in foodservice and retail channels, enabling efficient storage, reduced packaging costs, and minimized product loss. This is strengthening demand for automated filling and dispensing equipment with high precision and hygiene standards
- Manufacturers are also focusing on lightweight and flexible packaging designs that reduce transportation costs and improve logistics efficiency across supply chains. This is encouraging innovation in machine design to support faster filling speeds and compatibility with recyclable materials
- The overall trend is reinforcing a strong shift toward environmentally efficient and high-performance packaging systems, positioning Bag-In-Box packaging machines as a key enabler of sustainable liquid packaging transformation across global food and beverage industries
North America Bag-In-Box Packaging Machine Market Dynamics
Driver
“Rising Demand for Automated Liquid Packaging Systems”
- The growing demand for automated liquid packaging systems is a key driver in the North America Bag-In-Box Packaging Machine Market, supported by increasing consumption of packaged beverages, dairy products, and liquid food items that require hygienic, high-speed, and cost-efficient filling solutions. Automation is improving production efficiency and reducing dependency on manual packaging processes
- For instance, companies such as Liquibox and SIG provide advanced Bag-In-Box filling and dispensing systems widely used in beverage and food processing industries for high-volume liquid packaging. These systems enhance operational efficiency and ensure consistent product quality across large-scale production environments
- The expansion of the processed food and beverage industry is increasing the need for scalable packaging systems capable of handling diverse liquid viscosities with minimal waste and contamination risk. This is accelerating adoption of automated Bag-In-Box machinery in industrial production lines
- The rising focus on operational cost reduction is encouraging manufacturers to shift toward automated systems that improve throughput and reduce labor-intensive packaging activities. This is further strengthening the demand for integrated filling and sealing technologies
- The continuous growth in bulk liquid distribution and institutional foodservice applications is reinforcing the need for efficient packaging systems that support large-scale dispensing and logistics optimization. This sustained demand is driving long-term market expansion for Bag-In-Box packaging machines
Restraint/Challenge
“High Cost and Maintenance of Packaging Machines”
- The North America Bag-In-Box Packaging Machine Market faces a key challenge due to high initial investment costs and complex maintenance requirements associated with advanced automated filling and sealing systems. These machines require precision engineering, specialized components, and regular servicing, increasing overall operational expenditure for end users
- For instance, equipment manufacturers such as KHS GmbH and SACMI provide high-performance liquid packaging machines that involve sophisticated control systems and aseptic technologies, which demand skilled maintenance and technical expertise. This increases the cost burden for small and mid-sized packaging operators
- The complexity of machine calibration, cleaning, and sterilization processes adds to downtime and operational challenges in high-throughput production environments. This affects production continuity and limits adoption among cost-sensitive manufacturers
- The requirement for specialized spare parts and technical support infrastructure further increases lifecycle maintenance costs. This creates dependency on OEM service networks and reduces flexibility in operational management
- Overall, these cost and maintenance challenges restrain faster adoption of advanced Bag-In-Box packaging machines despite strong demand growth in the liquid packaging industry
North America Bag-In-Box Packaging Machine Market Scope
The market is segmented on the basis of machine type, automation type, packaging material, output capacity, filling technology, and end-user.
• By Machine Type
On the basis of machine type, the North America Bag-In-Box Packaging Machine Market is segmented into standalone and integrated systems. The integrated segment dominated the largest market revenue share in 2025, driven by its ability to streamline end-to-end packaging operations within a single production line setup. Manufacturers prefer integrated systems due to higher operational efficiency, reduced manual intervention, and improved consistency in filling and sealing processes. These systems are widely adopted in large-scale production facilities where automation and throughput optimization are critical. The growing demand for synchronized packaging lines across food, beverage, and industrial liquid sectors further strengthens the dominance of integrated machines.
The standalone segment is anticipated to witness the fastest growth rate from 2026 to 2033, fueled by increasing adoption among small and medium-scale producers seeking flexible and cost-efficient packaging solutions. Standalone machines offer easier installation and scalability, making them suitable for facilities with limited production infrastructure. Their modular nature allows businesses to upgrade existing packaging lines without major system overhauls. Rising demand for customized and batch-based production across niche markets is accelerating the uptake of standalone systems.
• By Automation Type
On the basis of automation type, the market is segmented into semi-automatic, automatic, and manual systems. The automatic segment held the largest market revenue share of 68.5% in 2025, driven by rising demand for high-speed, precise, and continuous packaging operations across large manufacturing units. Automatic machines minimize human intervention, improve accuracy in filling volumes, and reduce operational downtime. Industries such as food and beverages and chemicals increasingly rely on fully automated systems to maintain hygiene standards and production efficiency. The integration of smart controls and sensors further enhances their operational reliability and market dominance.
The semi-automatic segment is expected to witness the fastest CAGR from 2026 to 2033, supported by growing adoption in mid-sized enterprises transitioning from manual to automated packaging solutions. Semi-automatic systems offer a balance between affordability and operational efficiency, making them suitable for businesses with moderate production volumes. Their ease of operation and lower maintenance requirements contribute to rising demand in emerging markets. Increasing preference for flexible production setups in diverse end-use industries is driving the growth of semi-automatic machines.
• By Packaging Material
On the basis of packaging material, the market is segmented into plastic, paper and paperboard, metal, and others. The plastic segment dominated the largest market revenue share in 2025, driven by its high durability, flexibility, and cost-effectiveness in liquid packaging applications. Plastic materials provide excellent barrier properties that help preserve product quality and extend shelf life, making them widely used in beverages, paints, and industrial liquids. Their lightweight nature also reduces transportation costs and improves handling efficiency across supply chains. Strong compatibility with bag-in-box systems further reinforces the dominance of plastic packaging materials.
The paper and paperboard segment is anticipated to witness the fastest growth rate from 2026 to 2033, fueled by increasing environmental concerns and rising demand for sustainable packaging solutions. These materials are gaining traction due to their recyclability and reduced environmental footprint compared to conventional plastics. Regulatory pressures and corporate sustainability initiatives are encouraging manufacturers to adopt eco-friendly alternatives. Expanding use in food and beverage packaging applications is further accelerating the shift toward paper-based bag-in-box solutions.
• By Output Capacity
On the basis of output capacity, the market is segmented into 10 bags/min, 11–50 bags/min, 51–100 bags/min, and above 100 bags/min. The 11–50 bags/min segment dominated the largest market revenue share in 2025, driven by its suitability for medium-scale production environments requiring balanced efficiency and operational control. This capacity range is widely adopted across food, beverage, and industrial liquid packaging lines due to its flexibility in handling diverse production volumes. Manufacturers prefer this segment for its cost-effectiveness and ability to maintain consistent output without excessive capital investment. Its versatility across multiple end-use industries strengthens its leading position in the market.
The above 100 bags/min segment is expected to witness the fastest growth rate from 2026 to 2033, driven by rising demand for high-speed packaging in large-scale manufacturing facilities. Increasing automation in production lines and the need for bulk packaging efficiency are key factors supporting this growth. Industries such as beverages and chemicals are increasingly investing in high-capacity machines to meet growing global demand. Advancements in machine engineering and precision control systems are further enabling higher throughput capabilities.
• By Filling Technology
On the basis of filling technology, the market is segmented into aseptic and non-aseptic systems. The non-aseptic segment dominated the largest market revenue share in 2025, driven by its widespread use in packaging non-perishable liquids such as paints, lubricants, and household products. Non-aseptic systems are preferred for their simpler operational requirements and lower equipment costs compared to sterile filling technologies. Their ability to handle a broad range of industrial liquids makes them highly versatile across multiple applications. Strong adoption in industrial and chemical sectors continues to support the dominance of non-aseptic filling technology.
The aseptic segment is anticipated to witness the fastest growth rate from 2026 to 2033, fueled by increasing demand for hygienic and contamination-free packaging in food, beverage, and healthcare industries. Aseptic systems enable extended shelf life without preservatives, making them highly suitable for sensitive liquid products. Rising consumer preference for safe and high-quality packaged goods is accelerating adoption. Technological advancements in sterilization and sealing processes are further strengthening the growth of aseptic filling systems.
• By End User
On the basis of end user, the market is segmented into food and beverages, paints and lubricants, personal care, household products, healthcare, and others. The food and beverages segment dominated the largest market revenue share in 2025, driven by strong demand for efficient bulk liquid packaging solutions in dairy, juices, wines, and edible oils. Bag-in-box systems are widely preferred in this sector due to their ability to preserve freshness and reduce contamination risks. Their cost efficiency and ease of transportation make them highly suitable for large-scale distribution networks. The growing global consumption of packaged food and beverages further reinforces the dominance of this segment.
The healthcare segment is expected to witness the fastest growth rate from 2026 to 2033, driven by increasing demand for sterile and secure packaging of liquid pharmaceuticals and medical solutions. Bag-in-box systems offer high protection against contamination, making them suitable for sensitive healthcare applications. Rising investments in healthcare infrastructure and pharmaceutical manufacturing are supporting market expansion. The shift toward safe, hygienic, and compliant packaging standards is accelerating adoption in this segment.
North America Bag-In-Box Packaging Machine Market Regional Analysis
- U.S. dominated the North America Bag-In-Box Packaging Machine Market with the largest revenue share in 2025, driven by strong demand from beverage, dairy, wine, and liquid food packaging industries along with rapid automation adoption across filling and packaging operations
- The demand for Bag-In-Box packaging machines is further supported by continuous capacity expansion and technological advancements by companies such as Liqui-Box Corporation and Scholle IPN, focusing on high-speed filling systems, aseptic packaging solutions, and sustainable flexible packaging formats integrated with advanced dispensing technologies
- The presence of large-scale food and beverage manufacturers, strong retail distribution networks, and increasing shift toward cost-efficient bulk liquid packaging solutions reinforces the U.S. leadership position in the North America market
Canada North America Bag-In-Box Packaging Machine Market Insight
Canada is projected to register the fastest CAGR in the North America Bag-In-Box Packaging Machine Market from 2026 to 2033, supported by rising adoption of sustainable packaging solutions, growing demand from the alcoholic beverage and dairy sectors, and increasing focus on reducing packaging waste across food processing industries. Favorable regulatory support for eco-friendly packaging and expanding cold-chain infrastructure are further accelerating market growth. Growth is further supported by investments and expansion activities from companies such as DS Smith and Smurfit Kappa, focusing on recyclable bag-in-box systems, advanced filling technologies, and improved shelf-life preservation solutions across major Canadian food and beverage hubs. Increasing emphasis on circular economy practices, rising demand for bulk liquid distribution, and growing automation in packaging lines position Canada as the fastest-growing country in the region during the forecast period.
Mexico North America Bag-In-Box Packaging Machine Market Insight
Mexico is expected to grow steadily from 2026 to 2033, driven by rising demand for cost-effective packaging solutions, expanding beverage production capacity, and increasing penetration of processed food and liquid dairy products across domestic and export markets. Growing industrialization in food and beverage manufacturing and rising adoption of automated packaging systems further support market expansion. Market development is further strengthened by investments and operational activities involving companies such as KHS GmbH and SIG Combibloc Group, focusing on efficient filling technologies, improved packaging throughput, and scalable production lines across key industrial zones. Increasing export-oriented beverage production, rising retail consumption, and continuous modernization of packaging infrastructure contribute to sustained growth of the North America Bag-In-Box Packaging Machine Market throughout the forecast period.
North America Bag-In-Box Packaging Machine Market Share
The bag-in-box packaging machine industry is primarily led by well-established companies, including:
- TORR Industries (U.S.)
- ABCO Automation (U.S.)
- IC Filling Systems (U.K.)
- Kreuzmayr Maschinenbau GmbH (Austria)
- Triangle Package Machinery Company (U.S.)
- voran Maschinen GmbH (Austria)
- Smurfit Kappa (Ireland)
- Liquibox (U.S.)
- DS Smith (U.K.)
- Robert Bosch GmbH (Germany)
- ALFA LAVAL (Sweden)
- Pattyn (Belgium)
- SACMI IMOLA S.C Via Selice (Italy)
- SIG (Switzerland)
- Technibag (France)
- ProXES GmbH (Germany)
- Flexifill Ltd. (U.K.)
- Amcor plc (Switzerland)
Latest Developments in North America Bag-In-Box Packaging Machine Market
- In February 2024, Smurfit Kappa Group announced plans to open a new bag-in-box machine plant in Alicante, Spain, with an investment of USD 58.2 million, aiming to double production capacity and expand its machine portfolio. This development strengthens global supply capabilities for bag-in-box packaging machines and improves availability of advanced filling systems, indirectly influencing North America through increased technology transfer, competitive pricing pressure, and faster adoption of high-efficiency production lines by regional manufacturers
- In February 2024, Aran Group completed the acquisition of a majority stake in IBA Germany from Liquid Concept GmbH, consolidating its position in the bag-in-box machinery space. This acquisition enhances integration of advanced filling and dispensing technologies, supporting innovation in aseptic and liquid packaging systems. The consolidation trend increases competitive intensity in the global market, encouraging North American players to accelerate automation upgrades and improve machine precision and operational efficiency
- In January 2024, WestRock Company unveiled plans to construct a new corrugated box plant in Pleasant Prairie, Wisconsin, with an investment of USD 140 million to meet rising demand in the Great Lakes region. This expansion strengthens packaging infrastructure in North America and supports higher demand for bag-in-box secondary packaging components. It also improves regional supply chain resilience, enabling faster machine deployment cycles and boosting adoption of integrated packaging solutions across beverage and food processing industries
- In October 2023, Amcor introduced a circular connector as part of its sustainable packaging solutions, offering a 70% lower carbon footprint compared to existing products. This innovation significantly accelerates the shift toward sustainable bag-in-box packaging formats, influencing machine manufacturers to integrate eco-friendly compatibility features. It drives demand for advanced sealing, filling, and dispensing systems in North America as retailers and beverage companies prioritize low-emission packaging solutions
- In April 2022, TORR Industries launched a new bag-in-box wine packaging machine designed for high-speed filling with minimal oxygen exposure, achieving less than 2 ppm total oxygen in the bag and a capacity of 20 three-liter bags per minute. This innovation enhances product quality and shelf life, directly supporting adoption of high-precision filling machines in the North America market. It also encourages competition in aseptic processing technologies, pushing manufacturers toward higher automation and improved production efficiency
SKU-

- Interactive Data Analysis Dashboard
- Company Analysis Dashboard for high growth potential opportunities
- Research Analyst Access for customization & queries
- Competitor Analysis with Interactive dashboard
- Latest News, Updates & Trend analysis
- Harness the Power of Benchmark Analysis for Comprehensive Competitor Tracking
North America Bag In Box Packaging Machine Market, Supply Chain Analysis and Ecosystem Framework
To support market growth and help clients navigate the impact of geopolitical shifts, DBMR has integrated in-depth supply chain analysis into its North America Bag In Box Packaging Machine Market research reports. This addition empowers clients to respond effectively to global changes affecting their industries. The supply chain analysis section includes detailed insights such as North America Bag In Box Packaging Machine Market consumption and production by country, price trend analysis, the impact of tariffs and geopolitical developments, and import and export trends by country and HSN code. It also highlights major suppliers with data on production capacity and company profiles, as well as key importers and exporters. In addition to research, DBMR offers specialized supply chain consulting services backed by over a decade of experience, providing solutions like supplier discovery, supplier risk assessment, price trend analysis, impact evaluation of inflation and trade route changes, and comprehensive market trend analysis.
Data collection and base year analysis are done using data collection modules with large sample sizes. The stage includes obtaining market information or related data through various sources and strategies. It includes examining and planning all the data acquired from the past in advance. It likewise envelops the examination of information inconsistencies seen across different information sources. The market data is analysed and estimated using market statistical and coherent models. Also, market share analysis and key trend analysis are the major success factors in the market report. To know more, please request an analyst call or drop down your inquiry.
The key research methodology used by DBMR research team is data triangulation which involves data mining, analysis of the impact of data variables on the market and primary (industry expert) validation. Data models include Vendor Positioning Grid, Market Time Line Analysis, Market Overview and Guide, Company Positioning Grid, Patent Analysis, Pricing Analysis, Company Market Share Analysis, Standards of Measurement, Global versus Regional and Vendor Share Analysis. To know more about the research methodology, drop in an inquiry to speak to our industry experts.
Data Bridge Market Research is a leader in advanced formative research. We take pride in servicing our existing and new customers with data and analysis that match and suits their goal. The report can be customized to include price trend analysis of target brands understanding the market for additional countries (ask for the list of countries), clinical trial results data, literature review, refurbished market and product base analysis. Market analysis of target competitors can be analyzed from technology-based analysis to market portfolio strategies. We can add as many competitors that you require data about in the format and data style you are looking for. Our team of analysts can also provide you data in crude raw excel files pivot tables (Fact book) or can assist you in creating presentations from the data sets available in the report.


