
North America Bee Products Market
Market Size in USD Billion
 USD
3.19 Billion
USD
6.14 Billion
2024
2032
USD
3.19 Billion
USD
6.14 Billion
2024
2032
| 2025 - 2032 | |
| USD 3.19 Billion | |
| USD 6.14 Billion | |
| % | |
|
North America Bee Products Market Size
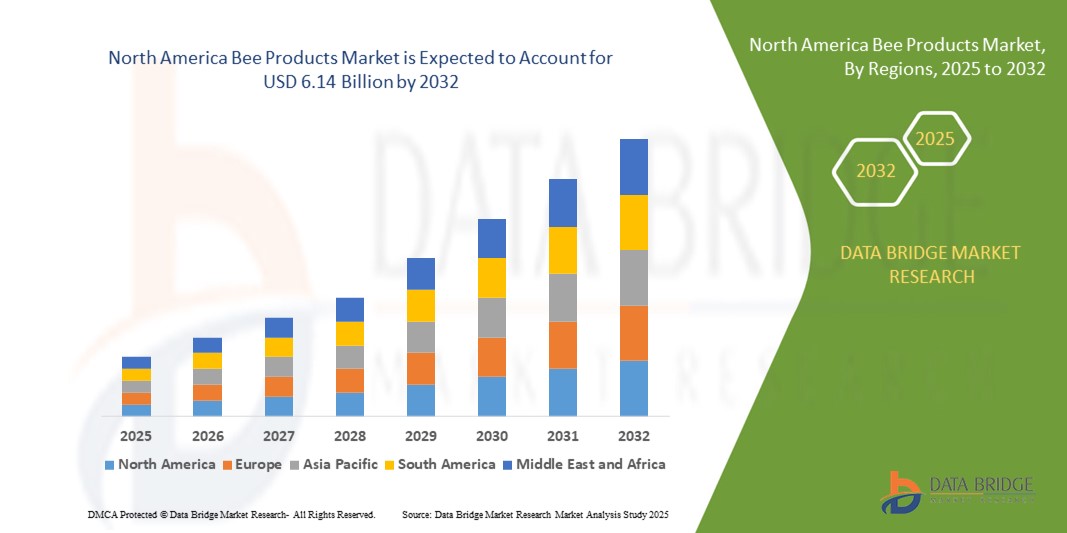
- The North America bee products market size was valued at USD 3.19 billion in 2024 and is expected to reach USD 6.14 billion by 2032, at a CAGR of 8.53% during the forecast period
- The market growth is largely fuelled by the rising demand for natural health supplements, increased awareness of the medicinal benefits of bee-derived products, and the expanding use of honey, propolis, and royal jelly in functional foods, cosmetics, and pharmaceuticals
- Growth is also supported by the increasing popularity of apitherapy and growing consumer interest in immunity-boosting and anti-aging products derived from natural sources
North America Bee Products Market Analysis
- The North America bee products market is witnessing steady growth due to increased consumer preference for clean-label and natural ingredients. Products such as honey, bee pollen, royal jelly, and beeswax are gaining traction for their antioxidant, antibacterial, and anti-inflammatory properties
- The rise of organic farming, growth of the wellness industry, and incorporation of bee products into sports nutrition and skincare formulations are further propelling market expansion. As sustainability and environmental awareness increase, demand for ethically sourced and traceable bee products is expected to rise
- U.S. bee products market accounted for the largest share in North America in 2024, driven by growing demand for natural alternatives to conventional medicines and increasing awareness of bee-based functional ingredients
- Canada is expected to witness the highest compound annual growth rate (CAGR) in the North America bee products market due to increasing awareness of the health benefits of bee-derived products, supportive government initiatives for sustainable beekeeping, and rising export opportunities
- The honey segment held the largest market revenue share in 2024, driven by its widespread use in food and beverages, natural medicine, and skincare. Its positioning as a natural sweetener and immune booster has significantly contributed to its growing consumption across both developed and developing countries. Honey’s multifunctional properties make it a staple in household kitchens, wellness products, and therapeutic applications, sustaining its market dominance
Report Scope and North America Bee Products Market Segmentation
|
Attributes |
North America Bee Products Key Market Insights |
|
Segments Covered |
|
|
Countries Covered |
North America
|
|
Key Market Players |
• Nature Nate's Honey Co. (U.S.) • Savannah Bee Company (U.S.) |
|
Market Opportunities |
• Expansion of Bee Products in Sports Nutrition and Functional Beverages |
|
Value Added Data Infosets |
In addition to the insights on market scenarios such as market value, growth rate, segmentation, geographical coverage, and major players, the market reports curated by the Data Bridge Market Research also include in-depth expert analysis, pricing analysis, brand share analysis, consumer survey, demography analysis, supply chain analysis, value chain analysis, raw material/consumables overview, vendor selection criteria, PESTLE Analysis, Porter Analysis, and regulatory framework. |
North America Bee Products Market Trends
Increased Demand for Functional and Medicinal Bee Products
- The growing consumer preference for natural and functional health solutions is reshaping the bee products market, with heightened interest in honey, royal jelly, propolis, and bee pollen due to their antioxidant, antibacterial, and immunity-boosting properties. These products are increasingly used in dietary supplements and natural remedies for preventive healthcare
- In both developed and emerging markets, bee-derived ingredients are being incorporated into nutraceuticals, personal care, and therapeutic formulations. The demand is further supported by the wellness movement and rising awareness around clean-label, chemical-free products that offer holistic benefits
- The rise of apitherapy using bee products for healing purposes is also driving innovation in the pharmaceutical and alternative medicine sectors. Consumers are turning to bee-based formulations for conditions such as inflammation, infections, and skin health, contributing to diversified product applications
- For instance, in 2023, several wellness brands in the U.S. launched propolis-based throat sprays and immunity tonics targeting seasonal illness prevention, gaining strong traction in health-conscious consumer segments
- While the market is expanding, success depends on sustained product standardization, traceability, and quality assurance. Companies must focus on ethical sourcing and transparent labeling to maintain consumer trust and meet growing demand for premium, functional bee products
North America Bee Products Market Dynamics
Driver
Growing Preference for Natural Health and Personal Care Products
• The shift toward chemical-free, nature-derived solutions is significantly boosting the adoption of bee products across food, cosmetic, and pharmaceutical sectors. Consumers are increasingly seeking products perceived as safe, effective, and sustainable, aligning with the natural origin and therapeutic value of bee ingredients such as honey, beeswax, and royal jelly
• In the beauty and personal care industry, beeswax and honey are being widely used in organic skincare, lip care, and hair products due to their hydrating, anti-inflammatory, and antimicrobial benefits. This trend is also evident in food supplements that incorporate propolis and pollen for immunity and vitality
• Regulatory support for traditional and natural medicine systems is further enhancing market reach. Growing inclusion of bee-based ingredients in approved product lists and functional food categories is enabling wider acceptance and distribution
• For instance, in 2022, several North American nutraceutical companies introduced propolis-infused capsules and oral sprays, responding to growing consumer demand for natural immunity boosters. These launches were supported by a rising preference for clean-label supplements and expanded retail distribution across pharmacies and wellness stores. This development reinforced propolis’ market presence as a mainstream health supplement in the region
• While natural preferences are propelling the market forward, ensuring authenticity and managing adulteration risks will be essential for long-term trust and sustainable growth
Restraint/Challenge
Threats from Colony Collapse and Environmental Instability
• One of the key restraints in the bee products market is the increasing threat of colony collapse disorder (CCD) and environmental degradation. The decline in bee populations due to pesticide use, habitat loss, and climate change significantly impacts raw material availability and the sustainability of bee-based supply chains
• Fluctuations in climatic conditions affect flowering cycles and nectar availability, which in turn reduce honey yields and disrupt apiary operations. This unpredictability limits consistent product quality and volume, posing challenges for manufacturers relying on stable supply for large-scale production
• Beekeepers, especially in developing regions, also face challenges related to disease management, pesticide exposure, and limited access to modern apiculture practices. These issues affect production capacity and constrain the ability to meet growing industrial and consumer demand
• For instance, in 2023, several North American apiary cooperatives reported sharp declines in honey output due to extreme drought conditions across parts of the U.S. and Canada. This environmental stress led to reduced nectar availability, directly affecting colony health and honey yields. The shortage placed pressure on organic and specialty honey supply chains, prompting increased imports and price volatility across retail and wholesale channels
• To mitigate these risks, stakeholders must invest in sustainable beekeeping practices, research into disease-resistant bee strains, and improved ecosystem conservation to safeguard long-term supply and market stability
North America Bee Products Market Scope
The market is segmented on the basis of type, nature, and distribution channel.
- By Type
On the basis of type, the North America bee products market is segmented into honey, beeswax, propolis, royal jelly, bee venom, and others. The honey segment held the largest market revenue share in 2024, driven by its widespread use in food and beverages, natural medicine, and skincare. Its positioning as a natural sweetener and immune booster has significantly contributed to its growing consumption across both developed and developing countries. Honey’s multifunctional properties make it a staple in household kitchens, wellness products, and therapeutic applications, sustaining its market dominance.
The propolis segment is expected to witness the fastest growth rate from 2025 to 2032, propelled by its increasing inclusion in nutraceuticals and personal care products. Its anti-inflammatory, antiviral, and antimicrobial benefits are driving strong demand among health-conscious consumers and wellness brands. The surge in functional product development, particularly immunity-boosting formulations and skincare items, is expected to accelerate propolis adoption across global markets.
- By Nature
On the basis of nature, the North America bee products market is segmented into organic and conventional. The conventional segment accounted for the largest market revenue share in 2024, owing to its widespread availability and lower price point compared to certified organic counterparts. Conventional bee products are predominantly sourced by mass-market food, pharmaceutical, and cosmetic manufacturers due to stable supply chains and cost-effectiveness.
The organic segment is expected to witness the fastest growth rate from 2025 to 2032, driven by growing consumer awareness regarding chemical-free products and sustainable sourcing. The demand for certified organic honey, beeswax, and royal jelly is increasing in health-conscious and eco-aware markets. Organic bee products are gaining significant traction in premium retail and direct-to-consumer channels as buyers increasingly seek traceable and ethically sourced ingredients.
- By Distribution Channel
On the basis of distribution channel, the North America bee products market is segmented into direct and indirect channels. The indirect segment dominated the market in 2024 due to the extensive reach of supermarkets, pharmacies, health food stores, and e-commerce platforms. These outlets ensure broad consumer access and contribute to high sales volumes, especially for packaged honey, propolis sprays, and bee-based supplements.
The direct segment is expected to witness the fastest growth rate from 2025 to 2032, led by the rising popularity of farm-to-consumer models and artisanal bee product brands. Beekeepers and specialty producers are increasingly leveraging direct sales through online platforms, farmers’ markets, and subscription models. This allows for greater product transparency, premium pricing, and stronger customer engagement, fueling growth within this segment.
North America Bee Products Market Regional Analysis
- U.S. bee products market accounted for the largest share in North America in 2024, driven by growing demand for natural alternatives to conventional medicines and increasing awareness of bee-based functional ingredients
- The country’s strong retail infrastructure and preference for organic-certified products have encouraged wide-scale adoption across nutraceuticals and personal care segments
- Consumer interest in sustainable sourcing and ethical beekeeping practices has also fueled product differentiation, with brands emphasizing traceability and purity
- Furthermore, strategic marketing campaigns and product innovations in flavored honey, bee pollen-infused supplements, and skincare lines continue to expand market opportunities in the U.S.
Canada Bee Products Market Insight
The Canada bee products market is expected to witness the fastest growth rate from 2025 to 2032, supported by increasing consumer inclination toward organic, natural, and locally sourced health products. Canadian consumers are embracing honey, propolis, and royal jelly as part of their daily wellness routines, particularly for immune health and skincare benefits. The country’s robust agricultural sector, combined with a strong beekeeping tradition, promotes domestic production and supply of high-quality bee products. In addition, growing demand for clean-label and sustainable goods is encouraging local brands to offer minimally processed and ethically sourced options. Supportive government regulations and rising export potential to the U.S. and European markets further strengthen Canada’s position in the global bee products value chain.
North America Bee Products Market Share
The North America Bee Products industry is primarily led by well-established companies, including:
• Nature Nate's Honey Co. (U.S.)
• Bee Maid Honey Limited (Canada)
• Comvita USA (U.S.)
• Beeyond the Hive (U.S.)
• Dutch Gold Honey (U.S.)
• Savannah Bee Company (U.S.)
• Really Raw Honey (U.S.)
• Wedderspoon Organic (U.S.)
• Crockett Honey Co. (U.S.)
• GloryBee (U.S.)
SKU-

- Interactive Data Analysis Dashboard
- Company Analysis Dashboard for high growth potential opportunities
- Research Analyst Access for customization & queries
- Competitor Analysis with Interactive dashboard
- Latest News, Updates & Trend analysis
- Harness the Power of Benchmark Analysis for Comprehensive Competitor Tracking
North America Bee Products Market, Supply Chain Analysis and Ecosystem Framework
To support market growth and help clients navigate the impact of geopolitical shifts, DBMR has integrated in-depth supply chain analysis into its North America Bee Products Market research reports. This addition empowers clients to respond effectively to global changes affecting their industries. The supply chain analysis section includes detailed insights such as North America Bee Products Market consumption and production by country, price trend analysis, the impact of tariffs and geopolitical developments, and import and export trends by country and HSN code. It also highlights major suppliers with data on production capacity and company profiles, as well as key importers and exporters. In addition to research, DBMR offers specialized supply chain consulting services backed by over a decade of experience, providing solutions like supplier discovery, supplier risk assessment, price trend analysis, impact evaluation of inflation and trade route changes, and comprehensive market trend analysis.
Data collection and base year analysis are done using data collection modules with large sample sizes. The stage includes obtaining market information or related data through various sources and strategies. It includes examining and planning all the data acquired from the past in advance. It likewise envelops the examination of information inconsistencies seen across different information sources. The market data is analysed and estimated using market statistical and coherent models. Also, market share analysis and key trend analysis are the major success factors in the market report. To know more, please request an analyst call or drop down your inquiry.
The key research methodology used by DBMR research team is data triangulation which involves data mining, analysis of the impact of data variables on the market and primary (industry expert) validation. Data models include Vendor Positioning Grid, Market Time Line Analysis, Market Overview and Guide, Company Positioning Grid, Patent Analysis, Pricing Analysis, Company Market Share Analysis, Standards of Measurement, Global versus Regional and Vendor Share Analysis. To know more about the research methodology, drop in an inquiry to speak to our industry experts.
Data Bridge Market Research is a leader in advanced formative research. We take pride in servicing our existing and new customers with data and analysis that match and suits their goal. The report can be customized to include price trend analysis of target brands understanding the market for additional countries (ask for the list of countries), clinical trial results data, literature review, refurbished market and product base analysis. Market analysis of target competitors can be analyzed from technology-based analysis to market portfolio strategies. We can add as many competitors that you require data about in the format and data style you are looking for. Our team of analysts can also provide you data in crude raw excel files pivot tables (Fact book) or can assist you in creating presentations from the data sets available in the report.


