
North America Biochar Market
Market Size in USD Million
 USD
727.31 Million
USD
3,790.06 Million
2024
2032
USD
727.31 Million
USD
3,790.06 Million
2024
2032
| 2025 - 2032 | |
| USD 727.31 Million | |
| USD 3,790.06 Million | |
| % | |
Biochar Market Analysis
The biochar market is experiencing significant growth, driven by increasing awareness of its environmental benefits and its role in sustainable agriculture. Biochar, a form of charcoal produced by pyrolyzing organic material, enhances soil fertility, reduces greenhouse gas emissions, and helps with waste management. The market is fueled by demand in agriculture, where biochar is used to improve soil quality and boost crop yields. In addition, biochar is gaining traction in carbon sequestration efforts, as it stores carbon for long periods. Government initiatives supporting climate change mitigation and rising interest in renewable energy further contribute to the market's expansion.
Biochar Market Size
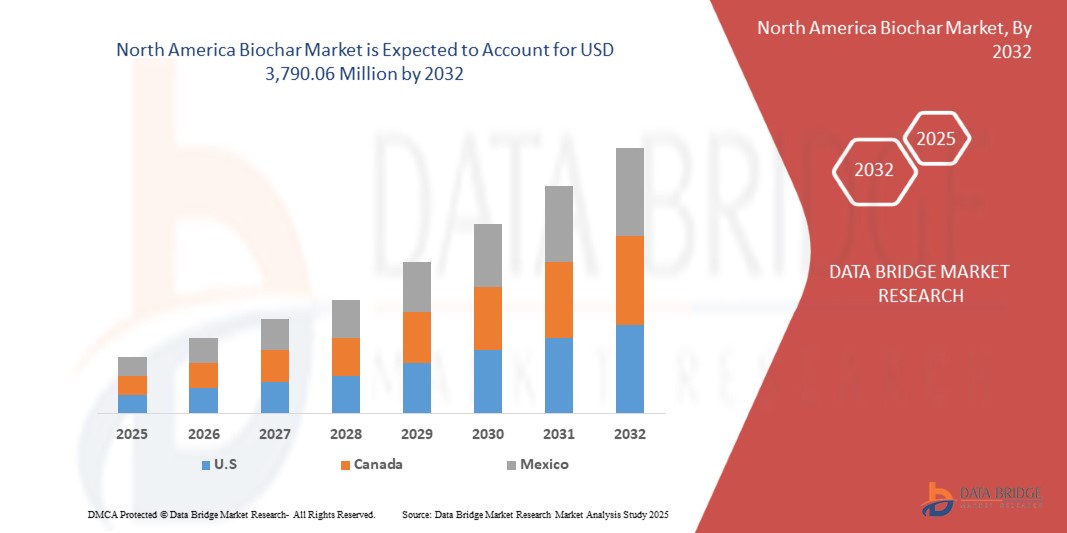
North America biochar market is expected to reach USD 3,790.06 million by 2032 from USD 727.31 million in 2024, growing with a substantial CAGR of 23.2% in the forecast period of 2025 to 2032. In addition to the insights on market scenarios such as market value, growth rate, segmentation, geographical coverage, and major players, the market reports curated by the Data Bridge Market Research also include import export analysis, production capacity overview, production consumption analysis, price trend analysis, climate change scenario, supply chain analysis, value chain analysis, raw material/consumables overview, vendor selection criteria, PESTLE Analysis, Porter Analysis, and regulatory framework.
Biochar Market Trends
“Increasing Awareness of its Environmental Benefits”
Increasing awareness of biochar's environmental benefits is driving its adoption North Americaly. Biochar, produced by pyrolyzing organic waste, helps reduce carbon emissions by sequestering carbon in the soil for long periods. It also improves soil health, enhancing fertility and water retention, which supports sustainable agriculture. Furthermore, biochar aids in waste management by converting agricultural residues into a valuable product. As awareness grows, more industries and farmers are recognizing its potential to mitigate climate change, improve food security, and promote sustainable farming practices. Educational campaigns and government initiatives are helping accelerate the adoption of biochar as an eco-friendly solution.
Report Scope and Market Segmentation
|
Attributes |
Biochar Ingredients Key Market Insights |
|
Segments Covered |
|
|
Countries Covered |
U.S., Canada, and Mexico |
|
Key Market Players |
Pacific Coast Carbon,LLC (U.S.), Standard Biocarbon Corporation (Canada), Genesis Enterprises, Inc (U.S.), WAKEFIELD BIOCHAR (U.S.), Black Owl Biochar (U.S.),Terra Char (U.S.), American BioChar Company (U.S.), Bioforcetech Corp. (Canada), Green Man Char (Canada), ARTi (Netherlands), and Zhengzhou kelin water purification material co.,ltd (China) |
|
Market Opportunities |
|
|
Value Added Data Infosets |
In addition to the insights on market scenarios such as market value, growth rate, segmentation, geographical coverage, and major players, the market reports curated by the Data Bridge Market Research also include import export analysis, production capacity overview, production consumption analysis, price trend analysis, climate change scenario, supply chain analysis, value chain analysis, raw material/consumables overview, vendor selection criteria, PESTLE Analysis, Porter Analysis, and regulatory framework. |
Biochar Market Definition
Biochar is a form of charcoal produced by heating organic material, such as agricultural waste, in the absence of oxygen through a process called pyrolysis. This results in a stable, carbon-rich substance that can be used to improve soil quality, enhance crop yields, and sequester carbon. Biochar is valued for its ability to retain nutrients, improve water retention, and reduce soil acidity, making it beneficial for sustainable agriculture. Additionally, it helps mitigate climate change by storing carbon in the soil for long periods, preventing the release of carbon dioxide into the atmosphere. Biochar also aids in waste management.
Biochar Market Dynamics
Drivers
- Rising Demand For Sustainable Agricultural Practices
The rising demand for sustainable agricultural practices is a key driver behind the growing adoption of biochar in agriculture. As the North America population increases and the effects of climate change intensify, there is an urgent need for farming practices that can improve crop yields, enhance soil health, and reduce environmental impact. Traditional farming methods often rely heavily on chemical fertilizers and intensive irrigation, leading to soil degradation, reduced biodiversity, and higher greenhouse gas emissions. In contrast, biochar offers a promising alternative by promoting long-term soil fertility while addressing several environmental concerns.
Biochar, a stable form of carbon produced by heating organic material in a low-oxygen environment (pyrolysis), has shown multiple benefits for agricultural soils. When applied to soil, biochar enhances its structure, improves water retention, and increases nutrient availability. This results in healthier crops and reduced need for synthetic fertilizers, which are costly and contribute to soil acidification and pollution. Moreover, biochar can sequester carbon in the soil for centuries, mitigating the effects of greenhouse gas emissions.
The growing awareness of the environmental and economic benefits of biochar has spurred its adoption in sustainable farming practices. Governments, environmental organizations, and agricultural stakeholders are increasingly promoting biochar as a tool for climate-smart agriculture. Additionally, biochar production from agricultural and forestry waste offers a value-added solution to waste management, making it a versatile and circular solution for farmers. The increasing demand for organic and eco-friendly food products further reinforces the market potential for biochar in agriculture, as it aligns with consumers' preferences for sustainably grown food. Consequently, biochar is becoming an essential component of modern, sustainable farming systems aimed at boosting productivity while minimizing ecological footprints.
- Government Policies Promoting Carbon Sequestration and Climate Mitigation
Government policies promoting carbon sequestration and climate mitigation play a crucial role in the growth of the biochar market. As nations increasingly recognize the urgency of addressing climate change, there is a strong push for policies that incentivize carbon capture and reduce greenhouse gas emissions. Biochar, a key carbon sequestration method, fits squarely into these efforts due to its ability to store carbon in the soil for long periods, potentially offsetting a significant portion of North America CO2 emissions.
Governments around the world have begun to incorporate carbon sequestration strategies into their climate action plans, with biochar often featured as a promising solution. For example, in the European Union and the United States, policies that promote sustainable agricultural practices and carbon storage through soil amendments are gaining traction. These policies may include tax incentives, grants, and subsidies for farmers and landowners who adopt carbon sequestration technologies such as biochar application.
In addition to financial incentives, carbon pricing mechanisms, such as carbon taxes or cap-and-trade systems, encourage industries to reduce their carbon footprints. By assigning a cost to carbon emissions, these policies indirectly create demand for carbon removal technologies like biochar, which can be used to offset emissions and earn carbon credits. This has led to the development of carbon markets where biochar producers can potentially generate revenue by selling carbon credits, further supporting the economic viability of biochar production.
International climate agreements, such as the Paris Agreement, have also set ambitious targets for reducing North America emissions, prompting governments to explore and fund innovative solutions for carbon capture. As these policies evolve, the biochar market is expected to benefit from increased research funding, regulatory support, and a growing emphasis on climate mitigation strategies.
Opportunities
- Expanding Agricultural Applications For Improved Soil Fertility And Productivity
The expanding agricultural applications for biochar to improve soil fertility and productivity are significant drivers of growth for the North America biochar market. As farmers and agricultural businesses face challenges related to soil degradation, declining fertility, and environmental sustainability, biochar has emerged as a highly effective, eco-friendly solution. Biochar, when added to soil, helps enhance its structure and nutrient content. The porous nature of biochar increases the soil’s water retention capacity, making it particularly beneficial in regions with arid or water-scarce conditions. This enhanced water retention also helps mitigate drought effects, improving crop yields during dry periods. Furthermore, biochar acts as a reservoir for nutrients like nitrogen, phosphorus, and potassium, which are essential for plant growth. By improving nutrient retention, biochar reduces the need for chemical fertilizers, which can be both costly and harmful to the environment.
Biochar’s alkaline nature can also help neutralize acidic soils, improving the availability of nutrients and creating a more favorable environment for plant growth. This makes it especially useful for soils that are overly acidic due to heavy rainfall or overuse of synthetic fertilizers. As a soil amendment, biochar has been shown to improve crop productivity by increasing nutrient cycling, microbial activity, and root development. The increased microbial activity helps break down organic matter and release nutrients more efficiently, ensuring plants have access to a balanced supply of nutrients. Additionally, biochar’s impact on soil structure encourages deeper root penetration, allowing plants to access nutrients and water from a larger volume of soil.
In agriculture, the growing focus on sustainability and carbon sequestration has also driven biochar’s adoption. Biochar acts as a carbon sink, storing carbon in the soil for hundreds to thousands of years, thus contributing to climate change mitigation. This dual benefit—improving soil fertility while sequestering carbon—aligns with North America efforts to reduce greenhouse gas emissions.
- Innovations In Biochar Applications
Beyond its well-known agricultural applications, biochar is increasingly being recognized for its diverse potential in various industries, driving the growth of the North America biochar market. These innovations extend biochar’s benefits into environmental remediation, energy production, water treatment, and even construction materials, positioning it as a versatile and sustainable solution to pressing North America challenges. Biochar’s high surface area and porous structure make it an excellent adsorbent for pollutants. It has been successfully used in the treatment of wastewater, removing heavy metals, organic compounds, and toxins. Biochar's ability to trap harmful chemicals and improve water quality has led to its adoption in both industrial and municipal wastewater treatment facilities, helping mitigate water contamination issues.
Biochar's carbon-rich composition makes it an effective tool for long-term carbon storage. As a stable form of carbon, biochar can sequester carbon in soils for hundreds or even thousands of years, contributing to climate change mitigation efforts. This has increased its appeal in carbon credit markets, where it can be used to offset greenhouse gas emissions, thus driving investment in biochar production. Biochar can be integrated into bioenergy systems, particularly in the form of biochar pellets or briquettes for heat generation. When produced through pyrolysis, biochar itself can be used as a renewable energy source for heating or electricity generation, offering an alternative to fossil fuels. It also improves the energy efficiency of biomass combustion by reducing smoke emissions, making biochar-based fuels cleaner than traditional wood or coal.
Recent innovations have explored using biochar as an additive in concrete, bricks, and other construction materials. Incorporating biochar into these materials can enhance their insulation properties, reduce their carbon footprint, and improve their overall strength. The use of biochar in construction supports the trend towards sustainable building practices and green construction technologies.
Restraints/Challenges
- Limited Awareness and Education on Biochar Benefits
Limited awareness and education about biochar's benefits are significant challenges hindering its widespread adoption across various sectors, including agriculture, environmental management, and climate change mitigation. Despite its potential to improve soil health, sequester carbon, and reduce waste, many stakeholders—such as farmers, landowners, policymakers, and the general public—remain unfamiliar with biochar or its advantages. This lack of awareness can slow the transition to more sustainable practices and prevent biochar from reaching its full potential.
In the agricultural sector, biochar is recognized for its ability to enhance soil fertility, improve water retention, and increase crop yields, particularly in nutrient-poor or degraded soils. However, many farmers are unaware of its potential benefits and may be hesitant to adopt biochar due to unfamiliarity or concerns about its effectiveness. The lack of information about proper application methods and the long-term advantages of biochar often results in a reluctance to invest in its use, especially given the financial constraints faced by smallholders and rural communities.
Similarly, policymakers and environmental professionals may not fully understand the role biochar can play in carbon sequestration. Biochar’s ability to lock carbon in a stable form for hundreds to thousands of years presents a cost-effective means of mitigating climate change, but this message has not been widely communicated or integrated into national and international climate policies. As a result, biochar is often overlooked in favor of other carbon removal technologies.
To address these challenges, increased education and outreach are essential. This can include training programs, workshops, and informational campaigns targeted at farmers, environmentalists, policymakers, and the public. Universities, research institutions, and industry groups can collaborate to conduct studies and share data that demonstrate the effectiveness of biochar. Raising awareness and educating stakeholders about the long-term economic and environmental benefits of biochar will be critical to its broader adoption.
- Lack of standardization and quality control in biochar production processes
The lack of standardization and quality control in biochar production processes presents a significant challenge to the North America biochar market. Biochar, a form of charcoal produced through the pyrolysis of organic materials, has gained attention for its potential in carbon sequestration, soil enhancement, and waste management. However, the variability in production methods and the absence of uniform quality standards hinder its widespread adoption and market growth.
One of the key issues is the diversity of feedstocks used to produce biochar. Different organic materials, such as agricultural waste, forestry residues, and even municipal waste, result in biochar with varying chemical properties, physical characteristics, and effectiveness in applications. This inconsistency complicates the ability to evaluate and compare the performance of biochar products, especially in critical sectors like agriculture, where biochar’s soil health benefits are highly dependent on its composition.
Without clear industry standards, producers may prioritize cost-efficiency over quality, leading to biochar that fails to meet the expected performance for specific uses, such as soil amendment or carbon sequestration. Additionally, the lack of standardized testing methods and certifications makes it difficult for consumers to assess the quality and environmental impact of biochar products. This uncertainty undermines consumer confidence and limits large-scale investments. The absence of regulatory frameworks also complicates the scaling of biochar as a climate change mitigation tool. Governments and environmental agencies require standardized metrics to evaluate the carbon sequestration potential of biochar, ensuring that it can be integrated into carbon credit programs or sustainability initiatives. Without these frameworks, biochar production remains fragmented, impeding the market’s growth and its contribution to North America sustainability efforts.
Impact and Current Market Scenario of Raw Material Shortage and Shipping Delays
Data Bridge Market Research offers a high-level analysis of the market and delivers information by keeping in account the impact and current market environment of raw material shortage and shipping delays. This translates into assessing strategic possibilities, creating effective action plans, and assisting businesses in making important decisions.
Apart from the standard report, we also offer in-depth analysis of the procurement level from forecasted shipping delays, distributor mapping by region, commodity analysis, production analysis, price mapping trends, sourcing, category performance analysis, supply chain risk management solutions, advanced benchmarking, and other services for procurement and strategic support.
Expected Impact of Economic Slowdown on the Pricing and Availability of Products
When economic activity slows, industries begin to suffer. The forecasted effects of the economic downturn on the pricing and accessibility of the products are taken into account in the market insight reports and intelligence services provided by DBMR. With this, our clients can typically keep one step ahead of their competitors, project their sales and revenue, and estimate their profit and loss expenditures.
North America Biochar Market Scope
The market is segmented on the basis of technology, feedstock, end use. The growth amongst these segments will help you analyze meagre growth segments in the industries and provide the users with a valuable market overview and market insights to help them make strategic decisions for identifying core market applications.
Technology
- Pyrolysis
- Gasification
- Hydrothermal Carbonization
Feedstock
- Agricultural Residues
- Forestry and Wood Waste
- Animal Manure
- Biomass Plantation
- Others
End Use
- Soil Conditioner
- Animal Farming
- Electricity Generation
- Heat Generation
- Water Treatment
- Building
- Household
- Textiles
- Others
North America Biochar Market Regional Analysis
The market is analyzed and market size insights and trends are provided by country, technology, feedstock, and end use as referenced above.
The countries covered in the market are U.S., Canada, and Mexico.
U.S. dominates the North America Biochar Market due to strong environmental regulations, government incentives, advanced agricultural practices, and growing awareness of biochar's benefits in carbon sequestration and sustainable farming.
Canada is emerging in the North America Biochar Market due to increasing agricultural demand, government support for sustainable farming, rising environmental awareness, and the need for waste management solutions in rapidly growing economies.
The country section of the report also provides individual market impacting factors and changes in regulation in the market domestically that impacts the current and future trends of the market. Data points like down-stream and upstream value chain analysis, technical trends and porter's five forces analysis, case studies are some of the pointers used to forecast the market scenario for individual countries. Also, the presence and availability of North America brands and their challenges faced due to large or scarce competition from local and domestic brands, impact of domestic tariffs and trade routes are considered while providing forecast analysis of the country data.
North America Biochar Market Share
The market competitive landscape provides details by competitors. Details included are company overview, company financials, revenue generated, market potential, investment in research and development, new market initiatives, North America presence, production sites and facilities, production capacities, company strengths and weaknesses, product launch, product width and breadth, application dominance. The above data points provided are only related to the companies' focus related to market.
North America Biochar Market Leaders Operating in the Market Are:
- Pacific Coast Carbon,LLC (U.S.)
- Standard Biocarbon Corporation (Canada)
- Genesis Enterprises, Inc (U.S.),
- WAKEFIELD BIOCHAR (U.S.)
- Black Owl Biochar (U.S.)
- Terra Char (U.S.),
- American BioChar Company (U.S.)
- Bioforcetech Corp. (Canada)
- Green Man Char (Canada)
- ARTi (Netherlands)
- Zhengzhou kelin water purification material co.,ltd (China)
SKU-

- Interactive Data Analysis Dashboard
- Company Analysis Dashboard for high growth potential opportunities
- Research Analyst Access for customization & queries
- Competitor Analysis with Interactive dashboard
- Latest News, Updates & Trend analysis
- Harness the Power of Benchmark Analysis for Comprehensive Competitor Tracking
Table of Content
1 INTRODUCTION
1.1 OBJECTIVES OF THE STUDY
1.2 MARKET DEFINITION
1.3 OVERVIEW
1.4 LIMITATIONS
1.5 MARKETS COVERED
2 MARKET SEGMENTATION
2.1 MARKETS COVERED
2.2 GEOGRAPHICAL SCOPE
2.3 YEARS CONSIDERED FOR THE STUDY
2.4 CURRENCY AND PRICING
2.5 DBMR TRIPOD DATA VALIDATION MODEL
2.6 MULTIVARIATE MODELING
2.7 PRIMARY INTERVIEWS WITH KEY OPINION LEADERS
2.8 DBMR MARKET POSITION GRID
2.9 MARKET APPLICATION COVERAGE GRID
2.1 DBMR VENDOR SHARE ANALYSIS
2.11 SECONDARY SOURCES
2.12 ASSUMPTIONS
3 EXECUTIVE SUMMARY
4 PREMIUM INSIGHTS
4.1 PESTEL ANALYSIS
4.1.1 POLITICAL FACTORS
4.1.2 ECONOMIC FACTORS
4.1.3 SOCIAL FACTORS
4.1.4 TECHNOLOGICAL FACTORS
4.1.5 ENVIRONMENTAL FACTORS
4.1.6 LEGAL FACTORS
4.2 PORTER’S FIVE FORCES ANALYSIS
4.2.1 THREAT OF NEW ENTRANTS
4.2.2 BARGAINING POWER OF SUPPLIERS
4.2.3 BARGAINING POWER OF BUYERS
4.2.4 THREAT OF SUBSTITUTES
4.2.5 INTERNAL COMPETITION
4.3 CLIMATE CHANGE SCENARIO
4.3.1 CARBON SEQUESTRATION AND CLIMATE MITIGATION
4.3.2 SOIL HEALTH AND AGRICULTURAL RESILIENCE
4.3.3 NORTH AMERICA MARKET GROWTH
4.4 PRODUCTION AND CONSUMPTION IN NORTH AMERICA BIOCHAR MARKET
4.5 RAW MATERIAL COVERAGE
4.5.1 AGRICULTURAL RESIDUES
4.5.2 ANIMAL MANURE
4.5.3 MUNICIPAL SOLID WASTE (MSW) AND OTHER ORGANIC WASTES
4.5.4 OTHER EMERGING FEEDSTOCKS
4.5.5 CONCLUSION
4.6 SUPPLY CHAIN ANALYSIS
4.6.1 OVERVIEW
4.6.2 LOGISTIC COST SCENARIO
4.6.3 IMPORTANCE OF LOGISTICS SERVICE PROVIDERS
4.7 TECHNOLOGICAL ADVANCEMENTS BY MANUFACTURERS
4.7.1 IMPROVED PYROLYSIS TECHNOLOGIES
4.7.2 OPTIMIZATION OF FEEDSTOCKS
4.7.3 DEVELOPMENT OF HIGH-QUALITY BIOCHAR
4.7.4 ENHANCED APPLICATIONS IN AGRICULTURE
4.7.5 CARBON CAPTURE AND ENVIRONMENTAL REMEDIATION
4.7.6 CONCLUSION
4.8 VENDOR SELECTION CRITERIA
4.8.1 PRODUCT QUALITY AND CONSISTENCY
4.8.2 PRODUCTION TECHNOLOGY AND INNOVATION
4.8.3 SUSTAINABILITY AND ENVIRONMENTAL IMPACT
4.8.4 COST-EFFECTIVENESS AND PRICING STRUCTURE
4.8.5 REPUTATION AND RELIABILITY
4.8.6 COMPLIANCE AND REGULATORY STANDARDS
4.8.7 CONCLUSION
5 REGULATION COVERAGE
5.1 CARBON SEQUESTRATION AND ENVIRONMENTAL REGULATIONS
5.2 AGRICULTURAL REGULATIONS
5.3 WASTE MANAGEMENT REGULATIONS
6 MARKET OVERVIEW
6.1 DRIVERS
6.1.1 RISING DEMAND FOR SUSTAINABLE AGRICULTURAL PRACTICES
6.1.2 GOVERNMENT POLICIES PROMOTING CARBON SEQUESTRATION AND CLIMATE MITIGATION
6.1.3 INCREASING AWARENESS OF BIOCHAR'S ENVIRONMENTAL AND ECONOMIC BENEFITS
6.1.4 ADVANCEMENTS IN BIOCHAR PRODUCTION TECHNOLOGY AND PROCESSES
6.2 RESTRAINTS
6.2.1 HIGH PRODUCTION COSTS LIMITING WIDESPREAD BIOCHAR ADOPTION
6.2.2 LIMITED AWARENESS AND EDUCATION ON BIOCHAR BENEFITS
6.3 OPPORTUNITIES
6.3.1 EXPANDING AGRICULTURAL APPLICATIONS FOR IMPROVED SOIL FERTILITY AND PRODUCTIVITY
6.3.2 INNOVATIONS IN BIOCHAR APPLICATIONS
6.3.3 SHIFTING FOCUS TOWARDS SUSTAINABLE WASTE MANAGEMENT SOLUTIONS NORTH AMERICA LY
6.4 CHALLENGES
6.4.1 LACK OF STANDARDIZATION AND QUALITY CONTROL IN BIOCHAR PRODUCTION PROCESSES
6.4.2 LIMITED INFRASTRUCTURE FOR LARGE-SCALE BIOCHAR PRODUCTION AND DISTRIBUTION
7 NORTH AMERICA BIOCHAR MARKET, BY TECHNOLOGY
7.1 OVERVIEW
7.2 PYROLYSIS
7.2.1 PYROLYSIS, BY PRODUCT TYPE
7.3 GASIFICATION
7.4 HYDROTHERMAL CARBONIZATION
8 NORTH AMERICA BIOCHAR MARKET, BY FEEDSTOCK
8.1 OVERVIEW
8.2 AGRICULTURAL RESIDUES
8.3 FORESTRY AND WOODWASTE
8.4 ANIMAL MANURE
8.5 BIOMASS PLANTATION
8.6 OTHERS
9 NORTH AMERICA BIOCHAR MARKET, BY END USE
9.1 OVERVIEW
9.2 SOIL CONDITIONER
9.2.1 SOIL CONDITIONER, BY APPLICATION
9.2.2 SOIL CONDITIONER, BY TECHNOLOGY
9.3 ANIMAL FARMING
9.4 ANIMAL FARMING, BY APPLICATION
9.4.1 ANIMAL FARMING, BY TECHNOLOGY
9.5 ELECTRICITY GENERATION
9.5.1 ELECTRICITY GENERATION, BY TECHNOLOGY
9.6 HEAT GENERATION
9.6.1 HEAT GENERATION, BY TECHNOLOGY
9.7 WATER-TREATMENT
9.7.1 WATER-TREATMENT, BY TECHNOLOGY
9.8 BUILDING
9.8.1 BUILDING, BY APPLICATION
9.8.2 BUILDING, BY TECHNOLOGY
9.9 HOUSEHOLD
9.9.1 HOUSEHOLD, BY TECHNOLOGY
9.1 TEXTILES
9.10.1 TEXTILES, BY TECHNOLOGY
9.11 OTHERS
9.12 OTHERS, BY TECHNOLOGY
10 NORTH AMERICA BIOCHAR MARKET, BY REGION
10.1 NORTH AMERICA
10.1.1 U.S
10.1.2 CANADA
10.1.3 MEXICO
11 BIOCHAR MARKET: COMPANY LANDSCAPE
11.1 COMPANY SHARE ANALYSIS: NORTH AMERICA
12 SWOT ANALYSIS
13 COMPANY PROFILES
13.1 BIOCHAR NOW
13.1.1 COMPANY SNAPSHOT
13.1.2 COMPANY SHARE ANALYSIS
13.1.3 PRODUCT PORTFOLIO
13.1.4 RECENT DEVELOPMENT
13.2 OREGON BIOCHAR SOLUTIONS
13.2.1 COMPANY SNAPSHOT
13.2.2 COMPANY SHARE ANALYSIS
13.2.3 PRODUCT PORTFOLIO
13.2.4 RECENT DEVELOPMENT
13.3 PACIFIC BIOCHAR BENEFIT CORPORATION
13.3.1 COMPANY SNAPSHOT
13.3.2 COMPANY SHARE ANALYSIS
13.3.3 PRODUCT PORTFOLIO
13.3.4 RECENT DEVELOPMENT
13.4 CARBON GOLD LTD
13.4.1 COMPANY SNAPSHOT
13.4.2 COMPANY SHARE ANALYSIS
13.4.3 PRODUCT PORTFOLIO
13.4.4 RECENT DEVELOPMENT
13.5 SWISS BIOCHAR
13.5.1 COMPANY SNAPSHOT
13.5.2 COMPANY SHARE ANALYSIS
13.5.3 PRODUCT PORTFOLIO
13.5.4 RECENT DEVELOPMENT
13.6 AMERICAN BIOCHAR COMPANY
13.6.1 COMPANY SNAPSHOT
13.6.2 PRODUCT PORTFOLIO
13.6.3 RECENT DEVELOPMENT
13.7 ARSTAECO.
13.7.1 COMPANY SNAPSHOT
13.7.2 PRODUCT PORTFOLIO
13.7.3 RECENT DEVELOPMENT
13.8 ARTI
13.8.1 COMPANY SNAPSHOT
13.8.2 PRODUCT PORTFOLIO
13.8.3 RECENT DEVELOPMENT
13.9 BIOFORCETECH CORP.
13.9.1 COMPANY SNAPSHOT
13.9.2 PRODUCT PORTFOLIO
13.9.3 RECENT DEVELOPMENT
13.1 BLACK OWL BIOCHAR.
13.10.1 COMPANY SNAPSHOT
13.10.2 PRODUCT PORTFOLIO
13.10.3 RECENT DEVELOPMENT
13.11 CARBONIS
13.11.1 COMPANY SNAPSHOT
13.11.2 PRODUCT PORTFOLIO
13.11.3 RECENT DEVELOPMENT
13.12 GENESIS ENTERPRISES, INC
13.12.1 COMPANY SNAPSHOT
13.12.2 PRODUCT PORTFOLIO
13.12.3 RECENT DEVELOPMENT
13.13 GREEN MAN CHAR
13.13.1 COMPANY SNAPSHOT
13.13.2 PRODUCT PORTFOLIO
13.13.3 RECENT DEVELOPMENT
13.14 MASH MAKES.
13.14.1 COMPANY SNAPSHOT
13.14.2 PRODUCT PORTFOLIO
13.14.3 RECENT DEVELOPMENT
13.15 PACIFIC COAST CARBON, LLC
13.15.1 COMPANY SNAPSHOT
13.15.2 PRODUCT PORTFOLIO
13.15.3 RECENT DEVELOPMENT
13.16 PYROPOWER
13.16.1 COMPANY SNAPSHOT
13.16.2 PRODUCT PORTFOLIO
13.16.3 RECENT DEVELOPMENT
13.17 STANDARD BIOCARBON CORPORATION
13.17.1 COMPANY SNAPSHOT
13.17.2 PRODUCT PORTFOLIO
13.17.3 RECENT DEVELOPMENT
13.18 TERRA CHAR
13.18.1 COMPANY SNAPSHOT
13.18.2 PRODUCT PORTFOLIO
13.18.3 RECENT DEVELOPMENT
13.19 WAKEFIELD BIOCHAR
13.19.1 COMPANY SNAPSHOT
13.19.2 PRODUCT PORTFOLIO
13.19.3 RECENT DEVELOPMENT
13.2 ZHENGZHOU KELIN WATER PURIFICATION MATERIAL CO.,LTD.
13.20.1 COMPANY SNAPSHOT
13.20.2 PRODUCT PORTFOLIO
13.20.3 RECENT DEVELOPMENT
14 QUESTIONNAIRE
15 RELATED REPORTS
List of Table
TABLE 1 REGULATIONS ACROSS VARIOUS REGIONS AND COUNTRIES
TABLE 2 NORTH AMERICA BIOCHAR MARKET, BY TECHNOLOGY, 2018-2032 (USD THOUSAND)
TABLE 3 NORTH AMERICA BIOCHAR MARKET, BY TECHNOLOGY, 2018-2032 (TONS)
TABLE 4 NORTH AMERICA BIOCHAR MARKET, BY TECHNOLOGY, 2018-2032 (PRICE (USD/KG)
TABLE 5 NORTH AMERICA PYROLYSIS IN BIOCHAR MARKET, BY REGION, 2018-2032 (USD THOUSAND)
TABLE 6 NORTH AMERICA PYROLYSIS IN BIOCHAR MARKET, BY TYPE, 2018-2032 (USD THOUSAND)
TABLE 7 NORTH AMERICA GASIFICATION IN BIOCHAR MARKET, BY REGION, 2018-2032 (USD THOUSAND)
TABLE 8 NORTH AMERICA HYDROTHERMAL CARBONIZATION IN BIOCHAR MARKET, BY REGION, 2018-2032 (USD THOUSAND)
TABLE 9 NORTH AMERICA BIOCHAR MARKET, BY FEEDSTOCK, 2018-2032 (USD THOUSAND)
TABLE 10 NORTH AMERICA AGRICULTURAL RESIDUES IN BIOCHAR MARKET, BY REGION, 2018-2032 (USD THOUSAND)
TABLE 11 NORTH AMERICA FORESTRY AND WOODWASTE IN BIOCHAR MARKET, BY REGION, 2018-2032 (USD THOUSAND)
TABLE 12 NORTH AMERICA ANIMAL MANURE IN BIOCHAR MARKET, BY REGION, 2018-2032 (USD THOUSAND)
TABLE 13 NORTH AMERICA BIOMASS PLANTATION IN BIOCHAR MARKET, BY REGION, 2018-2032 (USD THOUSAND)
TABLE 14 NORTH AMERICA OTHERS IN BIOCHAR MARKET, BY REGION, 2018-2032 (USD THOUSAND)
TABLE 15 NORTH AMERICA BIOCHAR MARKET, BY END USE, 2018-2032 (USD THOUSAND)
TABLE 16 NORTH AMERICA SOIL CONDITIONER IN BIOCHAR MARKET, BY REGION, 2018-2032 (USD THOUSAND)
TABLE 17 NORTH AMERICA SOIL CONDITIONER IN BIOCHAR MARKET, BY APPLICATION, 2018-2032 (USD THOUSAND)
TABLE 18 NORTH AMERICA SOIL CONDITIONER IN BIOCHAR MARKET, BY TECHNOLOGY, 2018-2032 (USD THOUSAND)
TABLE 19 NORTH AMERICA ANIMAL FARMING IN BIOCHAR MARKET, BY REGION, 2018-2032 (USD THOUSAND)
TABLE 20 NORTH AMERICA ANIMAL FARMING IN BIOCHAR MARKET, BY APPLICATION, 2018-2032 (USD THOUSAND)
TABLE 21 NORTH AMERICA SOIL CONDITIONER IN BIOCHAR MARKET, BY TECHNOLOGY, 2018-2032 (USD THOUSAND)
TABLE 22 NORTH AMERICA ELECTRICITY GENERATION IN BIOCHAR MARKET, BY REGION, 2018-2032 (USD THOUSAND)
TABLE 23 NORTH AMERICA ELECTRICITY GENERATION IN BIOCHAR MARKET, BY TECHNOLOGY, 2018-2032 (USD THOUSAND)
TABLE 24 NORTH AMERICA HEAT GENERATION IN BIOCHAR MARKET, BY REGION, 2018-2032 (USD THOUSAND)
TABLE 25 NORTH AMERICA HEAT GENERATION IN BIOCHAR MARKET, BY TECHNOLOGY, 2018-2032 (USD THOUSAND)
TABLE 26 NORTH AMERICA WATER-TREATMENT IN BIOCHAR MARKET, BY REGION, 2018-2032 (USD THOUSAND)
TABLE 27 NORTH AMERICA WATER-TREATMENT IN BIOCHAR MARKET, BY TECHNOLOGY, 2018-2032 (USD THOUSAND)
TABLE 28 NORTH AMERICA BUILDING IN BIOCHAR MARKET, BY REGION, 2018-2032 (USD THOUSAND)
TABLE 29 NORTH AMERICA BUILDING IN BIOCHAR MARKET, BY APPLICATION, 2018-2032 (USD THOUSAND)
TABLE 30 NORTH AMERICA BUILDING IN BIOCHAR MARKET, BY TECHNOLOGY, 2018-2032 (USD THOUSAND)
TABLE 31 NORTH AMERICA HOUSEHOLD IN BIOCHAR MARKET, BY REGION, 2018-2032 (USD THOUSAND)
TABLE 32 NORTH AMERICA HOUSEHOLD IN BIOCHAR MARKET, BY TECHNOLOGY, 2018-2032 (USD THOUSAND)
TABLE 33 NORTH AMERICA TEXTILES IN BIOCHAR MARKET, BY REGION, 2018-2032 (USD THOUSAND)
TABLE 34 NORTH AMERICA TEXTILES IN BIOCHAR MARKET, BY TECHNOLOGY, 2018-2032 (USD THOUSAND)
TABLE 35 NORTH AMERICA OTHERS IN BIOCHAR MARKET, BY REGION, 2018-2032 (USD THOUSAND)
TABLE 36 NORTH AMERICA OTHERS IN BIOCHAR MARKET, BY TECHNOLOGY, 2018-2032 (USD THOUSAND)
TABLE 37 NORTH AMERICA BIOCHAR MARKET, BY COUNTRY, 2018-2032 (USD THOUSAND)
TABLE 38 NORTH AMERICA BIOCHAR MARKET, BY COUNTRY, 2018-2032 (TONS)
TABLE 39 NORTH AMERICA BIOCHAR MARKET, BY TECHNOLOGY, 2018-2032 (USD THOUSAND)
TABLE 40 NORTH AMERICA BIOCHAR MARKET, BY TECHNOLOGY, 2018-2032 (TONS)
TABLE 41 NORTH AMERICA PYROLYSIS IN BIOCHAR MARKET, BY PRODUCT TYPE, 2018-2032 (USD THOUSAND)
TABLE 42 NORTH AMERICA BIOCHAR MARKET, BY FEEDSTOCK, 2018-2032 (USD THOUSAND)
TABLE 43 NORTH AMERICA BIOCHAR MARKET, BY END USE, 2018-2032 (USD THOUSAND)
TABLE 44 NORTH AMERICA SOIL CONDITIONER IN BIOCHAR MARKET, BY APPLICATION, 2018-2032 (USD THOUSAND)
TABLE 45 NORTH AMERICA SOIL CONDITIONER IN BIOCHAR MARKET, BY TECHNOLOGY, 2018-2032 (USD THOUSAND)
TABLE 46 NORTH AMERICA ANIMAL FARMING IN BIOCHAR MARKET, BY APPLICATION, 2018-2032 (USD THOUSAND)
TABLE 47 NORTH AMERICA ANIMAL FARMING IN BIOCHAR MARKET, BY TECHNOLOGY, 2018-2032 (USD THOUSAND)
TABLE 48 NORTH AMERICA ELECTRICITY GENERATION IN BIOCHAR MARKET, BY TECHNOLOGY, 2018-2032 (USD THOUSAND)
TABLE 49 NORTH AMERICA HEAT GENERATION IN BIOCHAR MARKET, BY TECHNOLOGY, 2018-2032 (USD THOUSAND)
TABLE 50 NORTH AMERICA WATER-TREATMENT IN BIOCHAR MARKET, BY TECHNOLOGY, 2018-2032 (USD THOUSAND)
TABLE 51 NORTH AMERICA BUILDING IN BIOCHAR MARKET, BY APPLICATION, 2018-2032 (USD THOUSAND)
TABLE 52 NORTH AMERICA BUILDING IN BIOCHAR MARKET, BY TECHNOLOGY, 2018-2032 (USD THOUSAND)
TABLE 53 NORTH AMERICA HOUSEHOLD IN BIOCHAR MARKET, BY TECHNOLOGY, 2018-2032 (USD THOUSAND)
TABLE 54 NORTH AMERICA TEXTILES IN BIOCHAR MARKET, BY TECHNOLOGY, 2018-2032 (USD THOUSAND)
TABLE 55 NORTH AMERICA OTHERS IN BIOCHAR MARKET, BY TECHNOLOGY, 2018-2032 (USD THOUSAND)
TABLE 56 U.S. BIOCHAR MARKET, BY TECHNOLOGY, 2018-2032 (USD THOUSAND)
TABLE 57 U.S. BIOCHAR MARKET, BY TECHNOLOGY, 2018-2032 (TONS)
TABLE 58 U.S. PYROLYSIS IN BIOCHAR MARKET, BY PRODUCT TYPE, 2018-2032 (USD THOUSAND)
TABLE 59 U.S. BIOCHAR MARKET, BY FEEDSTOCK, 2018-2032 (USD THOUSAND)
TABLE 60 U.S. BIOCHAR MARKET, BY END USE, 2018-2032 (USD THOUSAND)
TABLE 61 U.S. SOIL CONDITIONER IN BIOCHAR MARKET, BY APPLICATION, 2018-2032 (USD THOUSAND)
TABLE 62 U.S. SOIL CONDITIONER IN BIOCHAR MARKET, BY TECHNOLOGY, 2018-2032 (USD THOUSAND)
TABLE 63 U.S. ANIMAL FARMING IN BIOCHAR MARKET, BY APPLICATION, 2018-2032 (USD THOUSAND)
TABLE 64 U.S. ANIMAL FARMING IN BIOCHAR MARKET, BY TECHNOLOGY, 2018-2032 (USD THOUSAND)
TABLE 65 U.S. ELECTRICITY GENERATION IN BIOCHAR MARKET, BY TECHNOLOGY, 2018-2032 (USD THOUSAND)
TABLE 66 U.S. HEAT GENERATION IN BIOCHAR MARKET, BY TECHNOLOGY, 2018-2032 (USD THOUSAND)
TABLE 67 U.S. WATER-TREATMENT IN BIOCHAR MARKET, BY TECHNOLOGY, 2018-2032 (USD THOUSAND)
TABLE 68 U.S. BUILDING IN BIOCHAR MARKET, BY APPLICATION, 2018-2032 (USD THOUSAND)
TABLE 69 U.S. BUILDING IN BIOCHAR MARKET, BY TECHNOLOGY, 2018-2032 (USD THOUSAND)
TABLE 70 U.S. HOUSEHOLD IN BIOCHAR MARKET, BY TECHNOLOGY, 2018-2032 (USD THOUSAND)
TABLE 71 U.S. TEXTILES IN BIOCHAR MARKET, BY TECHNOLOGY, 2018-2032 (USD THOUSAND)
TABLE 72 U.S. OTHERS IN BIOCHAR MARKET, BY TECHNOLOGY, 2018-2032 (USD THOUSAND)
TABLE 73 CANADA BIOCHAR MARKET, BY TECHNOLOGY, 2018-2032 (USD THOUSAND)
TABLE 74 CANADA BIOCHAR MARKET, BY TECHNOLOGY, 2018-2032 (TONS)
TABLE 75 CANADA PYROLYSIS IN BIOCHAR MARKET, BY PRODUCT TYPE, 2018-2032 (USD THOUSAND)
TABLE 76 CANADA BIOCHAR MARKET, BY FEEDSTOCK, 2018-2032 (USD THOUSAND)
TABLE 77 CANADA BIOCHAR MARKET, BY END USE, 2018-2032 (USD THOUSAND)
TABLE 78 CANADA SOIL CONDITIONER IN BIOCHAR MARKET, BY APPLICATION, 2018-2032 (USD THOUSAND)
TABLE 79 CANADA SOIL CONDITIONER IN BIOCHAR MARKET, BY TECHNOLOGY, 2018-2032 (USD THOUSAND)
TABLE 80 CANADA ANIMAL FARMING IN BIOCHAR MARKET, BY APPLICATION, 2018-2032 (USD THOUSAND)
TABLE 81 CANADA ANIMAL FARMING IN BIOCHAR MARKET, BY TECHNOLOGY, 2018-2032 (USD THOUSAND)
TABLE 82 CANADA ELECTRICITY GENERATION IN BIOCHAR MARKET, BY TECHNOLOGY, 2018-2032 (USD THOUSAND)
TABLE 83 CANADA HEAT GENERATION IN BIOCHAR MARKET, BY TECHNOLOGY, 2018-2032 (USD THOUSAND)
TABLE 84 CANADA WATER-TREATMENT IN BIOCHAR MARKET, BY TECHNOLOGY, 2018-2032 (USD THOUSAND)
TABLE 85 CANADA BUILDING IN BIOCHAR MARKET, BY APPLICATION, 2018-2032 (USD THOUSAND)
TABLE 86 CANADA BUILDING IN BIOCHAR MARKET, BY TECHNOLOGY, 2018-2032 (USD THOUSAND)
TABLE 87 CANADA HOUSEHOLD IN BIOCHAR MARKET, BY TECHNOLOGY, 2018-2032 (USD THOUSAND)
TABLE 88 CANADA TEXTILES IN BIOCHAR MARKET, BY TECHNOLOGY, 2018-2032 (USD THOUSAND)
TABLE 89 CANADA OTHERS IN BIOCHAR MARKET, BY TECHNOLOGY, 2018-2032 (USD THOUSAND)
TABLE 90 MEXICO BIOCHAR MARKET, BY TECHNOLOGY, 2018-2032 (USD THOUSAND)
TABLE 91 MEXICO BIOCHAR MARKET, BY TECHNOLOGY, 2018-2032 (TONS)
TABLE 92 MEXICO PYROLYSIS IN BIOCHAR MARKET, BY PRODUCT TYPE, 2018-2032 (USD THOUSAND)
TABLE 93 MEXICO BIOCHAR MARKET, BY FEEDSTOCK, 2018-2032 (USD THOUSAND)
TABLE 94 MEXICO BIOCHAR MARKET, BY END USE, 2018-2032 (USD THOUSAND)
TABLE 95 MEXICO SOIL CONDITIONER IN BIOCHAR MARKET, BY APPLICATION, 2018-2032 (USD THOUSAND)
TABLE 96 MEXICO SOIL CONDITIONER IN BIOCHAR MARKET, BY TECHNOLOGY, 2018-2032 (USD THOUSAND)
TABLE 97 MEXICO ANIMAL FARMING IN BIOCHAR MARKET, BY APPLICATION, 2018-2032 (USD THOUSAND)
TABLE 98 MEXICO ANIMAL FARMING IN BIOCHAR MARKET, BY TECHNOLOGY, 2018-2032 (USD THOUSAND)
TABLE 99 MEXICO ELECTRICITY GENERATION IN BIOCHAR MARKET, BY TECHNOLOGY, 2018-2032 (USD THOUSAND)
TABLE 100 MEXICO HEAT GENERATION IN BIOCHAR MARKET, BY TECHNOLOGY, 2018-2032 (USD THOUSAND)
TABLE 101 MEXICO WATER-TREATMENT IN BIOCHAR MARKET, BY TECHNOLOGY, 2018-2032 (USD THOUSAND)
TABLE 102 MEXICO BUILDING IN BIOCHAR MARKET, BY APPLICATION, 2018-2032 (USD THOUSAND)
TABLE 103 MEXICO BUILDING IN BIOCHAR MARKET, BY TECHNOLOGY, 2018-2032 (USD THOUSAND)
TABLE 104 MEXICO HOUSEHOLD IN BIOCHAR MARKET, BY TECHNOLOGY, 2018-2032 (USD THOUSAND)
TABLE 105 MEXICO TEXTILES IN BIOCHAR MARKET, BY TECHNOLOGY, 2018-2032 (USD THOUSAND)
TABLE 106 MEXICO OTHERS IN BIOCHAR MARKET, BY TECHNOLOGY, 2018-2032 (USD THOUSAND)
List of Figure
FIGURE 1 NORTH AMERICA BIOCHAR MARKET
FIGURE 2 NORTH AMERICA BIOCHAR MARKET: DATA TRIANGULATION
FIGURE 3 NORTH AMERICA BIOCHAR MARKET: DROC ANALYSIS
FIGURE 4 NORTH AMERICA BIOCHAR MARKET: NORTH AMERICA VS REGIONAL MARKET ANALYSIS
FIGURE 5 NORTH AMERICA BIOCHAR MARKET: COMPANY RESEARCH ANALYSIS
FIGURE 6 NORTH AMERICA BIOCHAR MARKET: MULTIVARIATE MODELLING
FIGURE 7 NORTH AMERICA BIOCHAR MARKET: INTERVIEW DEMOGRAPHICS
FIGURE 8 NORTH AMERICA BIOCHAR MARKET: DBMR MARKET POSITION GRID
FIGURE 9 NORTH AMERICA BIOCHAR MARKET: MARKET APPLICATION COVERAGE GRID
FIGURE 10 NORTH AMERICA BIOCHAR MARKET: VENDOR SHARE ANALYSIS
FIGURE 11 NORTH AMERICA BIOCHAR MARKET: SEGMENTATION
FIGURE 12 ASIA-PACIFIC IS EXPECTED TO DOMINATE THE NORTH AMERICA BIOCHAR MARKET, AND IS EXPECTED TO GROW WITH THE HIGHEST CAGR IN THE FORECAST PERIOD
FIGURE 13 THREE SEGMENTS COMPRISE THE NORTH AMERICA BIOCHAR MARKET, BY TECHNOLOGY
FIGURE 14 STRATEGIC DECISIONS
FIGURE 15 EXECUTIVE SUMMARY:- NORTH AMERICA BIOCHAR MARKET
FIGURE 16 RISING DEMAND FOR SUSTAINABLE AGRICULTURAL PRACTICES IS EXPECTED TO DRIVE THE NORTH AMERICA BIOCHAR MARKET IN THE FORECAST PERIOD
FIGURE 17 THE PYROLYSIS SEGMENT IS EXPECTED TO ACCOUNT FOR THE LARGEST SHARE OF THE NORTH AMERICA BIOCHAR MARKET IN 2025 AND 2032
FIGURE 18 ASIA-PACIFIC IS THE FASTEST-GROWING MARKET FOR BIOCHAR MARKET IN THE FORECAST PERIOD
FIGURE 19 PESTEL ANALYSIS
FIGURE 20 PORTER’S FIVE FORCES ANALYSIS
FIGURE 21 DRIVERS, RESTRAINTS, OPPORTUNITIES, AND CHALLENGES FOR NORTH AMERICA BIOCHAR MARKET
FIGURE 22 NORTH AMERICA BIOCHAR MARKET: BY TECHNOLOGY, 2024
FIGURE 23 NORTH AMERICA BIOCHAR MARKET: BY FEEDSTOCK, 2023
FIGURE 24 NORTH AMERICA BIOCHAR MARKET: BY END USE, 2023
FIGURE 25 NORTH AMERICA BIOCHAR MARKET SNAPSHOT
FIGURE 26 NORTH AMERICA BIOCHAR MARKET: COMPANY SHARE 2024 (%)
North America Biochar Market, Supply Chain Analysis and Ecosystem Framework
To support market growth and help clients navigate the impact of geopolitical shifts, DBMR has integrated in-depth supply chain analysis into its North America Biochar Market research reports. This addition empowers clients to respond effectively to global changes affecting their industries. The supply chain analysis section includes detailed insights such as North America Biochar Market consumption and production by country, price trend analysis, the impact of tariffs and geopolitical developments, and import and export trends by country and HSN code. It also highlights major suppliers with data on production capacity and company profiles, as well as key importers and exporters. In addition to research, DBMR offers specialized supply chain consulting services backed by over a decade of experience, providing solutions like supplier discovery, supplier risk assessment, price trend analysis, impact evaluation of inflation and trade route changes, and comprehensive market trend analysis.
Data collection and base year analysis are done using data collection modules with large sample sizes. The stage includes obtaining market information or related data through various sources and strategies. It includes examining and planning all the data acquired from the past in advance. It likewise envelops the examination of information inconsistencies seen across different information sources. The market data is analysed and estimated using market statistical and coherent models. Also, market share analysis and key trend analysis are the major success factors in the market report. To know more, please request an analyst call or drop down your inquiry.
The key research methodology used by DBMR research team is data triangulation which involves data mining, analysis of the impact of data variables on the market and primary (industry expert) validation. Data models include Vendor Positioning Grid, Market Time Line Analysis, Market Overview and Guide, Company Positioning Grid, Patent Analysis, Pricing Analysis, Company Market Share Analysis, Standards of Measurement, Global versus Regional and Vendor Share Analysis. To know more about the research methodology, drop in an inquiry to speak to our industry experts.
Data Bridge Market Research is a leader in advanced formative research. We take pride in servicing our existing and new customers with data and analysis that match and suits their goal. The report can be customized to include price trend analysis of target brands understanding the market for additional countries (ask for the list of countries), clinical trial results data, literature review, refurbished market and product base analysis. Market analysis of target competitors can be analyzed from technology-based analysis to market portfolio strategies. We can add as many competitors that you require data about in the format and data style you are looking for. Our team of analysts can also provide you data in crude raw excel files pivot tables (Fact book) or can assist you in creating presentations from the data sets available in the report.


