
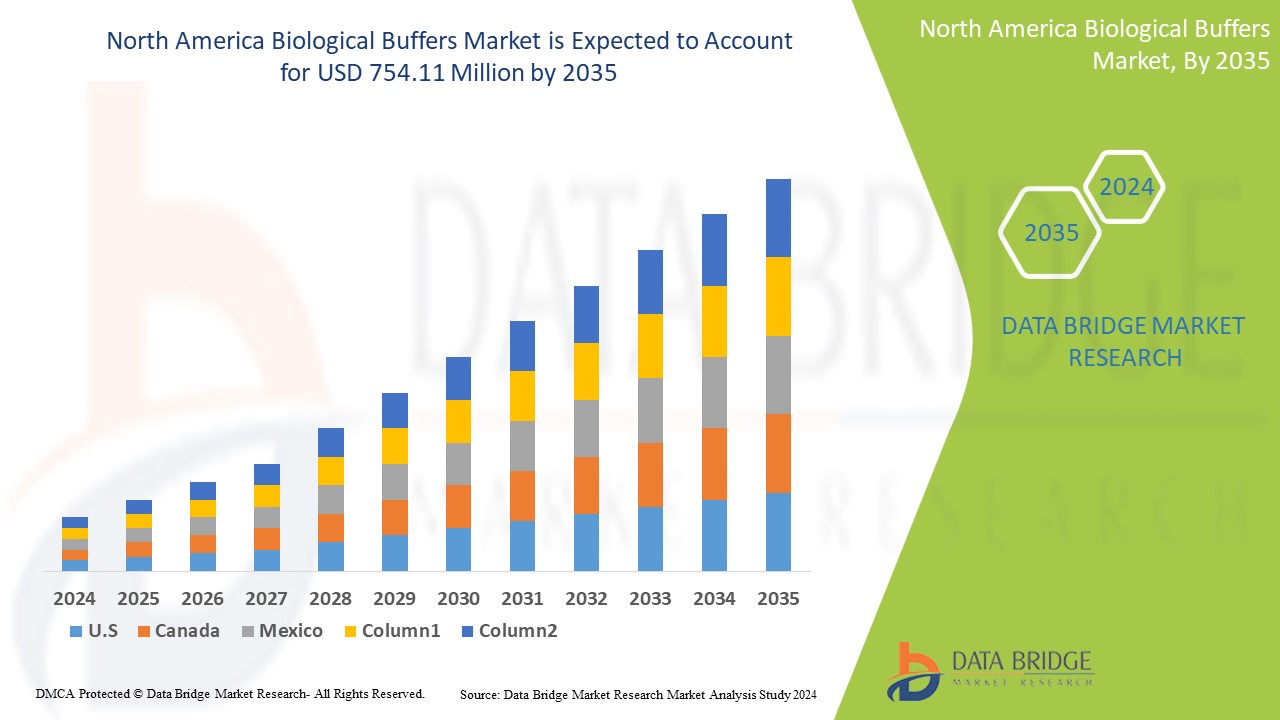
North America Biological Buffers Market
Market Size in USD Million
 USD
336.26 Million
USD
754.11 Million
2024
2035
USD
336.26 Million
USD
754.11 Million
2024
2035
| 2025 - 2035 | |
| USD 336.26 Million | |
| USD 754.11 Million | |
| % | |
|
North America Biological Buffers Market Analysis and Size
The North America biological buffers market refers to a market focused on the production, distribution, and sales of biological buffers, which are solutions containing a weak acid and its conjugate base (or a weak base and its conjugate acid) used to maintain a stable pH environment in laboratory and bio-medical settings. The market encompasses a wide range of biological buffers, including phosphate buffers, Tris buffers, HEPES buffers, and others, catering to various applications in fields such as life sciences research, biotechnology, pharmaceuticals, and diagnostics, among others.
North America Biological Buffers Market Size
The North America biological buffers market is expected to reach USD 754.11 million by 2035 from USD 336.26 million in 2024, growing at a substantial CAGR of 7.7% in the forecast period of 2025 to 2035. In addition to the insights on market scenarios such as market value, growth rate, segmentation, geographical coverage, and major players, the market reports curated by the Data Bridge Market Research also include in-depth expert analysis, import/export analysis, pricing analysis, production consumption analysis, and PESTLE analysis.
Biological Buffers Market Trends
“Rising Adoption of AI-Driven Technology”
The biological buffering market is experiencing a significant shift towards AI-driven solutions. As laboratories and biopharmaceutical companies prioritize precision, efficiency, and regulatory compliance, artificial intelligence and machine learning are being integrated into buffer formulation and quality control processes. These technologies help optimize pH stabilization, enhance buffer performance predictions, and streamline production workflows. Additionally, the increasing need for real-time monitoring and automated adjustments in sectors like drug development, clinical research, and bioprocessing is driving demand. As regulatory standards tighten and digital transformation accelerates, AI-powered biological buffering solutions are poised to become a standard in the industry
Report Scope and Biological Buffers Market Segmentation
|
Attributes |
Biological Buffers Key Market Insights |
|
Segments Covered |
|
|
Countries Covered |
U.S., Canada, Mexico |
|
Key Market Players |
F. Hoffmann-La Roche Ltd (Switzerland), Bio-Rad Laboratories, Inc. (U.S.), Thermo Fisher Scientific Inc. (U.S.), Takara Bio Inc. (Japan), and Merck KGaA (Germany) among others |
|
Market Opportunities |
|
|
Value Added Data Infosets |
In addition to the insights on market scenarios such as market value, growth rate, segmentation, geographical coverage, and major players, the market reports curated by the Data Bridge Market Research also include in-depth expert analysis, import/export analysis, pricing analysis, production consumption analysis, and PESTLE analysis. |
Biological Buffers Market Definition
Biological buffers are solutions containing a weak acid and its conjugate base (or a weak base and its conjugate acid) that resist changes in pH upon the addition of an acid or base. They are crucial in biological systems and laboratory settings to maintain a stable pH environment, as enzymes and other biomolecules are highly sensitive to pH fluctuations. Common biological buffers include phosphate, Tris, and HEPES, each with a specific buffering range suitable for different applications.
North America Biological Buffers market Dynamics
This section deals with understanding the market drivers, advantages, opportunities, restraints, and challenges. All of this is discussed in detail as below:
Drivers
- Escalating Prevalence of Chronic Diseases
The escalating prevalence of chronic diseases, such as diabetes, cancer, and cardiovascular ailments, is a significant driver of the North America biological buffer market. This rise necessitates increased research and development efforts to understand disease mechanisms, develop diagnostic tools, and formulate effective treatments. Biological buffers play a crucial role in these endeavors, as they provide the stable pH environments essential for conducting accurate experiments and assays in various fields, including cell culture, drug discovery, and protein analysis.
For instance,
- In January 2024, according to the article published in NCBI, chronic illnesses such as diabetes, heart disease, stroke, and cancer have long been and continue to be significant contributors to North America morbidity and mortality rates. These diseases not only affect millions of lives but also place a substantial strain on healthcare systems worldwide. The financial impact of managing chronic diseases is expected to rise dramatically, with the estimated North America cost projected to reach USD 47 trillion by 2030. This staggering figure highlights the growing burden of chronic conditions, which require ongoing medical care, advanced treatments, and extensive healthcare resources
- In July 2024, according to the data published by WHO, an estimated 39.9 million [36.1–44.6 million] people were living with HIV at the end of 2023, of which 1.4 million [1.1–1.7 million] children (0–14 years old) and 38.6 [34.9–43.1 million] adults (15+ years old). 1.3 million [1.0–1.7 million] people acquired HIV in 2023. 120,000 [83,000–170,000] children acquired HIV in 2023. 1.2 million [950 000–1.5 million] adults acquired HIV in 2023
The prevalence of these diseases varies by location, with around 17% of elderly individuals in rural areas and 29% in urban regions affected by chronic ailments. Among these conditions, hypertension and diabetes are particularly prevalent, together accounting for about 68% of all chronic diseases in the elderly population. This underscores the pressing need for focused healthcare interventions and management strategies to address the growing burden of chronic illnesses among India's aging population.
- Increased Adoption of Western BLOT and Elisa Techniques
Western Blot and Elisa techniques are fundamental in life sciences research and diagnostics, enabling the detection and quantification of proteins and other biomolecules. As research efforts expand, particularly in areas like drug discovery, disease diagnosis, and biomarker identification, the demand for these techniques grows, consequently driving the need for high-quality, reliable buffers crucial for optimal assay performance.
For instance,
- In April 2023, according to the article published in the National Library of Medicine, this article highlights the growing use of ELISA (Enzyme-Linked Immunosorbent Assay) due to its versatility, sensitivity, and specificity in detecting and quantifying biological substances. This rise in adoption is driven by its applicability across medical diagnostics, food safety, and research. ELISA's ability to detect a wide range of antigens and antibodies, coupled with advancements in automation and multiplexing, makes it a preferred method in both clinical and laboratory settings. The simplicity, reproducibility, and cost-effectiveness of the assay further contribute to its increased use
- In April 2021, according to the article published in IUBMB Journals, Western Blot (WB), also known as immunoblot, is a fundamental method frequently employed by biologists to study various aspects of protein biomolecules. Beyond research, it is widely utilized in disease diagnosis due to its ability to directly detect proteins, making it a highly effective diagnostic tool routinely used in clinical settings. Its versatility and reliability have led to its widespread adoption in biology labs, establishing it as one of the most essential techniques for both research and clinical applications
Opportunities
- Increase in Public-Private Funding in Biomedical Research
As more financial resources allocated to scientific research and development, companies have the potential to invest in innovative formulations and technologies that enhance blocking buffer performance. This funding supports the creation of customized solutions tailored to specific applications, improving specificity and reducing background noise in assays. Additionally, it fosters collaboration with research institutions, leading to breakthroughs in buffer technology. Increased investment facilitates the development of environmentally friendly and sustainable products, aligning with growing consumer demand for eco-conscious solutions. Overall, tapping into this funding trend propels advancements in the blocking buffer market and fosters a competitive edge in a rapidly evolving landscape.
For instance,
- In May 2021, according to the article published in NCBI, the upsurge in public-private funding for biomedical research, coupled with the increasing applications of western blotting techniques and rising product innovations, creates a favorable environment for growth. This trend acts as a significant opportunity for the blocking buffer market to expand and evolve
- In June 2024, according to the article published in iScience, Public-private partnerships (PP) thrive in the genome-editing sector, particularly in the U.S., where scientists engage in various capacities, including private spinoffs and advisory roles. This collaborative ecosystem fosters innovation and resource sharing, creating a significant opportunity for the blocking buffer market to expand and adapt
- In March 2023, according to the article published in NCBI, Target 2035, an international federation of biomedical scientists, is leveraging open principles to create pharmacological tools for every human protein, essential for studying health and disease. As pharmaceutical companies contribute knowledge and reagents, this initiative presents a valuable opportunity for the blocking buffer market to grow and innovate
The recent surge in public-private funding offers a substantial opportunity for the blocking buffer market. Increased financial support for scientific research allows companies to invest in innovative formulations that improve buffer performance. This funding encourages the development of customized solutions, enhances specificity, and promotes collaboration with research institutions, ultimately advancing eco-friendly products. This trend positions the blocking buffer market for significant growth.
- Analytical Methods for Food Safety and Environmental Testing
Industries such as food safety and environmental testing increasingly rely on precise analytical methods, where high-quality blocking buffers play a critical role in minimizing background noise and enhancing assay sensitivity. As regulatory standards become more stringent, the demand for effective blocking solutions in these sectors is set to rise. By developing specialized buffers tailored to the unique requirements of food safety testing—such as allergen detection and pathogen identification—and environmental monitoring—such as pollutant analysis—manufacturers may tap into a growing market. This targeted approach not only addresses specific industry needs but also helps establish a competitive advantage. Companies that innovate and offer customizable solutions for these niche applications may position themselves for significant growth within the broader blocking buffer market.
For instance,
- In September 2021, according to the article published in Springer Nature, the use of Enzyme-Linked Immunosorbent Assay (ELISA) techniques in food analysis highlights a significant opportunity for the blocking buffer market. Their sensitivity and specificity allow for the detection of various components, including pesticides and toxins. This versatility creates a valuable opportunity for specialized blocking buffers tailored to food safety applications
- In May 2020, according to the article published in Science Direct, the prevalence of chemical contamination in food presents a significant opportunity for the blocking buffer market. The competitive enzyme-linked immunosorbent assay (Cp-ELISA) is widely used for detecting these contaminants due to its high throughput and low cost, highlighting the need for effective blocking buffers to enhance assay performance
- In February 2020, according to the article published in Springer Nature, The monitoring of pharmaceuticals in aquatic environments using enzyme-linked immunosorbent assay (ELISA) techniques creates a valuable opportunity for the blocking buffer market. As the demand for accurate detection of contaminants grows, effective blocking buffers become essential for improving assay sensitivity and reliability in environmental testing
The rising geriatric population is a key driver in the North America biological buffers market, as older adults are more susceptible to various eye conditions that can lead to corneal damage and the need for transplants. Age-related eye diseases, such as Fuchs' endothelial dystrophy, bullous keratopathy, and other degenerative corneal disorders, become more prevalent with advancing age, significantly increasing the demand for Biological Bufferss. Also, older adults are more likely to experience complications from cataract surgery or develop chronic conditions like diabetes, which can further contribute to corneal deterioration. As the North America population ages, the number of individuals requiring biological bufferss is expected to rise, particularly in regions with rapidly aging demographics. This trend is further fueled by increased awareness about the availability and success rates of Biological Bufferss, as well as advancements in surgical techniques that offer better outcomes and faster recovery times for older patients. As a result, the growing geriatric population is a major factor driving the expansion of the North America biological buffers market, highlighting the need for accessible and effective treatment options for age-related corneal diseases.
Restraint/Challenge
- Alternative Technologies and Approaches for Inhibiting Biological Buffers
The biological buffer market faces substantial challenges due to the rise of alternative methodologies and advanced techniques, such as label-free detection and microfluidics, which allow for precise interactions without the need for traditional blocking buffers, thereby reducing background noise. Innovations in immunoassays, including multiplexing, improve specificity and further lessen dependence on conventional blocking strategies. Moreover, the application of nanotechnology for targeted binding complicates the traditional role of biological buffers. As these alternatives gain traction, offering cost-effective solutions, they may introduce background noise in sensitive assays, creating a dual challenge. As these methods become more widely accepted in research and clinical applications, the market is under pressure to innovate and adapt, potentially shifting demand and altering the competitive landscape.
For instance,
- In July 2021, according to the article published in Springer Nature Limited, Cell-free gene expression (CFE) offers an alternative to traditional cell-based methods for protein synthesis and labeling in structural biology and proteomics. This innovative approach enhances specificity and reduces non-specific interactions, presenting a challenge in the blocking buffer market as demand shifts towards more efficient methodologies
- In March 2024, according to the article published in MDPI, the synthesis of fully synthetic copolymers based on pHPMA or poly(2-oxazoline), designed to suppress non-specific interactions. These copolymers could serve as potential replacements for BSA or other proteins in diagnostic assays, presenting a significant challenge in the blocking buffer market
- In August 2023, according to the article published in MDPI, the enhanced immunoblotting process by simplifying gel preparation, optimizing the electrophoresis buffer, and substituting methanol with ethanol to improve safety. These modifications boost efficiency nearly four-fold, allowing even low-quality antibodies to be visualized effectively. This innovation presents a challenge in the blocking buffer market.
Biological Buffers Market Scope
The North America biological buffers market is categorized into four notable segments based on buffers type, formulation, application, and end user. The growth amongst these segments will help you analyze meagre growth segments in the industries and provide the users with a valuable market overview and market insights to help them make strategic decisions for identifying core market applications.
Buffers Type
- Goods Buffers
- Tris Buffers
- Tris (Tris(Hydroxymethyl)Aminomethane)
- Tris NA
- Tris-HCL
- Hepes Buffers
- Hepes
- Hepes NA
- Mops Buffers
- Mops
- Mops NA
- Mes Buffers
- MES
- MES NA
- Bis-Tris Buffers
- BIS-TRIS
- Bis-TRIS HCL
- Others
- Tris Buffers
- Other Salt-Based Buffers
- Phosphate Buffers
- Phosphate Buffered Saline (PBS)
- Sodium Phosphate
- Potassium Phosphate
- Acetate Buffers
- Sodium Acetate
- Potassium Acetate
- Citrate Buffers
- Sodium Citrate
- Citric Acid
- Amino Acid Buffers
- Glycine Buffer
- Histidine Buffer
- Phosphate Buffers
Formulation
- Powder
- Liquid
Application
- Pharmaceutical & Biopharmaceuticals
- Drug Development
- Vaccine Formulation
- Biologics Manufacturing
- Cell Culture & Molecular Biology
- PCR & Electrophoresis
- Cell Culture Media Preparation
- DNA & RNA Isolation
- Protein Purification
- Clinical & Diagnostic Applications
- In-Vitro Diagnostics (IVD)
- Clinical Testing Kits
- Chemical & Industrial Applications
- Biotechnology Research
- Food & Beverage Processing
- Others
End User
- Pharmaceutical & Biopharmaceutical Companies
- Biotechnology Companies
- Research & Academic Institutes
- Diagnostic Laboratories
- Contract Research Organizations (CROS) & CMOS
Biological Buffers Market Regional Analysis
Biological buffers market is analyzed, and market size insights and trends are provided by based on buffer type, formulation, application, and end user.
The countries covered in this market report are U.S., Canada, Mexico.
U.S. is expected to dominate the market due to high R&D spending, key market player presence, advanced infrastructure, a strong healthcare system, and stringent regulations.
The country section of the report also provides individual market impacting factors and changes in market regulation that impact the current and future trends of the market. Data points such as down-stream and upstream value chain analysis, technical trends and porter's five forces analysis, case studies are some of the pointers used to forecast the market scenario for individual countries. Also, the presence and availability of regional brands and their challenges faced due to large or scarce competition from local and domestic brands, impact of domestic tariffs and trade routes are considered while providing forecast analysis of the country data.
North America Biological Buffers Market Share
The market competitive landscape provides details by competitor. Details included are company overview, company financials, revenue generated, market potential, investment in research and development, new market initiatives, regional presence, production sites and facilities, production capacities, company strengths and weaknesses, product launch, product width and breadth, application dominance. The above data points provided are only related to the companies' focus related to market.
Biological Buffers Market Leaders operating in the market are:
- F. Hoffmann-La Roche Ltd (Switzerland)
- Bio-Rad Laboratories, Inc. (US)
- Thermo Fisher Scientific Inc. (US)
- Avantor, Inc. (U.S.)
- Advancion Corporation (U.S.)
- Santa Cruz Biotechnology Inc. (U.S.)
- MP Biomedicals (U.S.)
- Promega Corporation (U.S.)
- Beckman Coulter, Inc. (U.S.)
- Cayman Chemical (U.S.)
- GoldBio (U.S.)
Latest Developments in Biological Buffers Market
- In February 2024, Roche entered into collaboration agreement with PathAI to expand digital pathology capabilities for companion diagnostics. The collaboration provides Roche with PathAI’s advanced AI technology for improving companion diagnostics. It ensures exclusive, tailored solutions and accelerates algorithm development while allowing Roche to continue developing its own diagnostics
- In July 2024, Roche announced the successful acquisition of LumiraDx’s Point of Care technology, following the necessary antitrust and regulatory approvals. This integration enhanced Roche’s diagnostics portfolio with a user-friendly platform that consolidates various immunoassay and clinical chemistry tests. The acquisition aimed to improve access to diagnostic testing, particularly in primary care and underserved regions, aligning with Roche's commitment to decentralised healthcare solutions
- In July 2023, Bio-Rad and QIAGEN have announced a patent settlement and cross-licensing agreement that resolves ongoing disputes regarding specific technologies. This partnership allows both companies to enhance their product portfolios and accelerate innovation in the life sciences sector, ultimately benefiting their customers by providing broader access to advanced technologies and improved solutions in research and diagnostics
- In May 2023, Thermo Fisher and BRIN have partnered to enhance research capabilities in Indonesia, focusing on advancing scientific innovation and collaboration in life sciences, biotechnology, and environmental studies for local researchers
SKU-

- Interactive Data Analysis Dashboard
- Company Analysis Dashboard for high growth potential opportunities
- Research Analyst Access for customization & queries
- Competitor Analysis with Interactive dashboard
- Latest News, Updates & Trend analysis
- Harness the Power of Benchmark Analysis for Comprehensive Competitor Tracking
Table of Content
1 INTRODUCTION
1.1 OBJECTIVES OF THE STUDY
1.2 MARKET DEFINITION
1.3 OVERVIEW OF THE NORTH AMERICA BIOLOGICAL BUFFERS MARKET
1.4 LIMITATIONS
1.5 MARKETS COVERED
2 MARKET SEGMENTATION
2.1 MARKETS COVERED
2.2 GEOGRAPHICAL SCOPE
2.3 YEARS CONSIDERED FOR THE STUDY
2.4 CURRENCY AND PRICING
2.5 DBMR TRIPOD DATA VALIDATION MODEL
2.6 MULTIVARIATE MODELLING
2.7 TYPE LIFELINE CURVE
2.8 PRIMARY INTERVIEWS WITH KEY OPINION LEADERS
2.9 DBMR MARKET POSITION GRID
2.1 MARKET END USER COVERAGE GRID
2.11 VENDOR SHARE ANALYSIS
2.12 SECONDARY SOURCES
2.13 ASSUMPTIONS
3 EXECUTIVE SUMMARY
4 PREMIUM INSIGHTS
5 NORTH AMERICA BIOLOGICAL BUFFER MARKET: REGULATIONS
5.1 REGULATORY AUTHORITIES IN THE U.S.
5.2 REGULATORY SUBMISSIONS
5.3 INTERNATIONAL HARMONIZATION
5.4 EUROPE REGULATORY SCENARIO
5.5 REGULATORY SUBMISSIONS
5.6 INTERNATIONAL HARMONIZATION
5.7 JAPAN REGULATORY SCENARIO
5.8 REGULATORY SUBMISSIONS
5.9 INTERNATIONAL HARMONIZATION
5.1 COMPLIANCE AND QUALITY MANAGEMENT SYSTEMS
6 MARKET OVERVIEW
6.1 DRIVERS
6.1.1 RISING PREVALENCE OF CHRONIC DISEASES
6.1.2 INCREASED ADOPTION OF WESTERN BLOT AND ELISA TECHNIQUES
6.1.3 TECHNOLOGICAL ADVANCEMENTS IN ASSAY DEVELOPMENT
6.1.4 ADVANCEMENTS IN PROTEOMICS AND GENOMICS
6.2 RESTRAINTS
6.2.1 LIMITED SHELF LIFE OF BLOCKING BUFFERS
6.2.2 POTENTIAL OF CONTAMINATION OR BATCH INCONSISTENCIES FOR BIOLOGICAL BUFFERS
6.3 OPPORTUNITY
6.3.1 INCREASE IN PUBLIC-PRIVATE FUNDING IN BIOMEDICAL RESEARCH
6.3.2 ANALYTICAL METHODS FOR FOOD SAFETY AND ENVIRONMENTAL TESTING.
6.3.3 DIAGNOSTIC AND CLINICAL APPLICATIONS USE BLOCKING BUFFERS.
6.4 CHALLENGES
6.4.1 ALTERNATIVE TECHNOLOGIES AND APPROACHES FOR INHIBITING BIOLOGICAL BUFFERS.
6.4.2 DISRUPTIONS IN THE SUPPLY CHAIN OF BIOLOGICAL BUFFERS.
7 NORTH AMERICA BIOLOGICAL BUFFERS MARKET, BY BUFFERS TYPE
7.1 OVERVIEW
7.2 GOODS BUFFERS
7.2.1 TRIS BUFFERS
7.2.2 HEPES BUFFERS
7.2.3 MOPS BUFFERS
7.2.4 MES BUFFERS
7.2.5 BIS-TRIS BUFFERS
7.3 OTHER SALT-BASED BUFFERS
7.3.1 PHOSPHATE BUFFERS
7.3.2 ACETATE BUFFERS
7.3.3 CITRATE BUFFERS
7.3.4 AMINO ACID BUFFERS
8 NORTH AMERICA BIOLOGICAL BUFFERS MARKET, BY FORMULATION
8.1 OVERVIEW
8.2 POWDER
8.3 LIQUID
9 NORTH AMERICA BIOLOGICAL BUFFERS MARKET, BY APPLICATION
9.1 OVERVIEW
9.2 PHARMACEUTICAL & BIOPHARMACEUTICALS
9.3 CELL CULTURE & MOLECULAR BIOLOGY
9.4 CLINICAL & DIAGNOSTIC APPLICATIONS
9.5 CHEMICAL & INDUSTRIAL APPLICATIONS
9.6 OTHERS
10 NORTH AMERICA BIOLOGICAL BUFFERS MARKET, BY END USER
10.1 OVERVIEW
10.2 PHARMACEUTICAL & BIOPHARMACEUTICAL COMPANIES
10.3 BIOTECHNOLOGY COMPANIES
10.4 RESEARCH & ACADEMIC INSTITUTES
10.5 DIAGNOSTIC LABORATORIES
10.6 CONTRACT RESEARCH ORGANIZATIONS (CROS) & CMOS
11 NORTH AMERICA BIOLOGICAL BUFFERS MARKET, BY REGION
11.1 NORTH AMERICA
11.1.1 U.S
11.1.2 CANADA
11.1.3 MEXICO
12 NORTH AMERICA BIOLOGICAL BUFFERS MARKET: COMPANY LANDSCAPE
12.1 COMPANY SHARE ANALYSIS: NORTH AMERICA
13 SWOT
14 COMPANY PROFILES
14.1 F. HOFFMANN-LA ROCHE LTD
14.1.1 COMPANY SNAPSHOT
14.1.2 REVENUE ANALYSIS
14.1.3 COMPANY SHARE ANALYSIS
14.1.4 PRODUCT PORTFOLIO
14.1.5 RECENT UPDATES
14.2 BIO-RAD LABORATORIES, INC.
14.2.1 COMPANY SNAPSHOT
14.2.2 REVENUE ANALYSIS
14.2.3 COMPANY SHARE ANALYSIS
14.2.4 PRODUCT PORTFOLIO
14.2.5 RECENT DEVELOPMENT
14.3 THERMO FISHER SCIENTIFIC, INC.
14.3.1 COMPANY SNAPSHOT
14.3.2 REVENUE ANALYSIS
14.3.3 COMPANY SHARE ANALYSIS
14.3.4 PRODUCT PORTFOLIO
14.3.5 RECENT UPDATES
14.4 TAKARA BIO INC.
14.4.1 COMPANY SNAPSHOT
14.4.2 REVENUE ANALYSIS
14.4.3 COMPANY SHARE ANALYSIS
14.4.4 PRODUCT PORTFOLIO
14.4.5 RECENT DEVELOPMENTS
14.5 MERCK KGAA, DARMSTADT, GERMANY
14.5.1 COMPANY SNAPSHOT
14.5.2 REVENUE ANALYSIS
14.5.3 COMPANY SHARE ANALYSIS
14.5.4 PRODUCT PORTFOLIO
14.5.5 RECENT DEVELOPMENTS
14.6 ADVANCION CORPORATION
14.6.1 COMPANY SNAPSHOT
14.6.2 PRODUCT PORTFOLIO
14.6.3 RECENT DEVELOPMENT
14.7 AVANTOR, INC.
14.7.1 COMPANY SNAPSHOT
14.7.2 REVENUE ANALYSIS
14.7.3 PRODUCT PORTFOLIO
14.7.4 RECENT DEVELOPMENT
14.8 BECKMAN COULTER
14.8.1 COMPANY SNAPSHOT
14.8.2 PRODUCT PORTFOLIO
14.8.3 RECENT DEVELOPMENT
14.9 BIOSYNTH
14.9.1 COMPANY SNAPSHOT
14.9.2 PRODUCT PORTFOLIO
14.9.3 RECENT DEVELOPMENT
14.1 FUJIFILM WAKO PURE CHEMICAL CORPORATION
14.10.1 COMPANY SNAPSHOT
14.10.2 PRODUCT PORTFOLIO
14.10.3 RECENT DEVELOPMENT
14.11 GOLDBIO
14.11.1 COMPANY SNAPSHOT
14.11.2 PRODUCT PORTFOLIO
14.11.3 RECENT DEVELOPMENT
14.12 HOPAX
14.12.1 COMPANY SNAPSHOT
14.12.2 PRODUCT PORTFOLIO
14.12.3 RECENT DEVELOPMENT
14.13 HIMEDIA LABORATORIES
14.13.1 COMPANY SNAPSHOT
14.13.2 PRODUCT PORTFOLIO
14.13.3 RECENT DEVELOPMENT
14.14 MP BIOMEDICALS.
14.14.1 COMPANY SNAPSHOT
14.14.2 PRODUCT PORTFOLIO
14.14.3 RECENT DEVELOPMENT
14.15 NACALAI TESQUE, INC.
14.15.1 COMPANY SNAPSHOT
14.15.2 PRODUCT PORTFOLIO
14.15.3 RECENT DEVELOPMENT
14.16 PROMEGA CORPORATION
14.16.1 COMPANY SNAPSHOT
14.16.2 PRODUCT PORTFOLIO
14.16.3 RECENT DEVELOPMENT
14.17 QIAGEN
14.17.1 COMPANY SNAPSHOT
14.17.2 REVENUE ANALYSIS
14.17.3 PRODUCT PORTFOLIO
14.17.4 RECENT DEVELOPMENT
14.18 REAGECON DIAGNOSTICS LTD
14.18.1 COMPANY SNAPSHOT
14.18.2 PRODUCT PORTFOLIO
14.18.3 RECENT DEVELOPMENT
14.19 SANTA CRUZ BIOTECHNOLOGY INC.
14.19.1 COMPANY SNAPSHOT
14.19.2 PRODUCT PORTFOLIO
14.19.3 RECENT DEVELOPMENT
14.2 SERVA ELECTROPHORESIS GMBH
14.20.1 COMPANY SNAPSHOT
14.20.2 PRODUCT PORTFOLIO
14.20.3 RECENT DEVELOPMENT
14.21 TEVA PHARMACEUTICALS USA, INC.
14.21.1 COMPANY SNAPSHOT
14.21.2 REVENUE ANALYSIS
14.21.3 PRODUCT PORTFOLIO
14.21.4 RECENT DEVELOPMENT
15 QUESTIONNAIRE
16 RELATED REPORTS
List of Table
TABLE 1 NORTH AMERICA BIOLOGICAL BUFFERS MARKET, BY BUFFERS TYPE, 2018-2035 (USD THOUSAND)
TABLE 2 NORTH AMERICA GOODS BUFFERS IN BIOLOGICAL BUFFERS MARKET, BY REGION, 2018-2035 (USD THOUSAND)
TABLE 3 NORTH AMERICA GOODS BUFFERS IN BIOLOGICAL BUFFERS MARKET, BY TYPE, 2018-2035 (USD THOUSAND)
TABLE 4 NORTH AMERICA TRIS BUFFERS IN BIOLOGICAL BUFFERS MARKET, BY TYPE, 2018-2035 (USD THOUSAND)
TABLE 5 NORTH AMERICA HEPES BUFFERS IN BIOLOGICAL BUFFERS MARKET, BY TYPE, 2018-2035 (USD THOUSAND
TABLE 6 NORTH AMERICA MOPS BUFFERS IN BIOLOGICAL BUFFERS MARKET, BY TYPE, 2018-2035 (USD THOUSAND)
TABLE 7 NORTH AMERICA MES BUFFERS IN BIOLOGICAL BUFFERS MARKET, BY TYPE, 2018-2035 (USD THOUSAND)
TABLE 8 NORTH AMERICA BIS-TRIS BUFFERS IN BIOLOGICAL BUFFERS MARKET, BY TYPE, 2018-2035 (USD THOUSAND)
TABLE 9 NORTH AMERICA OTHER SALT-BASED BUFFERS IN BIOLOGICAL BUFFERS MARKET, BY REGION, 2018-2035 (USD THOUSAND)
TABLE 10 NORTH AMERICA OTHER SALT-BASED BUFFERS IN BIOLOGICAL BUFFERS MARKET, BY TYPE, 2018-2035 (USD THOUSAND)
TABLE 11 NORTH AMERICA PHOSPHATE BUFFERS IN BIOLOGICAL BUFFERS MARKET, BY TYPE, 2018-2035 (USD THOUSAND)
TABLE 12 NORTH AMERICA ACETATE BUFFERS IN BIOLOGICAL BUFFERS MARKET, BY TYPE, 2018-2035 (USD THOUSAND)
TABLE 13 NORTH AMERICA CITRATE BUFFERS IN BIOLOGICAL BUFFERS MARKET, BY TYPE, 2018-2035 (USD THOUSAND)
TABLE 14 NORTH AMERICA AMINO ACID BUFFERS IN BIOLOGICAL BUFFERS MARKET, BY TYPE, 2018-2035 (USD THOUSAND)
TABLE 15 NORTH AMERICA BIOLOGICAL BUFFERS MARKET, BY FORMULATION, 2018-2035 (USD THOUSAND)
TABLE 16 NORTH AMERICA POWDER IN BIOLOGICAL BUFFERS MARKET, BY REGION, 2018-2035 (USD THOUSAND)
TABLE 17 NORTH AMERICA LIQUID IN BIOLOGICAL BUFFERS MARKET, BY REGION, 2018-2035 (USD THOUSAND)
TABLE 18 NORTH AMERICA BIOLOGICAL BUFFERS MARKET, BY APPLICATION,2018-2035 (USD THOUSAND)
TABLE 19 NORTH AMERICA PHARMACEUTICAL & BIOPHARMACEUTICALS IN BIOLOGICAL BUFFERS MARKET, BY REGION, 2018-2035 (USD THOUSAND)
TABLE 20 NORTH AMERICA PHARMACEUTICAL & BIOPHARMACEUTICALS IN BIOLOGICAL BUFFERS MARKET, BY TYPE, 2018-2035 (USD THOUSAND)
TABLE 21 NORTH AMERICA CELL CULTURE & MOLECULAR BIOLOGY IN BIOLOGICAL BUFFERS MARKET, BY REGION, 2018-2035 (USD THOUSAND)
TABLE 22 NORTH AMERICA CELL CULTURE & MOLECULAR BIOLOGY IN BIOLOGICAL BUFFERS MARKET, BY TYPE, 2018-2035 (USD THOUSAND)
TABLE 23 NORTH AMERICA CLINICAL & DIAGNOSTIC APPLICATIONS IN BIOLOGICAL BUFFERS MARKET, BY REGION, 2018-2035 (USD THOUSAND)
TABLE 24 NORTH AMERICA CLINICAL & DIAGNOSTIC APPLICATIONS IN BIOLOGICAL BUFFERS MARKET, BY TYPE, 2018-2035 (USD THOUSAND)
TABLE 25 NORTH AMERICA CHEMICAL & INDUSTRIAL APPLICATIONS IN BIOLOGICAL BUFFERS MARKET, BY REGION, 2018-2035 (USD THOUSAND)
TABLE 26 NORTH AMERICA CHEMICAL & INDUSTRIAL APPLICATIONS IN BIOLOGICAL BUFFERS MARKET, BY TYPE, 2018-2035 (USD THOUSAND)
TABLE 27 NORTH AMERICA OTHERS IN BIOLOGICAL BUFFERS MARKET, BY REGION, 2018-2035 (USD THOUSAND)
TABLE 28 NORTH AMERICA BIOLOGICAL BUFFERS MARKET, BY END USER, 2018-2035 (USD THOUSAND)
TABLE 29 NORTH AMERICA PHARMACEUTICAL & BIOPHARMACEUTICAL COMPANIES IN ORTHODONTIC SUPPLIES MARKET, BY REGION, 2018-2035 (USD THOUSAND)
TABLE 30 NORTH AMERICA BIOTECHNOLOGY COMPANIES IN ORTHODONTIC SUPPLIES MARKET, BY REGION, 2018-2035 (USD THOUSAND)
TABLE 31 NORTH AMERICA RESEARCH & ACADEMIC INSTITUTES IN ORTHODONTIC SUPPLIES MARKET, BY REGION, 2018-2035 (USD THOUSAND)
TABLE 32 NORTH AMERICA DIAGNOSTIC LABORATORIES IN ORTHODONTIC SUPPLIES MARKET, BY REGION, 2018-2032 (USD THOUSAND)
TABLE 33 NORTH AMERICA CONTRACT RESEARCH ORGANIZATIONS (CROS) IN ORTHODONTIC SUPPLIES MARKET, BY REGION, 2018-2032 (USD THOUSAND)
TABLE 34 NORTH AMERICA BIOLOGICAL BUFFERS MARKET, BY COUNTRY, 2018-2035 (USD THOUSAND)
TABLE 35 NORTH AMERICA BIOLOGICAL BUFFERS MARKET, BY BUFFERS TYPE, 2018-2035 (USD THOUSAND)
TABLE 36 NORTH AMERICA GOODS BUFFERS IN BIOLOGICAL BUFFERS MARKET, BY TYPE, 2018-2035 (USD THOUSAND)
TABLE 37 NORTH AMERICA TRIS BUFFERS IN BIOLOGICAL BUFFERS MARKET, BY TYPE, 2018-2035 (USD THOUSAND)
TABLE 38 NORTH AMERICA HEPES BUFFERS IN BIOLOGICAL BUFFERS MARKET, BY TYPE, 2018-2035 (USD THOUSAND)
TABLE 39 NORTH AMERICA MOPS BUFFERS IN BIOLOGICAL BUFFERS MARKET, BY TYPE, 2018-2035 (USD THOUSAND)
TABLE 40 NORTH AMERICA MES BUFFERS IN BIOLOGICAL BUFFERS MARKET, BY TYPE, 2018-2035 (USD THOUSAND)
TABLE 41 NORTH AMERICA BIS-TRIS BUFFERS IN BIOLOGICAL BUFFERS MARKET, BY TREATMENT TYPE, 2018-2035 (USD THOUSAND)
TABLE 42 NORTH AMERICA OTHER SALT-BASED BUFFERS IN BIOLOGICAL BUFFERS MARKET, BY TYPE, 2018-2035 (USD THOUSAND)
TABLE 43 NORTH AMERICA PHOSPHATE BUFFERS IN BIOLOGICAL BUFFERS MARKET, BY TYPE, 2018-2035 (USD THOUSAND)
TABLE 44 NORTH AMERICA ACETATE BUFFERS IN BIOLOGICAL BUFFERS MARKET, BY TYPE, 2018-2035 (USD THOUSAND)
TABLE 45 NORTH AMERICA CITRATE BUFFERS IN BIOLOGICAL BUFFERS MARKET, BY TYPE, 2018-2035 (USD THOUSAND)
TABLE 46 NORTH AMERICA AMINO ACID BUFFERS IN BIOLOGICAL BUFFERS MARKET, BY TYPE, 2018-2035 (USD THOUSAND)
TABLE 47 NORTH AMERICA BIOLOGICAL BUFFERS MARKET, BY FORMULATION, 2018-2035 (USD THOUSAND)
TABLE 48 NORTH AMERICA BIOLOGICAL BUFFERS MARKET, BY APPLICATION, 2018-2035 (USD THOUSAND)
TABLE 49 NORTH AMERICA PHARMACEUTICAL & BIOPHARMACEUTICALS IN BIOLOGICAL BUFFERS MARKET, BY TYPE, 2018-2035 (USD THOUSAND)
TABLE 50 NORTH AMERICA CELL CULTURE & MOLECULAR BIOLOGY IN BIOLOGICAL BUFFERS MARKET, BY TYPE, 2018-2035 (USD THOUSAND)
TABLE 51 NORTH AMERICA CLINICAL & DIAGNOSTIC APPLICATIONS IN BIOLOGICAL BUFFERS MARKET, BY TYPE, 2018-2035 (USD THOUSAND)
TABLE 52 NORTH AMERICA CHEMICAL & INDUSTRIAL APPLICATIONS IN BIOLOGICAL BUFFERS MARKET, BY TYPE, 2018-2035 (USD THOUSAND)
TABLE 53 NORTH AMERICA BIOLOGICAL BUFFERS MARKET, BY END USER, 2018-2035 (USD THOUSAND)
TABLE 54 U.S. BIOLOGICAL BUFFER MARKET, BY BUFFERS TYPE, 2018-2035 (USD THOUSAND)
TABLE 55 U.S. GOODS BUFFERS IN BIOLOGICAL BUFFERS MARKET, BY TYPE, 2018-2035 (USD THOUSAND)
TABLE 56 U.S. TRIS BUFFERS IN BIOLOGICAL BUFFERS MARKET, BY TYPE, 2018-2035 (USD THOUSAND)
TABLE 57 U.S. HEPES BUFFERS IN BIOLOGICAL BUFFERS MARKET, BY TYPE, 2018-2035 (USD THOUSAND)
TABLE 58 U.S. MOPS BUFFERS IN BIOLOGICAL BUFFERS MARKET, BY TYPE, 2018-2035 (USD THOUSAND)
TABLE 59 U.S. MES BUFFERS IN BIOLOGICAL BUFFERS MARKET, BY TYPE, 2018-2035 (USD THOUSAND)
TABLE 60 U.S. BIS-TRIS BUFFERS IN BIOLOGICAL BUFFERS MARKET, BY TREATMENT TYPE, 2018-2035 (USD THOUSAND)
TABLE 61 U.S. OTHER SALT-BASED BUFFERS IN BIOLOGICAL BUFFERS MARKET, BY TYPE, 2018-2035 (USD THOUSAND)
TABLE 62 U.S. PHOSPHATE BUFFERS IN BIOLOGICAL BUFFERS MARKET, BY TYPE, 2018-2035 (USD THOUSAND)
TABLE 63 U.S. ACETATE BUFFERS IN BIOLOGICAL BUFFERS MARKET, BY TYPE, 2018-2035 (USD THOUSAND)
TABLE 64 U.S. CITRATE BUFFERS IN BIOLOGICAL BUFFERS MARKET, BY TYPE, 2018-2035 (USD THOUSAND)
TABLE 65 U.S. AMINO ACID BUFFERS IN BIOLOGICAL BUFFERS MARKET, BY TYPE, 2018-2035 (USD THOUSAND)
TABLE 66 U.S. BIOLOGICAL BUFFERS MARKET, BY FORMULATION, 2018-2035 (USD THOUSAND)
TABLE 67 U.S. BIOLOGICAL BUFFERS MARKET, BY APPLICATION, 2018-2035 (USD THOUSAND)
TABLE 68 U.S. PHARMACEUTICAL & BIOPHARMACEUTICALS IN BIOLOGICAL BUFFERS MARKET, BY TYPE, 2018-2035 (USD THOUSAND)
TABLE 69 U.S. CELL CULTURE & MOLECULAR BIOLOGY IN BIOLOGICAL BUFFERS MARKET, BY TYPE, 2018-2035 (USD THOUSAND)
TABLE 70 U.S. CLINICAL & DIAGNOSTIC APPLICATIONS IN BIOLOGICAL BUFFERS MARKET, BY TYPE, 2018-2035 (USD THOUSAND)
TABLE 71 U.S. CHEMICAL & INDUSTRIAL APPLICATIONS IN BIOLOGICAL BUFFERS MARKET, BY TYPE, 2018-2035 (USD THOUSAND)
TABLE 72 U.S. BIOLOGICAL BUFFER MARKET, BY END USER, 2018-2035 (USD THOUSAND)
TABLE 73 CANADA BIOLOGICAL BUFFERS MARKET, BY BUFFERS TYPE, 2018-2035 (USD THOUSAND)
TABLE 74 CANADA GOODS BUFFERS IN BIOLOGICAL BUFFERS MARKET, BY TYPE, 2018-2035 (USD THOUSAND)
TABLE 75 CANADA TRIS BUFFERS IN BIOLOGICAL BUFFERS MARKET, BY TYPE, 2018-2035 (USD THOUSAND)
TABLE 76 CANADA HEPES BUFFERS IN BIOLOGICAL BUFFERS MARKET, BY TYPE, 2018-2035 (USD THOUSAND)
TABLE 77 CANADA MOPS BUFFERS IN BIOLOGICAL BUFFERS MARKET, BY TYPE, 2018-2035 (USD THOUSAND)
TABLE 78 CANADA MES BUFFERS IN BIOLOGICAL BUFFERS MARKET, BY TYPE, 2018-2035 (USD THOUSAND)
TABLE 79 CANADA BIS-TRIS BUFFERS IN BIOLOGICAL BUFFERS MARKET, BY TREATMENT TYPE, 2018-2035 (USD THOUSAND)
TABLE 80 CANADA OTHER SALT-BASED BUFFERS IN BIOLOGICAL BUFFERS MARKET, BY TYPE, 2018-2035 (USD THOUSAND)
TABLE 81 CANADA PHOSPHATE BUFFERS IN BIOLOGICAL BUFFERS MARKET, BY TYPE, 2018-2035 (USD THOUSAND)
TABLE 82 CANADA ACETATE BUFFERS IN BIOLOGICAL BUFFERS MARKET, BY TYPE, 2018-2035 (USD THOUSAND)
TABLE 83 CANADA CITRATE BUFFERS IN BIOLOGICAL BUFFERS MARKET, BY TYPE, 2018-2035 (USD THOUSAND)
TABLE 84 CANADA AMINO ACID BUFFERS IN BIOLOGICAL BUFFERS MARKET, BY TYPE, 2018-2035 (USD THOUSAND)
TABLE 85 CANADA BIOLOGICAL BUFFERS MARKET, BY FORMULATION, 2018-2035 (USD THOUSAND)
TABLE 86 CANADA BIOLOGICAL BUFFERS MARKET, BY APPLICATION, 2018-2035 (USD THOUSAND)
TABLE 87 CANADA PHARMACEUTICAL & BIOPHARMACEUTICALS IN BIOLOGICAL BUFFERS MARKET, BY TYPE, 2018-2035 (USD THOUSAND)
TABLE 88 CANADA CELL CULTURE & MOLECULAR BIOLOGY IN BIOLOGICAL BUFFERS MARKET, BY TYPE, 2018-2035 (USD THOUSAND)
TABLE 89 CANADA CLINICAL & DIAGNOSTIC APPLICATIONS IN BIOLOGICAL BUFFERS MARKET, BY TYPE, 2018-2035 (USD THOUSAND)
TABLE 90 CANADA CHEMICAL & INDUSTRIAL APPLICATIONS IN BIOLOGICAL BUFFERS MARKET, BY TYPE, 2018-2035 (USD THOUSAND)
TABLE 91 CANADA BIOLOGICAL BUFFERS MARKET, BY END USER, 2018-2035 (USD THOUSAND)
TABLE 92 MEXICO BIOLOGICAL BUFFERS MARKET, BY BUFFERS TYPE, 2018-2035 (USD THOUSAND)
TABLE 93 MEXICO GOODS BUFFERS IN BIOLOGICAL BUFFERS MARKET, BY TYPE, 2018-2035 (USD THOUSAND)
TABLE 94 MEXICO TRIS BUFFERS IN BIOLOGICAL BUFFERS MARKET, BY TYPE, 2018-2035 (USD THOUSAND)
TABLE 95 MEXICO HEPES BUFFERS IN BIOLOGICAL BUFFERS MARKET, BY TYPE, 2018-2035 (USD THOUSAND)
TABLE 96 MEXICO MOPS BUFFERS IN BIOLOGICAL BUFFERS MARKET, BY TYPE, 2018-2035 (USD THOUSAND)
TABLE 97 MEXICO MES BUFFERS IN BIOLOGICAL BUFFERS MARKET, BY TYPE, 2018-2035 (USD THOUSAND)
TABLE 98 MEXICO BIS-TRIS BUFFERS IN BIOLOGICAL BUFFERS MARKET, BY TREATMENT TYPE, 2018-2035 (USD THOUSAND)
TABLE 99 MEXICO OTHER SALT-BASED BUFFERS IN BIOLOGICAL BUFFERS MARKET, BY TYPE, 2018-2035 (USD THOUSAND)
TABLE 100 MEXICO PHOSPHATE BUFFERS IN BIOLOGICAL BUFFERS MARKET, BY TYPE, 2018-2035 (USD THOUSAND)
TABLE 101 MEXICO ACETATE BUFFERS IN BIOLOGICAL BUFFERS MARKET, BY TYPE, 2018-2035 (USD THOUSAND)
TABLE 102 MEXICO CITRATE BUFFERS IN BIOLOGICAL BUFFERS MARKET, BY TYPE, 2018-2035 (USD THOUSAND)
TABLE 103 MEXICO AMINO ACID BUFFERS IN BIOLOGICAL BUFFERS MARKET, BY TYPE, 2018-2035 (USD THOUSAND)
TABLE 104 MEXICO BIOLOGICAL BUFFERS MARKET, BY FORMULATION, 2018-2035 (USD THOUSAND)
TABLE 105 MEXICO BIOLOGICAL BUFFERS MARKET, BY APPLICATION, 2018-2035 (USD THOUSAND)
TABLE 106 MEXICO PHARMACEUTICAL & BIOPHARMACEUTICALS IN BIOLOGICAL BUFFERS MARKET, BY TYPE, 2018-2035 (USD THOUSAND)
TABLE 107 MEXICO CELL CULTURE & MOLECULAR BIOLOGY IN BIOLOGICAL BUFFERS MARKET, BY TYPE, 2018-2035 (USD THOUSAND)
TABLE 108 MEXICO CLINICAL & DIAGNOSTIC APPLICATIONS IN BIOLOGICAL BUFFERS MARKET, BY TYPE, 2018-2035 (USD THOUSAND)
TABLE 109 MEXICO CHEMICAL & INDUSTRIAL APPLICATIONS IN BIOLOGICAL BUFFERS MARKET, BY TYPE, 2018-2035 (USD THOUSAND)
TABLE 110 MEXICO BIOLOGICAL BUFFERS MARKET, BY END USER, 2018-2035 (USD THOUSAND)
List of Figure
FIGURE 1 NORTH AMERICA BIOLOGICAL BUFFERS MARKET: SEGMENTATION
FIGURE 2 NORTH AMERICA BIOLOGICAL BUFFERS MARKET: DATA TRIANGULATION
FIGURE 3 NORTH AMERICA BIOLOGICAL BUFFERS MARKET: DROC ANALYSIS
FIGURE 4 NORTH AMERICA BIOLOGICAL BUFFERS MARKET: NORTH AMERICA VS REGIONAL MARKET ANALYSIS
FIGURE 5 NORTH AMERICA BIOLOGICAL BUFFERS MARKET: COMPANY RESEARCH ANALYSIS
FIGURE 6 NORTH AMERICA BIOLOGICAL BUFFERS MARKET: INTERVIEW DEMOGRAPHICS
FIGURE 7 NORTH AMERICA BIOLOGICAL BUFFERS MARKET: DBMR MARKET POSITION GRID
FIGURE 8 NORTH AMERICA BIOLOGICAL BUFFERS MARKET: MARKET END USER COVERAGE GRID
FIGURE 9 NORTH AMERICA BIOLOGICAL BUFFERS MARKET: VENDOR SHARE ANALYSIS
FIGURE 10 NORTH AMERICA BIOLOGICAL BUFFERS MARKET: SEGMENTATION
FIGURE 11 RISING PREVALENCE OF CHRONIC DISEASES IS EXPECTED TO DRIVE THE NORTH AMERICA BIOLOGICAL BUFFERS MARKET GROWTH IN THE FORECAST PERIOD OF 2025 TO 2035
FIGURE 12 GOODS BUFFERS SEGMENT IS EXPECTED TO ACCOUNT FOR THE LARGEST SHARE OF THE NORTH AMERICA BIOLOGICAL BUFFERS MARKET IN THE FORECAST PERIOD OF 2025 & 2035
FIGURE 13 NORTH AMERICA BIOLOGICAL BUFFERS MARKET EXECUTIVE SUMMARY
FIGURE 14 STRATEGIC DECISIONS
FIGURE 15 DROC
FIGURE 16 NORTH AMERICA BIOLOGICAL BUFFERS MARKET: BY BUFFER TYPE, 2024
FIGURE 17 NORTH AMERICA BIOLOGICAL BUFFERS MARKET: BY BUFFER TYPE, 2025-2035 (USD THOUSAND)
FIGURE 18 NORTH AMERICA BIOLOGICAL BUFFERS MARKET: BY BUFFER TYPE, CAGR (2025-2035)
FIGURE 19 NORTH AMERICA BIOLOGICAL BUFFERS MARKET: BY BUFFER TYPE, LIFELINE CURVE
FIGURE 20 NORTH AMERICA BIOLOGICAL BUFFERS MARKET: BY FORMULATION, 2024
FIGURE 21 NORTH AMERICA BIOLOGICAL BUFFERS MARKET: BY FORMULATION, 2025-2035 (USD THOUSAND)
FIGURE 22 NORTH AMERICA BIOLOGICAL BUFFERS MARKET: BY FORMULATION, CAGR (2025-2035)
FIGURE 23 NORTH AMERICA BIOLOGICAL BUFFERS MARKET: BY FORMULATION, LIFELINE CURVE
FIGURE 24 NORTH AMERICA BIOLOGICAL BUFFERS MARKET: BY APPLICATION, 2024
FIGURE 25 NORTH AMERICA BIOLOGICAL BUFFERS MARKET: BY APPLICATION, 2025-2035 (USD THOUSAND)
FIGURE 26 NORTH AMERICA BIOLOGICAL BUFFERS MARKET: BY APPLICATION, CAGR (2025-2035)
FIGURE 27 NORTH AMERICA BIOLOGICAL BUFFERS MARKET: BY APPLICATION, LIFELINE CURVE
FIGURE 28 NORTH AMERICA BIOLOGICAL BUFFERS MARKET: BY END USER, 2024
FIGURE 29 NORTH AMERICA BIOLOGICAL BUFFERS MARKET: BY END USER, 2025-2035 (USD THOUSAND)
FIGURE 30 NORTH AMERICA BIOLOGICAL BUFFERS MARKET: BY END USER, CAGR (2025-2035)
FIGURE 31 NORTH AMERICA BIOLOGICAL BUFFERS MARKET: BY END USER, LIFELINE CURVE
FIGURE 32 NORTH AMERICA BIOLOGICAL BUFFERS MARKET: SNAPSHOT (2024)
FIGURE 33 NORTH AMERICA BIOLOGICAL BUFFERS MARKET: COMPANY SHARE 2024 (%)
Data collection and base year analysis are done using data collection modules with large sample sizes. The stage includes obtaining market information or related data through various sources and strategies. It includes examining and planning all the data acquired from the past in advance. It likewise envelops the examination of information inconsistencies seen across different information sources. The market data is analysed and estimated using market statistical and coherent models. Also, market share analysis and key trend analysis are the major success factors in the market report. To know more, please request an analyst call or drop down your inquiry.
The key research methodology used by DBMR research team is data triangulation which involves data mining, analysis of the impact of data variables on the market and primary (industry expert) validation. Data models include Vendor Positioning Grid, Market Time Line Analysis, Market Overview and Guide, Company Positioning Grid, Patent Analysis, Pricing Analysis, Company Market Share Analysis, Standards of Measurement, Global versus Regional and Vendor Share Analysis. To know more about the research methodology, drop in an inquiry to speak to our industry experts.
Data Bridge Market Research is a leader in advanced formative research. We take pride in servicing our existing and new customers with data and analysis that match and suits their goal. The report can be customized to include price trend analysis of target brands understanding the market for additional countries (ask for the list of countries), clinical trial results data, literature review, refurbished market and product base analysis. Market analysis of target competitors can be analyzed from technology-based analysis to market portfolio strategies. We can add as many competitors that you require data about in the format and data style you are looking for. Our team of analysts can also provide you data in crude raw excel files pivot tables (Fact book) or can assist you in creating presentations from the data sets available in the report.


