
North America Biometrics In Government Market
Market Size in USD Billion
 USD
5.54 Billion
USD
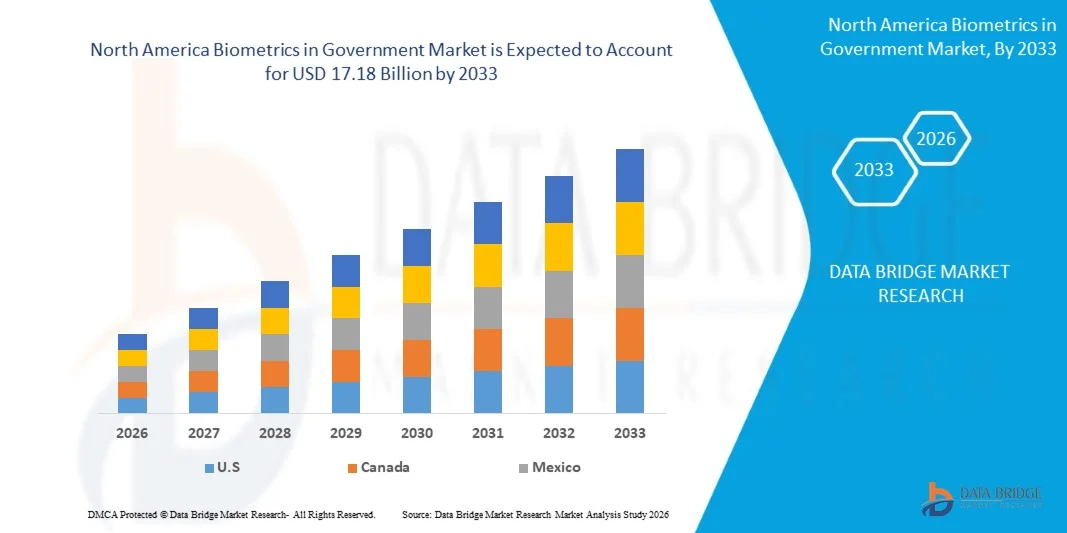
17.18 Billion
2025
2033
USD
5.54 Billion
USD
17.18 Billion
2025
2033
| 2026 - 2033 | |
| USD 5.54 Billion | |
| USD 17.18 Billion | |
| % | |
|
North America Biometrics in Government Market Size
- The North America biometrics in government market size was valued at USD 5.54 billion in 2025 and is expected to reach USD 17.18 billion by 2033, at a CAGR of 15.20% during the forecast period
- The market growth is largely fuelled by the increasing need for secure identity verification systems across border control, national ID programs, and law enforcement agencies
- Rising concerns over cybersecurity threats, identity fraud, and terrorism are accelerating adoption of advanced biometric authentication technologies such as fingerprint, facial recognition, iris, and multimodal systems
North America Biometrics in Government Market Analysis
- The market is witnessing steady expansion driven by government investments in national identification systems, smart passports, voter registration platforms, and public safety databases aimed at enhancing transparency and reducing fraud
- In addition, integration of artificial intelligence and cloud-based biometric platforms is improving accuracy, scalability, and real-time authentication capabilities, enabling governments to strengthen border security and citizen service delivery systems
- U.S. dominated the biometrics in government market in North America with the largest revenue share in 2025, driven by extensive deployment across federal agencies, defense departments, and homeland security programs
- Canada is expected to witness the highest compound annual growth rate (CAGR) in the North America biometrics in government market due to expanding digital governance initiatives and modernization of immigration and border management systems. Increasing investments in secure digital identity frameworks, e-passport programs, and advanced contactless biometric verification technologies are accelerating market growth across government institutions
- The Fingerprint Recognition segment held the largest market revenue share in 2025 driven by its long-standing adoption in national ID programs, border control systems, and law enforcement databases. Fingerprint systems are widely preferred due to their proven accuracy, cost-effectiveness, and ease of integration with existing government infrastructure
Report Scope and North America Biometrics in Government Market Segmentation
|
Attributes |
North America Biometrics in Government Key Market Insights |
|
Segments Covered |
|
|
Countries Covered |
North America
|
|
Key Market Players |
• IDEMIA (U.S.) |
|
Market Opportunities |
• Expansion Of National Digital Identity And E-Governance Programs |
|
Value Added Data Infosets |
In addition to the insights on market scenarios such as market value, growth rate, segmentation, geographical coverage, and major players, the market reports curated by the Data Bridge Market Research also include in-depth expert analysis, geographically represented company-wise production and capacity, network layouts of distributors and partners, detailed and updated price trend analysis and deficit analysis of supply chain and demand. |
North America Biometrics in Government Market Trends
“Rising Adoption of Digital Identity and Border Security Solutions”
• The growing emphasis on secure and reliable identity verification systems is significantly shaping the biometrics in government market, as public sector agencies increasingly prioritize advanced authentication technologies to combat identity fraud and unauthorized access. Biometric systems such as fingerprint, facial recognition, iris scanning, and multimodal platforms are gaining traction due to their accuracy, efficiency, and ability to strengthen national security frameworks
• Increasing investment in digital identity programs, e-passports, voter registration systems, and border control modernization is accelerating the deployment of biometric technologies across government institutions. Authorities are focusing on enhancing citizen data management, reducing duplication in welfare distribution, and improving transparency in public administration through secure biometric databases
• Government initiatives supporting smart governance and digital transformation are influencing procurement strategies, with agencies emphasizing scalable cloud-based platforms, AI-enabled analytics, and real-time authentication capabilities. These advancements are helping public institutions streamline operations, enhance surveillance capabilities, and strengthen public trust through secure and transparent systems
• For instance, in 2024, multiple government agencies globally expanded biometric-enabled national ID and border management programs to enhance authentication accuracy and reduce identity fraud. These initiatives included upgrades to facial recognition algorithms and integration of multimodal biometric databases, improving operational efficiency and citizen verification processes
• While demand for biometric solutions in government is increasing, sustained market growth depends on continuous technological innovation, data protection compliance, and maintaining high accuracy standards while addressing privacy concerns and cybersecurity risks
North America Biometrics in Government Market Dynamics
Driver
“Growing Demand for Secure Identity Verification and Public Safety Enhancement”
• Rising concerns regarding identity theft, cybercrime, and national security threats are major drivers for the biometrics in government market. Public sector authorities are increasingly deploying biometric authentication systems to strengthen border control, law enforcement investigations, and national identity management programs
• Expanding adoption of biometric-enabled passports, e-visa systems, and secure access control solutions is influencing market growth. These technologies improve verification speed and reduce reliance on traditional identification methods, enhancing efficiency and minimizing fraud risks across government operations
• Governments are actively promoting biometric integration within digital governance platforms to improve service delivery, welfare distribution accuracy, and secure citizen authentication. Investments in AI-powered facial recognition and fingerprint identification technologies are further supporting system reliability and scalability
• For instance, in 2023, several national administrations upgraded biometric voter registration and immigration control systems to improve transparency and prevent identity duplication. These enhancements contributed to stronger public safety infrastructure and improved administrative accountability
• Although increasing security demands support market expansion, broader adoption depends on regulatory compliance, cybersecurity resilience, and effective data management frameworks to ensure privacy protection and system interoperability
Restraint/Challenge
“Privacy Concerns and High Implementation Costs”
• Data privacy concerns and regulatory compliance requirements remain significant challenges in the biometrics in government market. Collection and storage of sensitive biometric data require strict adherence to data protection laws, which can delay project implementation and increase administrative complexity
• High initial investment costs associated with biometric hardware installation, database integration, and infrastructure upgrades limit adoption, particularly in resource-constrained public institutions. Maintenance, cybersecurity safeguards, and periodic system updates further add to operational expenditure
• Technical challenges such as false positives, system interoperability issues, and integration with legacy government databases can affect efficiency and public confidence. Ensuring consistent accuracy across diverse demographic populations also requires continuous algorithm refinement
• For instance, in 2024, certain government modernization projects experienced implementation delays due to data protection reviews and procurement constraints related to biometric surveillance systems. These challenges highlighted the importance of balanced regulation, transparency, and public communication in large-scale biometric deployments
• Addressing these challenges will require cost optimization strategies, robust encryption standards, and comprehensive legal frameworks to protect citizen data. Strengthening public awareness and investing in secure, interoperable platforms will be essential for long-term adoption and sustainable growth in the biometrics in government market
North America Biometrics in Government Market Scope
The market is segmented on the basis of mode, components, type, authentication, and application.
• By Mode
On the basis of mode, the biometrics in government market is segmented into Fingerprint Recognition, Face Recognition, Iris Recognition, Palm Print Recognition, Vein Recognition, Signature Recognition, Voice Recognition, and Others. The Fingerprint Recognition segment held the largest market revenue share in 2025 driven by its long-standing adoption in national ID programs, border control systems, and law enforcement databases. Fingerprint systems are widely preferred due to their proven accuracy, cost-effectiveness, and ease of integration with existing government infrastructure.
The Face Recognition segment is expected to witness the fastest growth rate from 2026 to 2033, driven by advancements in artificial intelligence, real-time surveillance capabilities, and increasing deployment in public safety and smart governance initiatives. Facial recognition technologies enable contactless identification and rapid authentication, making them suitable for large-scale government applications.
• By Components
On the basis of components, the market is segmented into Hardware and Software. The Hardware segment held the largest market revenue share in 2025 due to extensive deployment of biometric scanners, cameras, sensors, and enrollment devices across government facilities. Large-scale procurement for border checkpoints, voter registration centers, and national identification projects continues to support hardware demand.
The Software segment is expected to witness the fastest growth rate from 2026 to 2033 driven by increasing integration of AI-powered algorithms, cloud-based biometric databases, and analytics platforms. Governments are prioritizing scalable and interoperable software solutions to enhance system accuracy, data security, and real-time verification capabilities.
• By Type
On the basis of type, the market is segmented into Contactless, Contact-based, and Hybrid/Multimodal. The Contact-based segment held the largest market revenue share in 2025 supported by widespread deployment of fingerprint and signature recognition systems in administrative and law enforcement operations. These systems are considered reliable and cost-efficient for structured identification processes.
The Hybrid/Multimodal segment is expected to witness the fastest growth rate from 2026 to 2033 due to increasing demand for higher authentication accuracy and fraud prevention. Combining multiple biometric modalities enhances verification reliability and reduces false acceptance or rejection rates in critical government applications.
• By Authentication
On the basis of authentication, the market is segmented into Single Factor Authentication and Multiple Factor Authentication. The Single Factor Authentication segment held the largest market revenue share in 2025 owing to its extensive use in basic identification programs and civil registration systems. Governments continue to deploy single biometric identifiers for routine verification tasks due to operational simplicity.
The Multiple Factor Authentication segment is expected to witness the fastest growth rate from 2026 to 2033 driven by heightened security requirements and increasing concerns regarding identity fraud and cyber threats. Integration of biometric verification with additional credentials enhances overall system security and compliance with data protection standards.
• By Application
On the basis of application, the market is segmented into Civil, Military, Law Enforcement, E-Passport, E-Visas, Commercial, and Others. The Civil segment held the largest market revenue share in 2025 driven by large-scale national ID enrollment programs, voter registration systems, and public welfare distribution platforms. Civil applications account for significant biometric database expansion globally.
The Law Enforcement segment is expected to witness the fastest growth rate from 2026 to 2033 supported by increasing deployment of biometric identification systems for criminal investigation, surveillance, and forensic analysis. Rising investment in secure and real-time authentication solutions is strengthening adoption across public safety agencies.
North America Biometrics in Government Market Regional Analysis
• U.S. dominated the biometrics in government market in North America with the largest revenue share in 2025, driven by extensive deployment across federal agencies, defense departments, and homeland security programs
• Government institutions in the country strongly emphasize multi-factor authentication, large-scale biometric databases, and advanced surveillance systems to strengthen national security frameworks
• Continuous technological advancements, high public sector spending, and early adoption of multimodal biometric solutions further reinforce the country’s leading market position
Canada Biometrics in Government Market Insight
The Canada biometrics in government market is expected to witness the fastest growth rate from 2026 to 2033, supported by expanding digital governance programs and modernization of border management systems. Increasing implementation of biometric verification for immigration, e-passports, and public service access is strengthening demand. Moreover, growing investments in secure digital identity infrastructure and compliance with data protection standards are contributing to accelerated adoption across government departments.
North America Biometrics in Government Market Share
The North America biometrics in government industry is primarily led by well-established companies, including:
• IDEMIA (U.S.)
• NEC Corporation of America (U.S.)
• HID Global Corporation (U.S.)
• M2SYS Technology (U.S.)
• Aware, Inc. (U.S.)
• BIO-key International, Inc. (U.S.)
• Cognitec Systems Corporation (U.S.)
• Iris ID Systems, Inc. (U.S.)
• Daon, Inc. (U.S.)
• SecuGen Corporation (U.S.)
• Suprema America LLC (U.S.)
• Crossmatch Technologies (U.S.)
• Integrated Biometrics, LLC (U.S.)
• ImageWare Systems, Inc. (U.S.)
• Nuance Communications, Inc. (U.S.)
SKU-

- Interactive Data Analysis Dashboard
- Company Analysis Dashboard for high growth potential opportunities
- Research Analyst Access for customization & queries
- Competitor Analysis with Interactive dashboard
- Latest News, Updates & Trend analysis
- Harness the Power of Benchmark Analysis for Comprehensive Competitor Tracking
North America Biometrics In Government Market, Supply Chain Analysis and Ecosystem Framework
To support market growth and help clients navigate the impact of geopolitical shifts, DBMR has integrated in-depth supply chain analysis into its North America Biometrics In Government Market research reports. This addition empowers clients to respond effectively to global changes affecting their industries. The supply chain analysis section includes detailed insights such as North America Biometrics In Government Market consumption and production by country, price trend analysis, the impact of tariffs and geopolitical developments, and import and export trends by country and HSN code. It also highlights major suppliers with data on production capacity and company profiles, as well as key importers and exporters. In addition to research, DBMR offers specialized supply chain consulting services backed by over a decade of experience, providing solutions like supplier discovery, supplier risk assessment, price trend analysis, impact evaluation of inflation and trade route changes, and comprehensive market trend analysis.
Data collection and base year analysis are done using data collection modules with large sample sizes. The stage includes obtaining market information or related data through various sources and strategies. It includes examining and planning all the data acquired from the past in advance. It likewise envelops the examination of information inconsistencies seen across different information sources. The market data is analysed and estimated using market statistical and coherent models. Also, market share analysis and key trend analysis are the major success factors in the market report. To know more, please request an analyst call or drop down your inquiry.
The key research methodology used by DBMR research team is data triangulation which involves data mining, analysis of the impact of data variables on the market and primary (industry expert) validation. Data models include Vendor Positioning Grid, Market Time Line Analysis, Market Overview and Guide, Company Positioning Grid, Patent Analysis, Pricing Analysis, Company Market Share Analysis, Standards of Measurement, Global versus Regional and Vendor Share Analysis. To know more about the research methodology, drop in an inquiry to speak to our industry experts.
Data Bridge Market Research is a leader in advanced formative research. We take pride in servicing our existing and new customers with data and analysis that match and suits their goal. The report can be customized to include price trend analysis of target brands understanding the market for additional countries (ask for the list of countries), clinical trial results data, literature review, refurbished market and product base analysis. Market analysis of target competitors can be analyzed from technology-based analysis to market portfolio strategies. We can add as many competitors that you require data about in the format and data style you are looking for. Our team of analysts can also provide you data in crude raw excel files pivot tables (Fact book) or can assist you in creating presentations from the data sets available in the report.


