
North America Biosensors Market
Market Size in USD Million
 USD
710.29 Million
USD
1,222.81 Million
2025
2033
USD
710.29 Million
USD
1,222.81 Million
2025
2033
| 2026 - 2033 | |
| USD 710.29 Million | |
| USD 1,222.81 Million | |
| % | |
|
North America Biosensors Market Size
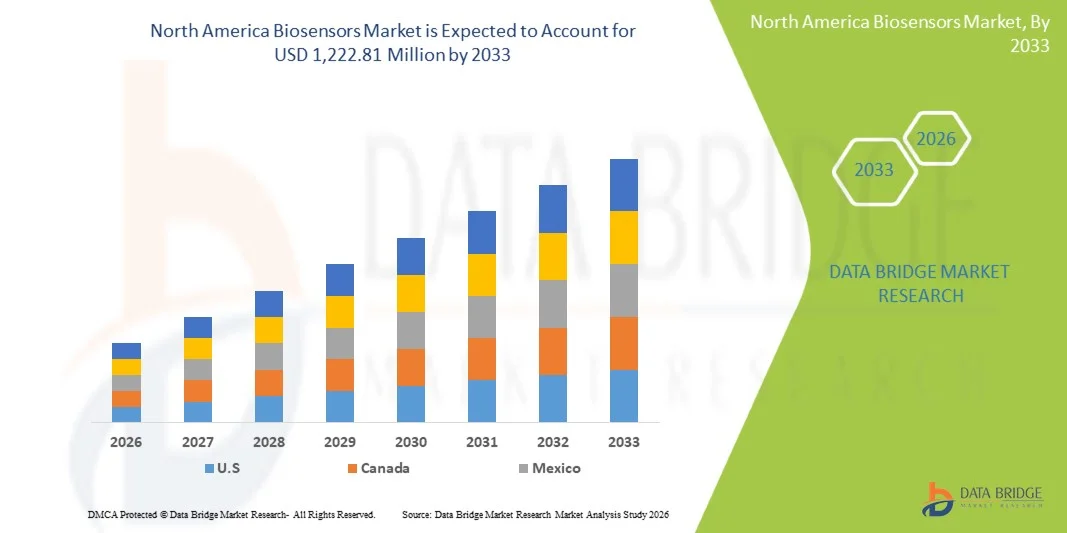
- The North America Biosensors market was valued at USD 710.29 million in 2025 and is expected to reach USD 1,222.81 million by 2033, growing with a substantial CAGR of 7.6% in the forecast period of 2026 to 2033.
- The market is primarily driven by the rising demand for rapid, cost-effective, and highly sensitive diagnostic and bioprocess monitoring solutions. Key adoption areas include point-of-care testing, continuous glucose monitoring, cell and gene therapy process monitoring, and real-time biomanufacturing analytics across clinical, research, and pharmaceutical settings.
- Sustained market expansion is supported by ongoing advancements in microfluidics, AI-enabled biosensing, wearable biosensors, and integrated digital health platforms, along with increasing availability of connected monitoring systems. Favorable regulatory support, growing investments in precision medicine and advanced therapeutics, and the increasing emphasis on early disease detection, process optimization, and personalized healthcare are strengthening the overall market outlook in North America.
North America Biosensors Market Analysis
- The North America Biosensors market is witnessing steady advancement as solution providers increasingly focus on technological innovation, bioprocess efficiency, and application-specific optimization to address evolving clinical and biomanufacturing requirements. Biosensor developers are leveraging microfluidics, AI-driven analytics, IoT-enabled sensing platforms, and advanced automation systems to enhance real-time monitoring, process control, biomarker detection, and quality assurance across cell and gene therapy workflows, pharmaceutical manufacturing, and clinical diagnostics. Integration of digital dashboards, real-time data connectivity, and cloud-based analytics platforms is further shaping product development strategies across the region.
- These advancements are strengthening the regional biosensors value chain by improving operational efficiency, scalability, and decision accuracy while reducing batch failures, manual intervention, and overall manufacturing costs. Expanding direct sales channels, distributor networks, strategic partnerships with biopharma companies, and collaborations with contract development and manufacturing organizations (CDMOs) are enabling faster market penetration and improved end-user access. Rising adoption of biosensor solutions across cell therapy production, gene therapy analytics, point-of-care diagnostics, and continuous bioprocess monitoring—supported by favorable regulatory frameworks, innovation funding, and advanced therapy initiatives—is further enhancing market accessibility.
- S. dominated the North America biosensors market with the largest revenue share of 81.41% in 2026, supported by its strong biopharmaceutical manufacturing base, advanced research infrastructure, high adoption of process analytical technologies, and sustained investments in cell and gene therapy development and precision diagnostics.
- The Canada is projected to be the fastest-growing market, registering a CAGR of 8.4%, driven by expanding advanced therapy pipelines, increasing adoption of real-time bioprocess monitoring, strong academic–industry collaborations, and supportive government initiatives promoting life sciences innovation and digital health integration.
- In 2025, the Biosensors for Cell Therapies segment dominated the North America biosensors market with a 70.28% share, reflecting strong demand for real-time cell culture monitoring, metabolite sensing, viability assessment, and closed-loop bioprocess control solutions. Widespread use across cell manufacturing workflows, quality control, and process optimization—combined with continuous technological innovation and digital integration—continues to reinforce the segment’s leadership within the North America Biosensors market.
Report Scope in North America Biosensors Market Segmentation
|
Attributes |
North AmericaBiosensors Key Market Insights |
|
Segments Covered |
|
|
Country Covered |
North America · U.S. · Canada · Mexico |
|
Key Market Players |
· PreSens Precision Sensing GmbH (Germany) · ABSELION (U.K.) · PROGEN (Germany) · Aber Instruments Ltd (U.K.) · Cytiva (U.S.) · ABBOTT LABORATORIES (U.S.) · BIO-RAD LABORATORIES (U.S.) · Myriade (France) · Unchained Labs (U.S.) · IST AG (Switzerland) · Nova Biomedical (U.S.) · YSI Inc. (part of Xylem Inc.) (U.S.) · NANOENTEK INC. (South Korea) · ROCHE DIAGNOSTICS (Switzerland) · AAVnerGene (U.S.) · Genemedi (China) · Montana Molecular (U.S.) · ProAnalytics, LLC (U.S.) · Universal Biosensors (Australia) · Sartorius AG (Germany) · Agilent Technologies, Inc. (U.S.) · Hillgene Biopharma Co., Ltd. (China) · Sphere Bio - A Fluidic Sciences Ltd Brand (U.K.) · ChemoMetec (Denmark) · Nicoya Lifesciences Inc. (Canada) · Flownamics (U.S.) · NanoTemper Technologies (Germany) · Refeyn Ltd. (U.S.) · Hamilton company (U.S.) · Palmsence (Netherlands) · Evrogen (Russia) · Creative-biolabs (U.S.) · Dynamic-biosensors (Germany) · Quantum biosciences (U.S.) · Merck KGaA (Germany) |
|
Market Opportunities |
· Integration with closed and automated CGT manufacturing platforms · Expansion of point-of-care and decentralized monitoring in CGT · AI-enabled predictive bioprocess control |
|
Value Added Data Infosets |
In addition to the insights on market scenarios such as market value, growth rate, segmentation, geographical coverage, and major players, the market reports curated by the Data Bridge Market Research also include in-depth expert analysis, patient epidemiology, pipeline analysis, pricing analysis, and regulatory framework. |
North America Biosensors Market Trends
“Integration With Closed and Automated CGT Manufacturing Platforms”
- Integration of advanced biosensors into closed and automated cell and gene therapy (CGT) manufacturing platforms represents a strategic opportunity to accelerate process development, enhance product quality, and enable scalable production. Automated platforms that embed biosensor data into live control systems reduce reliance on manual sampling, improve reproducibility, and support real‑time closed‑loop process control—a critical requirement for high‑value biologics and CGT products.
- Several companies from the biosensor and bioprocessing ecosystem have publicly highlighted press release collaborations and product innovations that align with this trend:
- In January 2026, Cytiva’s automation collaborations for CGT manufacturing: Cytiva entered a collaboration with Cellular Origins to combine its automated Sefia manufacturing technologies with Cellular Origins' Constellation robotic platform. The two systems are engineered to interface seamlessly for fully automated CGT production, including digital controls, analytics, and digital interconnection across quality systems, removing the need for manual intervention during critical manufacturing steps. GMP‑ready systems are anticipated by late 2025.
- In May 2024, Sartorius announced an expanded collaboration with NVIDIA to integrate advanced AI and predictive analytics into life‑science instruments and manufacturing tools. Although the press release focuses on drug discovery, the integrated use of AI‑driven analytics within bioprocessing workflows points to increased integration of data‑centric sensing, predictive models, and process automation within future CGT manufacturing setups
- In summary, these company press releases underscore a clear industry movement toward biosensor integration within automated, information rich manufacturing environments. By enabling continuous, automated sampling, analysis, and control, biosensors are poised to become core components of closed CGT production workflows, supporting enhanced process control, reduced operator burden, and improved product quality—all of which are key drivers of wider adoption and market expansion in the biopharmaceutical and cell and gene therapy manufacturing sectors.
North America Biosensors Market Dynamics
Driver
“Shift Toward Real-Time and Continuous Bioprocess Monitoring”
- The North America biosensor market for Cell and Gene Therapy (CGT) is undergoing a fundamental transformation, moving away from labor-intensive offline sampling toward Real-Time and Continuous Bioprocess Monitoring. Historically, CGT manufacturing relied on discrete "grab-sampling," where media was manually extracted and sent to a lab for analysis—a process that introduces contamination risks and "dead time" where critical deviations can occur unnoticed.
- As of 2026, the industry is adopting Process Analytical Technology (PAT) to achieve "Pharma 4.0" standards, where biosensors are integrated directly into closed-loop systems to provide instantaneous feedback on cell health and metabolic activity.
- The demand for real-time monitoring is fueled by the need to reduce the high cost of goods (COGS) in CGT, where a single failed batch of CAR-T cells can represent a loss of USD 300,000 to USD 500,000 in manufacturing costs alone. Government regulatory bodies, led by the U.S. FDA, have issued specific guidance to encourage the adoption of continuous monitoring to ensure product safety and "Quality by Design" (QbD)
- In December 2025, the FDA released final guidance on "Processes and Practices Applicable to Bioresearch Monitoring Inspections". This guidance emphasizes the importance of data integrity and the use of automated, real-time records to replace error-prone manual logs.
- In June 2025, the UK government opened Digital and Automation Testbeds specifically designed to help CGT manufacturers integrate real-time biosensors into automated manufacturing workflows to increase global patient access.
- The shift toward continuous monitoring allows for closed-loop control, where the biosensor detects a nutrient drop and automatically triggers the bioreactor to feed the cells. This reduces human error—a factor responsible for roughly 50% of batch deviations in personalized medicine—and ensures that every dose of gene therapy meets the exact potency requirements for the patient.
Restraints/Challenges
“Limited Sensitivity and Cross-Reactivity Issues”
- A significant restraint on the growth of the global biosensor market—especially for cell and gene therapy (CGT) applications—is the persistent challenge in achieving high analytical sensitivity and avoiding cross‑reactivity in complex biological environments. Biosensors used in CGT settings (e.g., real‑time monitoring of therapeutic vectors, immune biomarkers, or minimal residual disease) must reliably detect ultra‑low analyte concentrations and discriminate target molecules from a milieu of similar substances. However, many current technologies demonstrate performance gaps, leading to false positives and false negatives, increasing reliance on confirmatory laboratory assays and slowing clinical adoption.
- In complex samples such as blood or plasma, matrix effects and nonspecific interactions can degrade signal fidelity, inhibiting accurate target detection and diminishing sensitivity. Studies note that serum components can almost completely inhibit reporter production (>98%) in cell‑free biosensing systems, evidencing how real samples can suppress intended assay signals.
- In March 2023, The U.S. Food and Drug Administration (FDA) issued a Class I recall of ~2.7 million lateral‑flow biosensor kits after buffer contamination was found to potentially impact test performance and produce inaccurate results (false positives/negatives), underscoring how sensitivity and signal integrity issues can lead to major product actions.
- In the development of their ATHENA capsid platform, AAVnerGene must manage the fact that different AAV serotypes (e.g., AAV1, AAV6, and AAV10) share 60–90% sequence identity.
- In January 2024, an article was published on PNAS, A major limitation in metabolic biosensors has been the cross-reactivity between aspartate and glutamate. Researchers developed jAspSnFR3, a fluorescent biosensor specifically for aspartate. By introducing two point mutations (S27A and S72P) into the binding domain, they rendered the sensor highly specific for Asp while making it completely insensitive to glutamate. This optimization provided excellent discrimination against other analytes with affinities ranging from 4uM to 500 uM, allowing for real-time imaging of previously "un-trackable" nutrient dynamics.
- Limited sensitivity and cross‑reactivity remain critical restraints on the global biosensor market, particularly in cell and gene therapy applications. These technical challenges compromise the accuracy and reliability of biosensors in complex biological matrices, necessitating confirmatory testing and slowing clinical adoption. Real-world examples—from FDA recalls of contaminated rapid tests to the need for serotype-specific monitoring in AAV platforms—highlight the tangible impact on product performance and regulatory compliance. While innovative solutions, such as engineered point mutations in metabolic biosensors (e.g., jAspSnFR3), demonstrate that specificity improvements are achievable, these issues continue to restrict market growth and underscore the need for further technological advancements in sensitivity, selectivity, and real-time detection capabilities
North America Biosensors Market Scope
North America biosensors market is categorized into two notable segments which are based on therapy modality, and analytical sensor.
- By Therapy Modality
On the basis of therapy modality, the North America biosensors market is segmented into biosensors for cell therapies and biosensors for gene therapies.
In 2026, the biosensors for cell therapies segment is expected to dominate the market with a 70.45% share, driven by the expanding commercialization of cell-based therapies and the growing need for real-time, high-precision bioprocess monitoring. Increasing deployment across cell therapy manufacturing workflows—including cell culture monitoring, metabolite sensing, and viability assessment—along with strong investments in advanced therapy medicinal products (ATMPs), continues to reinforce the segment’s leadership in the region.
The biosensors for cell therapies segment is expected to be the fastest-growing, registering a CAGR of 7.9% in the North America biosensors market. Growth is driven by rising demand for closed-loop process control, scalable manufacturing platforms, and automated quality monitoring systems that enable data-driven bioprocess optimization and regulatory compliance. Increasing adoption among biopharmaceutical companies, contract development and manufacturing organizations (CDMOs), and research institutes—along with expanding integration of cloud connectivity, digital twins, and AI-enabled analytics—is expected to further accelerate market penetration across North America.
- By Analytical Sensor
On the basis of analytical sensor, the North America biosensors market is segmented into upstream bioprocess monitoring, downstream processing & purification analytics, critical quality attribute (CQA) monitoring, and potency & functional activity assays.
In 2026, the upstream bioprocess monitoring segment is expected to dominate the market with a 44.01% share, driven by its critical role in real-time cell culture monitoring, metabolite tracking, and process optimization during early-stage biomanufacturing. Strong adoption across biopharmaceutical manufacturers, cell and gene therapy developers, and CDMOs supported by the need to reduce batch failures, improve yield consistency, and enable scalable closed-system production—continues to reinforce the segment’s leadership in North America.
The critical quality attribute (CQA) monitoring segment is expected to be the fastest-growing, registering a CAGR of 8.2% in the North America Biosensors market. Growth is driven by increasing regulatory emphasis on product quality, comparability, and real-time release testing for advanced therapies. Rising demand for high-sensitivity biosensors that enable continuous monitoring of potency, purity, identity, and safety attributes combined with expanding adoption of process analytical technology (PAT), AI-enabled analytics, and digital biomanufacturing platforms is expected to further accelerate market expansion across the North America region.
North America Biosensor Market Regional Analysis
- The North America biosensors market is witnessing consistent growth, supported by increasing investments in biopharmaceutical research, precision medicine, and advanced diagnostic technologies across the region. Expanding government initiatives to strengthen healthcare infrastructure, rising focus on biomanufacturing capabilities, and growing adoption of cell and gene therapy development are accelerating market expansion. In addition, the integration of real-time monitoring systems, microfluidics, IoT-connected biosensors, and laboratory automation technologies is enhancing process optimization, quality control, and regulatory compliance.
- The U.S. biosensors market is experiencing steady growth, driven by the country’s expanding focus on advanced biomanufacturing, precision diagnostics, and cell and gene therapy development. Strong government support for life sciences innovation, rising investments in biopharmaceutical R&D, and modernization of laboratory and manufacturing infrastructure are improving adoption rates. Additionally, the growing use of real-time analytics, microfluidic platforms, IoT-enabled biosensing systems, and automation technologies continues to strengthen U.S. position within the North America Biosensors market—particularly in addressing process efficiency, product quality assurance, and regulatory compliance in advanced therapy production.
Canada Biosensors Market Insight
The Canada biosensors market is expected to expand steadily, supported by increasing emphasis on biopharmaceutical productivity, advanced therapy development, and digital transformation in life sciences. Rising adoption of real-time bioprocess monitoring, process analytical technologies (PAT), and high-sensitivity diagnostic biosensors—along with expanding access through collaborations between biopharma companies, research institutes, and CDMOs—is supporting market development. Furthermore, growing demand for cost-effective, scalable, and easy-to-integrate biosensor platforms is driving sustained adoption across both clinical research and commercial manufacturing environments, particularly in cell and gene therapy workflows and precision medicine.
Mexico Biosensor Market Insight
The Mexico biosensors market is gradually expanding, supported by the country’s growing emphasis on healthcare innovation, biomedical research, and advanced diagnostic capabilities. Increasing investments in life sciences, alongside improvements in laboratory infrastructure and pharmaceutical manufacturing, are contributing to higher adoption of biosensing technologies. The market is also benefiting from the rising demand for rapid disease detection, real-time monitoring solutions, and automated analytical systems across healthcare and research institutions.
The Major Market Leaders Operating in the Market Are:
- PreSens Precision Sensing GmbH (Germany)
- ABSELION (U.K.)
- PROGEN (Germany)
- Aber Instruments Ltd (U.K.)
- Cytiva (U.S.)
- ABBOTT LABORATORIES (U.S.)
- BIO-RAD LABORATORIES (U.S.)
- Myriade (France)
- Unchained Labs (U.S.)
- IST AG (Switzerland)
- Nova Biomedical (U.S.)
- YSI Inc. (part of Xylem Inc.) (U.S.)
- NANOENTEK INC. (South Korea)
- ROCHE DIAGNOSTICS (Switzerland)
- AAVnerGene (U.S.)
- Genemedi (China)
- Montana Molecular (U.S.)
- ProAnalytics, LLC (U.S.)
- Universal Biosensors (Australia)
- Sartorius AG (Germany)
- Agilent Technologies, Inc. (U.S.)
- Hillgene Biopharma Co., Ltd. (China)
- Sphere Bio - A Fluidic Sciences Ltd Brand (U.K.)
- ChemoMetec (Denmark)
- Nicoya Lifesciences Inc. (Canada)
- Flownamics (U.S.)
- NanoTemper Technologies (Germany)
- Refeyn Ltd. (U.S.)
- Hamilton company (U.S.)
- Palmsence (Netherlands)
- Evrogen (Russia)
- Creative-biolabs (U.S.)
- Dynamic-biosensors (Germany)
- Quantum biosciences (U.S.)
- Merck KGaA (Germany)
Latest Developments in North America Biosensors
- In May 2025, Sartorius AG announced the launch of the Octet R8e biolayer interferometry (BLI) system, expanding its label-free biomolecular analysis portfolio. The new platform delivers enhanced sensitivity and broader dynamic range, enabling accurate detection of low-molecular-weight and low-abundance analytes for complex biologics workflows. It supports both 96- and 384-well plate formats with sample volumes as low as 40 µL, improving throughput and cost efficiency. The system also incorporates advanced evaporation control for up to 16-hour runtimes, positioning the Octet R8e as a high-performance solution for drug discovery, process development, and biopharmaceutical research.
- In March 2025, Agilent Technologies announced that its xCELLigence Real-Time Cell Analysis (RTCA) platform was applied in support of the FDA approval of the CAR-T therapy AUCATZYL by Autolus Therapeutics. The RTCA technology was used to develop and validate a label-free potency assay, enabling precise real-time monitoring of cell activity critical for regulatory submission. The platform delivers continuous, impedance-based measurements that improve assay robustness and reproducibility. Its successful use in the approval process highlights the growing role of RTCA systems in cell therapy development and quality control workflows.
- In July 2025, Bio Rad Laboratories has broadened its digital PCR offerings by launching four new Droplet Digital PCR (ddPCR) platforms, including the new QX Continuum system and three models in the QX700 series, expanding its genomics research and clinical diagnostics lineup with advanced multiplexing, high throughput and streamlined workflows. This expansion strengthens Bio Rad’s position in the competitive ddPCR market and enhances its appeal to research and clinical labs, likely helping drive future sales growth.
- In May 2024, Abbott’s GLP systems Track, an innovative lab automation solution designed to support high volume analytical workflows, has been launched to help clinical and research laboratories increase throughput and reduce manual handling. The system offers scalable automation with flexible track design and intelligent sample transport. This launch strengthens Abbott’s diagnostics infrastructure and supports complex analytical processes conceptually relevant to CQA monitoring and high volume workflows like those in cell & gene therapy manufacturing
SKU-

- Interactive Data Analysis Dashboard
- Company Analysis Dashboard for high growth potential opportunities
- Research Analyst Access for customization & queries
- Competitor Analysis with Interactive dashboard
- Latest News, Updates & Trend analysis
- Harness the Power of Benchmark Analysis for Comprehensive Competitor Tracking
Table of Content
1 INTRODUCTION
1.1 OBJECTIVES OF THE STUDY
1.2 MARKET DEFINITION
1.3 OVERVIEW OF NORTH AMERICA BIOSENSOR MARKET
1.4 LIMITATIONS
1.5 MARKETS COVERED
2 MARKET SEGMENTATION
2.1 MARKETS COVERED
2.2 GEOGRAPHICAL SCOPE
2.3 YEARS CONSIDERED FOR THE STUDY
2.4 CURRENCY AND PRICING
2.5 DBMR TRIPOD DATA VALIDATION MODEL
2.6 MULTIVARIATE MODELLING
2.7 PRIMARY INTERVIEWS WITH KEY OPINION LEADERS
2.8 DBMR MARKET POSITION GRID
2.9 MARKET APPLICATION COVERAGE GRID
2.1 VENDOR SHARE ANALYSIS
2.11 SECONDARY SOURCES
2.12 ASSUMPTIONS
3 EXECUTIVE SUMMARY
4 PREMIUM INSIGHTS
4.1 PORTER’S FIVE FORCES
4.1.1 THREAT OF NEW ENTRANTS – LOW TO MODERATE
4.1.2 BARGAINING POWER OF SUPPLIERS – MODERATE
4.1.3 BARGAINING POWER OF BUYERS – MODERATE TO HIGH
4.1.4 THREAT OF SUBSTITUTES - MODERATE
4.1.5 COMPETITIVE RIVALRY - HIGH
4.2 PRICING ANALYSIS
4.3 COMPANY COMPARATIVE ANALYSIS –
4.3.1 INTRODUCTION
4.3.2 CONCLUSION:-
4.4 TECHNOLOGY MATRIX
4.4.1 INTRODUCTION
4.4.2 CONCLUSION
4.5 PATENT ANALYSIS
4.6 COMPANY PRODUCT PLATFORM MATRIX
4.6.1 INTRODUCTION
4.6.2 CONCLUSION
4.7 NEW BUSINESS AND EMERGING BUSINESS'S REVENUE OPPORTUNITIES & FUTURE OUTLOOK
4.8 PENETRATION AND GROWTH POSPECT MAPPING
4.9 VALUE CHAIN ANALYSIS
4.9.1 UPSTREAM: RAW MATERIALS AND CRITICAL COMPONENTS
4.9.2 BIOSENSOR DESIGN AND MICROFABRICATION
4.9.3 INSTRUMENTATION AND PLATFORM MANUFACTURING
4.9.4 SOFTWARE, DATA INTEGRITY, AND REGULATORY ENABLEMENT
4.9.5 INTEGRATION INTO CELL & GENE THERAPY WORKFLOWS
4.9.6 END-USER ECONOMICS AND COMMERCIAL MODEL
4.9.7 BOTTOM-LINE VALUE MIGRATION
5 TARIFF & ITS ANALYSIS –
5.1 INTRODUCTION
5.2 OVERVIEW OF RELEVANT TARIFFS
5.3 TRADE POLICIES INFLUENCING THE MARKET
5.4 COST IMPACT ON STAKEHOLDERS
5.5 SUPPLY CHAIN DISRUPTIONS
5.6 STRATEGIC RESPONSE BY OEMS
5.7 CONCLUSION
6 REGULATION COVERAGE
6.1 INTRODUCTION
6.2 CGT-SPECIFIC REGULATORY CONSIDERATIONS
6.3 POST-MARKET SURVEILLANCE AND LIFECYCLE COMPLIANCE
6.4 KEY REGULATORY CHALLENGES IN THE CGT BIOSENSORS MARKET
6.5 OUTLOOK
7 MARKET OVERVIEW
7.1 DRIVERS
7.1.1 RAPID EXPANSION OF CELL & GENE THERAPY MANUFACTURING
7.1.2 SHIFT TOWARD REAL-TIME AND CONTINUOUS BIOPROCESS MONITORING
7.1.3 RISING FOCUS ON PERSONALIZED AND PRECISION MEDICINE
7.1.4 GROWING USE OF BIOSENSORS IN DRUG DISCOVERY AND BIOMEDICINE
7.2 RESTRAINTS
7.2.1 HIGH DEVELOPMENT AND CAPITAL COSTS
7.2.2 LIMITED SENSITIVITY AND CROSS-REACTIVITY ISSUES
7.3 OPPROTUNITIES
7.3.1 INTEGRATION WITH CLOSED AND AUTOMATED CGT MANUFACTURING PLATFORMS
7.3.2 EXPANSION OF POINT-OF-CARE AND DECENTRALIZED MONITORING IN CGT
7.3.3 AI‑ENABLED PREDICTIVE BIOPROCESS CONTROL
7.4 CHALLENGES
7.4.1 STRINGENT REGULATORY REQUIREMENTS FOR CGT MANUFACTURING TOOLS
7.4.2 LACK OF STANDARDIZATION ACROSS BIOSENSOR PLATFORMS
8 NORTH AMERICA BIOSENSOR MARKET, BY THERAPY MODALITY
8.1 OVERVIEW
8.2 NORTH AMERICA BIOSENSOR MARKET, BY THERAPY MODALITY, 2018-2033 (USD THOUSAND)
8.2.1 BIOSENSORS FOR CELL THERAPIES
8.2.2 BIOSENSORS FOR GENE THERAPIES
8.3 NORTH AMERICA BIOSENSORS FOR CELL THERAPIES IN BIOSENSOR MARKET, BY TYPE, 2018-2033 (USD THOUSAND)
8.3.1 CELL VIABILITY SENSORS
8.3.2 CELL PHENOTYPE BIOSENSORS
8.3.3 CELL SURFACE MARKER DETECTION
8.4 NORTH AMERICA BIOSENSORS FOR CELL THERAPIES IN BIOSENSOR MARKET, BY REGION, 2018-2033 (USD THOUSAND)
8.4.1 NORTH AMERICA
8.4.2 EUROPE
8.4.3 ASIA-PACIFIC
8.4.4 SOUTH AMERICA
8.4.5 MIDDLE EAST AND AFRICA
8.5 NORTH AMERICA BIOSENSORS FOR GENE THERAPIES IN BIOSENSOR MARKET, BY TYPE, 2018-2033 (USD THOUSAND)
8.5.1 VIRAL VECTOR TITER BIOSENSORS
8.5.2 CAPSID FULL/EMPTY RATIO SENSORS
8.5.3 GENOME INTEGRITY SENSORS
8.6 NORTH AMERICA BIOSENSORS FOR GENE THERAPIES IN BIOSENSOR MARKET, BY REGION, 2018-2033 (USD THOUSAND)
8.6.1 NORTH AMERICA
8.6.2 EUROPE
8.6.3 ASIA-PACIFIC
8.6.4 SOUTH AMERICA
8.6.5 MIDDLE EAST AND AFRICA
9 NORTH AMERICA BIOSENSOR MARKET, BY ANALYTICAL SENSOR
9.1 OVERVIEW
9.2 NORTH AMERICA BIOSENSOR MARKET, BY ANALYTICAL SENSOR, 2018-2033 (USD THOUSAND)
9.2.1 UPSTREAM BIOPROCESS MONITORING
9.2.2 DOWNSTREAM PROCESSING & PURIFICATION ANALYTICS
9.2.3 CRITICAL QUALITY ATTRIBUTE (CQA) MONITORING
9.2.4 POTENCY & FUNCTIONAL ACTIVITY ASSAYS
9.3 NORTH AMERICA UPSTREAM BIOPROCESS MONITORING IN BIOSENSOR MARKET, BY TYPE, 2018-2033 (USD THOUSAND)
9.3.1 CELL GROWTH & VIABILITY SENSING
9.3.2 METABOLIC PROFILING SENSORS
9.3.3 NUTRIENT CONSUMPTION SENSORS
9.3.4 WASTE METABOLITE ACCUMULATION SENSORS
9.4 NORTH AMERICA UPSTREAM BIOPROCESS MONITORING IN BIOSENSOR MARKET, BY REGION, 2018-2033 (USD THOUSAND)
9.4.1 NORTH AMERICA
9.4.2 EUROPE
9.4.3 ASIA-PACIFIC
9.4.4 SOUTH AMERICA
9.4.5 MIDDLE EAST AND AFRICA
9.5 NORTH AMERICA DOWNSTREAM PROCESSING & PURIFICATION ANALYTICS IN BIOSENSOR MARKET, BY TYPE, 2018-2033 (USD THOUSAND)
9.5.1 CHROMATOGRAPHY PROCESS SENSORS
9.5.2 FILTRATION & CONCENTRATION MONITORING
9.5.3 VIRAL CLEARANCE VALIDATION SENSORS
9.6 NORTH AMERICA DOWNSTREAM PROCESSING & PURIFICATION ANALYTICS IN BIOSENSOR MARKET, BY REGION, 2018-2033 (USD THOUSAND)
9.6.1 NORTH AMERICA
9.6.2 EUROPE
9.6.3 ASIA-PACIFIC
9.6.4 SOUTH AMERICA
9.6.5 MIDDLE EAST AND AFRICA
9.7 NORTH AMERICA CRITICAL QUALITY ATTRIBUTE (CQA) MONITORING IN BIOSENSOR MARKET, BY TYPE, 2018-2033 (USD THOUSAND)
9.7.1 PRODUCT PURITY ASSESSMENT
9.7.2 PRODUCT IDENTITY CONFIRMATION
9.7.3 STRUCTURAL INTEGRITY ANALYSIS
9.8 NORTH AMERICA CRITICAL QUALITY ATTRIBUTE (CQA) MONITORING IN BIOSENSOR MARKET, BY REGION, 2018-2033 (USD THOUSAND)
9.8.1 NORTH AMERICA
9.8.2 EUROPE
9.8.3 ASIA-PACIFIC
9.8.4 SOUTH AMERICA
9.8.5 MIDDLE EAST AND AFRICA
9.9 NORTH AMERICA POTENCY & FUNCTIONAL ACTIVITY ASSAYS IN BIOSENSOR MARKET, BY TYPE, 2018-2033 (USD THOUSAND)
9.9.1 BINDING AFFINITY MEASUREMENTS
9.9.2 BIOACTIVITY VERIFICATION
9.1 NORTH AMERICA POTENCY & FUNCTIONAL ACTIVITY ASSAYS IN BIOSENSOR MARKET, BY REGION, 2018-2033 (USD THOUSAND)
9.10.1 NORTH AMERICA
9.10.2 EUROPE
9.10.3 ASIA-PACIFIC
9.10.4 SOUTH AMERICA
9.10.5 MIDDLE EAST AND AFRICA
10 NORTH AMERICA BIOSENSOR MARKET, BY REGION
10.1 NORTH AMERICA
10.1.1 U.S.
10.1.2 CANADA
10.1.3 MEXICO
11 NORTH AMERICA BIOSENSOR MARKET COMPANY LANDSCAPE
11.1 COMPANY SHARE ANALYSIS: GLOBAL
12 SWOT ANALYSIS
13 COMPANY PROFILE
13.1 SARTORIUS AG
13.1.1 COMPANY SNAPSHOT
13.1.2 REVENUE ANALYSIS
13.1.3 COMPANY SHARE ANALYSIS
13.1.4 PRODUCT PORTFOLIO
13.1.5 RECENT DEVELOPMENT
13.2 AGILENT TECHNOLOGIES, INC.
13.2.1 COMPANY SNAPSHOT
13.2.2 REVENUE ANALYSIS
13.2.3 COMPANY SHARE ANALYSIS
13.2.4 PRODUCT PORTFOLIO
13.2.5 RECENT DEVELOPMENT
13.3 MERCK KGAA
13.3.1 COMPANY SNAPSHOT
13.3.2 REVENUE ANALYSIS
13.3.3 COMPANY SHARE ANALYSIS
13.3.4 PRODUCT PORTFOLIO
13.3.5 RECENT DEVELOPMENT
13.4 BIO-RAD LABORATORIES
13.4.1 COMPANY SNAPSHOT
13.4.2 REVENUE ANALYSIS
13.4.3 COMPANY SHARE ANALYSIS
13.4.4 PRODUCT PORTFOLIO
13.4.5 RECENT DEVELOPMENT
13.5 CYTIVA
13.5.1 COMPANY SNAPSHOT
13.5.2 COMPANY SHARE ANALYSIS
13.5.3 PRODUCT PORTFOLIO
13.5.4 RECENT DEVELOPMENT
13.6 AAVNERGENE
13.6.1 COMPANY SNAPSHOT
13.6.2 PRODUCT PORTFOLIO
13.6.3 RECENT DEVELOPMENT
13.7 ABBOTT
13.7.1 COMPANY SNAPSHOT
13.7.2 REVENUE ANALYSIS
13.7.3 PRODUCT PORTFOLIO
13.7.4 RECENT DEVELOPMENT
13.8 ABER INSTRUMENTS LTD
13.8.1 COMPANY SNAPSHOT
13.8.2 PRODUCT PORTFOLIO
13.8.3 RECENT DEVELOPMENT
13.9 ABSELION
13.9.1 COMPANY SNAPSHOT
13.9.2 PRODUCT PORTFOLIO
13.9.3 RECENT DEVELOPMENT
13.1 CHEMOMETEC
13.10.1 COMPANY SNAPSHOT
13.10.2 REVENUE ANALYSIS
13.10.3 PRODUCT PORTFOLIO
13.10.4 RECENT DEVELOPMENT
13.11 CREATIVE-BIOLABS
13.11.1 COMPANY SNAPSHOT
13.11.2 PRODUCT PORTFOLIO
13.11.3 RECENT DEVELOPMENT
13.12 DYNAMIC-BIOSENSORS
13.12.1 COMPANY SNAPSHOT
13.12.2 PRODUCT PORTFOLIO
13.12.3 RECENT DEVELOPMENT
13.13 EVROGEN
13.13.1 COMPANY SNAPSHOT
13.13.2 PRODUCT PORTFOLIO
13.13.3 RECENT DEVELOPMENT
13.14 FLOWNAMICS
13.14.1 COMPANY SNAPSHOT
13.14.2 PRODUCT PORTFOLIO
13.14.3 RECENT DEVELOPMENT
13.15 GENEMEDI
13.15.1 COMPANY SNAPSHOT
13.15.2 PRODUCT PORTFOLIO
13.15.3 RECENT DEVELOPMENT
13.16 HAMILTON COMPANY
13.16.1 COMPANY SNAPSHOT
13.16.2 PRODUCT PORTFOLIO
13.16.3 RECENT DEVELOPMENT
13.17 HILLGENE BIOPHARMA CO., LTD.
13.17.1 COMPANY SNAPSHOT
13.17.2 PRODUCT PORTFOLIO
13.17.3 RECENT DEVELOPMENT
13.18 IST AG
13.18.1 COMPANY SNAPSHOT
13.18.2 PRODUCT PORTFOLIO
13.18.3 RECENT DEVELOPMENT
13.19 MONTANA MOLECULAR
13.19.1 COMPANY SNAPSHOT
13.19.2 PRODUCT PORTFOLIO
13.19.3 RECENT DEVELOPMENT
13.2 MYRIADE
13.20.1 COMPANY SNAPSHOT
13.20.2 7.3 PRODUCT PORTFOLIO
13.20.3 RECENT DEVELOPMENT
13.21 NANOENTEK INC.
13.21.1 COMPANY SNAPSHOT
13.21.2 REVENUE ANALYSIS
13.21.3 PRODUCT PORTFOLIO
13.21.4 RECENT DEVELOPMENT
13.22 NANOTEMPER TECHNOLOGIES
13.22.1 COMPANY SNAPSHOT
13.22.2 PRODUCT PORTFOLIO
13.22.3 RECENT DEVELOPMENT
13.23 NICOYA LIFESCIENCES INC.
13.23.1 COMPANY SNAPSHOT
13.23.2 PRODUCT PORTFOLIO
13.23.3 RECENT DEVELOPMENT
13.24 NOVA BIOMEDICAL
13.24.1 COMPANY SNAPSHOT
13.24.2 PRODUCT PORTFOLIO
13.24.3 RECENT DEVELOPMENT
13.25 PALMSENCE
13.25.1 COMPANY SNAPSHOT
13.25.2 PRODUCT PORTFOLIO
13.25.3 RECENT DEVELOPMENT
13.26 PRESENS PRECISION SENSING GMBH
13.26.1 COMPANY SNAPSHOT
13.26.2 PRODUCT PORTFOLIO
13.26.3 RECENT DEVELOPMENT
13.27 PROANALYTICS, LLC
13.27.1 COMPANY SNAPSHOT
13.27.2 PRODUCT PORTFOLIO
13.27.3 RECENT DEVELOPMENT
13.28 PROGEN
13.28.1 COMPANY SNAPSHOT
13.28.2 PRODUCT PORTFOLIO
13.28.3 RECENT DEVELOPMENT
13.29 QUANTUM BIOSCIENCES
13.29.1 COMPANY SNAPSHOT
13.29.2 PRODUCT PORTFOLIO
13.29.3 RECENT DEVELOPMENT
13.3 REFEYN LTD.
13.30.1 COMPANY SNAPSHOT
13.30.2 PRODUCT PORTFOLIO
13.30.3 RECENT DEVELOPMENT
13.31 ROCHE DIAGNOSTICS
13.31.1 COMPANY SNAPSHOT
13.31.2 REVENUE ANALYSIS
13.31.3 PRODUCT PORTFOLIO
13.31.4 RECENT DEVELOPMENT
13.32 SPHERE BIO - A FLUIDIC SCIENCES LTD BRAND.
13.32.1 COMPANY SNAPSHOT
13.32.2 PRODUCT PORTFOLIO
13.32.3 RECENT DEVELOPMENT
13.33 UNCHAINED LABS
13.33.1 COMPANY SNAPSHOT
13.33.2 PRODUCT PORTFOLIO
13.33.3 RECENT DEVELOPMENT
13.34 UNIVERSAL BIOSENSORS
13.34.1 COMPANY SNAPSHOT
13.34.2 REVENUE ANALYSIS
13.34.3 PRODUCT PORTFOLIO
13.34.4 RECENT DEVELOPMENT
13.35 YSI INC. (PART OF XYLEM INC.)
13.35.1 COMPANY SNAPSHOT
13.35.2 REVENUE ANALYSIS
13.35.3 PRODUCT PORTFOLIO
13.35.4 RECENT DEVELOPMENT
14 QUESTIONNAIRE
15 RELATED REPORTS
List of Table
TABLE 1 COMPANY COMPARATIVE ANALYSIS
TABLE 2 TECHNOLOGY MATRIX
TABLE 3 COMPANY PRODUCT PLATFORM MATRIX
TABLE 4 UPSTREAM COMPONENT COST STRUCTURE
TABLE 5 ECONOMICS OF CGT BIOSENSOR PLATFORMS
TABLE 6 SOFTWARE VALUE DRIVERS IN CGT BIOSENSORS
TABLE 7 BIOSENSOR PENETRATION BY CGT WORKFLOW STAGE
TABLE 8 TYPICAL CGT BIOSENSOR USAGE ECONOMICS
TABLE 9 COMPARATIVE REGULATORY MATRIX
TABLE 10 NORTH AMERICA BIOSENSOR MARKET, BY THERAPY MODALITY, 2018-2033 (USD THOUSAND)
TABLE 11 NORTH AMERICA BIOSENSOR MARKET, BY THERAPY MODALITY, 2018-2033 (VOLUME IN THOUSAND UNITS)
TABLE 12 NORTH AMERICA BIOSENSORS FOR CELL THERAPIES IN BIOSENSOR MARKET, BY TYPE, 2018-2033 (USD THOUSAND)
TABLE 13 NORTH AMERICA BIOSENSORS FOR CELL THERAPIES IN BIOSENSOR MARKET, BY TYPE, 2018-2033 (VOLUME IN THOUSAND UNITS)
TABLE 14 NORTH AMERICA BIOSENSORS FOR CELL THERAPIES IN BIOSENSOR MARKET, BY REGION, 2018-2033 (USD THOUSAND)
TABLE 15 NORTH AMERICA BIOSENSORS FOR GENE THERAPIES IN BIOSENSOR MARKET, BY TYPE, 2018-2033 (USD THOUSAND)
TABLE 16 NORTH AMERICA BIOSENSORS FOR GENE THERAPIES IN BIOSENSOR MARKET, BY TYPE, 2018-2033 (VOLUME IN THOUSAND UNITS)
TABLE 17 NORTH AMERICA BIOSENSORS FOR GENE THERAPIES IN BIOSENSOR MARKET, BY REGION, 2018-2033 (USD THOUSAND)
TABLE 18 NORTH AMERICA BIOSENSOR MARKET, BY ANALYTICAL SENSOR, 2018-2033 (USD THOUSAND)
TABLE 19 NORTH AMERICA BIOSENSOR MARKET, BY ANALYTICAL SENSOR, 2018-2033 (VOLUME IN THOUSAND UNITS)
TABLE 20 NORTH AMERICA UPSTREAM BIOPROCESS MONITORING IN BIOSENSOR MARKET, BY TYPE, 2018-2033 (USD THOUSAND)
TABLE 21 NORTH AMERICA UPSTREAM BIOPROCESS MONITORING IN BIOSENSOR MARKET, BY TYPE, 2018-2033 (VOLUME IN THOUSAND UNITS)
TABLE 22 NORTH AMERICA UPSTREAM BIOPROCESS MONITORING IN BIOSENSOR MARKET, BY REGION, 2018-2033 (USD THOUSAND)
TABLE 23 NORTH AMERICA DOWNSTREAM PROCESSING & PURIFICATION ANALYTICS IN BIOSENSOR MARKET, BY TYPE, 2018-2033 (USD THOUSAND)
TABLE 24 NORTH AMERICA DOWNSTREAM PROCESSING & PURIFICATION ANALYTICS IN BIOSENSOR MARKET, BY TYPE, 2018-2033 (VOLUME IN THOUSAND UNITS)
TABLE 25 NORTH AMERICA DOWNSTREAM PROCESSING & PURIFICATION ANALYTICS IN BIOSENSOR MARKET, BY REGION, 2018-2033 (USD THOUSAND)
TABLE 26 NORTH AMERICA CRITICAL QUALITY ATTRIBUTE (CQA) MONITORING IN BIOSENSOR MARKET, BY TYPE, 2018-2033 (USD THOUSAND)
TABLE 27 NORTH AMERICA CRITICAL QUALITY ATTRIBUTE (CQA) MONITORING IN BIOSENSOR MARKET, BY TYPE, 2018-2033 (VOLUME IN THOUSAND UNITS)
TABLE 28 NORTH AMERICA CRITICAL QUALITY ATTRIBUTE (CQA) MONITORING IN BIOSENSOR MARKET, BY REGION, 2018-2033 (USD THOUSAND)
TABLE 29 NORTH AMERICA POTENCY & FUNCTIONAL ACTIVITY ASSAYS IN BIOSENSOR MARKET, BY TYPE, 2018-2033 (USD THOUSAND)
TABLE 30 NORTH AMERICA POTENCY & FUNCTIONAL ACTIVITY ASSAYS IN BIOSENSOR MARKET, BY TYPE, 2018-2033 (VOLUME IN THOUSAND UNITS)
TABLE 31 NORTH AMERICA POTENCY & FUNCTIONAL ACTIVITY ASSAYS IN BIOSENSOR MARKET, BY REGION, 2018-2033 (USD THOUSAND)
TABLE 32 NORTH AMERICA BIOSENSORS MARKET, BY COUNTRY, 2018-2033 (USD THOUSAND)
TABLE 33 NORTH AMERICA BIOSENSOR MARKET, BY THERAPY MODALITY, 2018-2033 (USD THOUSAND)
TABLE 34 NORTH AMERICA BIOSENSOR MARKET, BY THERAPY MODALITY, 2018-2033 (VOLUME IN THOUSAND UNITS)
TABLE 35 NORTH AMERICA BIOSENSORS FOR CELL THERAPIES IN BIOSENSOR MARKET, BY TYPE, 2018-2033 (USD THOUSAND)
TABLE 36 NORTH AMERICA BIOSENSORS FOR CELL THERAPIES IN BIOSENSOR MARKET, BY TYPE, 2018-2033 (VOLUME IN THOUSAND UNITS)
TABLE 37 NORTH AMERICA BIOSENSORS FOR CELL THERAPIES IN BIOSENSOR MARKET, BY TYPE, 2018-2033 (ASP IN USD/UNITS)
TABLE 38 NORTH AMERICA BIOSENSORS FOR GENE THERAPIES IN BIOSENSOR MARKET, BY TYPE, 2018-2033 (USD THOUSAND)
TABLE 39 NORTH AMERICA BIOSENSORS FOR GENE THERAPIES IN BIOSENSOR MARKET, BY TYPE, 2018-2033 (VOLUME IN THOUSAND UNITS)
TABLE 40 NORTH AMERICA BIOSENSORS FOR GENE THERAPIES IN BIOSENSOR MARKET, BY TYPE, 2018-2033 (ASP IN USD/UNITS)
TABLE 41 NORTH AMERICA BIOSENSOR MARKET, BY ANALYTICAL SENSOR, 2018-2033 (USD THOUSAND)
TABLE 42 NORTH AMERICA BIOSENSOR MARKET, BY ANALYTICAL SENSOR, 2018-2033 (VOLUME IN THOUSAND UNITS)
TABLE 43 NORTH AMERICA UPSTREAM BIOPROCESS MONITORING IN BIOSENSOR MARKET, BY TYPE, 2018-2033 (USD THOUSAND)
TABLE 44 NORTH AMERICA UPSTREAM BIOPROCESS MONITORING IN BIOSENSOR MARKET, BY TYPE, 2018-2033 (VOLUME IN THOUSAND UNITS)
TABLE 45 NORTH AMERICA UPSTREAM BIOPROCESS MONITORING IN BIOSENSOR MARKET, BY TYPE, 2018-2033 (ASP IN USD/UNITS)
TABLE 46 NORTH AMERICA DOWNSTREAM PROCESSING & PURIFICATION ANALYTICS IN BIOSENSOR MARKET, BY TYPE, 2018-2033 (USD THOUSAND)
TABLE 47 NORTH AMERICA DOWNSTREAM PROCESSING & PURIFICATION ANALYTICS IN BIOSENSOR MARKET, BY TYPE, 2018-2033 (VOLUME IN THOUSAND UNITS)
TABLE 48 NORTH AMERICA DOWNSTREAM PROCESSING & PURIFICATION ANALYTICS IN BIOSENSOR MARKET, BY TYPE, 2018-2033 (ASP IN USD/UNITS)
TABLE 49 NORTH AMERICA CRITICAL QUALITY ATTRIBUTE (CQA) MONITORING IN BIOSENSOR MARKET, BY TYPE, 2018-2033 (USD THOUSAND)
TABLE 50 NORTH AMERICA CRITICAL QUALITY ATTRIBUTE (CQA) MONITORING IN BIOSENSOR MARKET, BY TYPE, 2018-2033 (VOLUME IN THOUSAND UNITS)
TABLE 51 NORTH AMERICA CRITICAL QUALITY ATTRIBUTE (CQA) MONITORING IN BIOSENSOR MARKET, BY TYPE, 2018-2033 (ASP IN USD/UNITS)
TABLE 52 NORTH AMERICA POTENCY & FUNCTIONAL ACTIVITY ASSAYS IN BIOSENSOR MARKET, BY TYPE, 2018-2033 (USD THOUSAND)
TABLE 53 NORTH AMERICA POTENCY & FUNCTIONAL ACTIVITY ASSAYS IN BIOSENSOR MARKET, BY TYPE, 2018-2033 (VOLUME IN THOUSAND UNITS)
TABLE 54 NORTH AMERICA POTENCY & FUNCTIONAL ACTIVITY ASSAYS IN BIOSENSOR MARKET, BY TYPE, 2018-2033 (ASP IN USD/UNITS)
TABLE 55 U.S. BIOSENSOR MARKET, BY THERAPY MODALITY, 2018-2033 (USD THOUSAND)
TABLE 56 U.S. BIOSENSOR MARKET, BY THERAPY MODALITY, 2018-2033 (VOLUME IN THOUSAND UNITS)
TABLE 57 U.S. BIOSENSORS FOR CELL THERAPIES IN BIOSENSOR MARKET, BY TYPE, 2018-2033 (USD THOUSAND)
TABLE 58 U.S. BIOSENSORS FOR CELL THERAPIES IN BIOSENSOR MARKET, BY TYPE, 2018-2033 (VOLUME IN THOUSAND UNITS)
TABLE 59 U.S. BIOSENSORS FOR CELL THERAPIES IN BIOSENSOR MARKET, BY TYPE, 2018-2033 (ASP IN USD/UNITS)
TABLE 60 U.S. BIOSENSORS FOR GENE THERAPIES IN BIOSENSOR MARKET, BY TYPE, 2018-2033 (USD THOUSAND)
TABLE 61 U.S. BIOSENSORS FOR GENE THERAPIES IN BIOSENSOR MARKET, BY TYPE, 2018-2033 (VOLUME IN THOUSAND UNITS)
TABLE 62 U.S. BIOSENSORS FOR GENE THERAPIES IN BIOSENSOR MARKET, BY TYPE, 2018-2033 (ASP IN USD/UNITS)
TABLE 63 U.S. BIOSENSOR MARKET, BY ANALYTICAL SENSOR, 2018-2033 (USD THOUSAND)
TABLE 64 U.S. BIOSENSOR MARKET, BY ANALYTICAL SENSOR, 2018-2033 (VOLUME IN THOUSAND UNITS)
TABLE 65 U.S. UPSTREAM BIOPROCESS MONITORING IN BIOSENSOR MARKET, BY TYPE, 2018-2033 (USD THOUSAND)
TABLE 66 U.S. UPSTREAM BIOPROCESS MONITORING IN BIOSENSOR MARKET, BY TYPE, 2018-2033 (VOLUME IN THOUSAND UNITS)
TABLE 67 U.S. UPSTREAM BIOPROCESS MONITORING IN BIOSENSOR MARKET, BY TYPE, 2018-2033 (ASP IN USD/UNITS)
TABLE 68 U.S. DOWNSTREAM PROCESSING & PURIFICATION ANALYTICS IN BIOSENSOR MARKET, BY TYPE, 2018-2033 (USD THOUSAND)
TABLE 69 U.S. DOWNSTREAM PROCESSING & PURIFICATION ANALYTICS IN BIOSENSOR MARKET, BY TYPE, 2018-2033 (VOLUME IN THOUSAND UNITS)
TABLE 70 U.S. DOWNSTREAM PROCESSING & PURIFICATION ANALYTICS IN BIOSENSOR MARKET, BY TYPE, 2018-2033 (ASP IN USD/UNITS)
TABLE 71 U.S. CRITICAL QUALITY ATTRIBUTE (CQA) MONITORING IN BIOSENSOR MARKET, BY TYPE, 2018-2033 (USD THOUSAND)
TABLE 72 U.S. CRITICAL QUALITY ATTRIBUTE (CQA) MONITORING IN BIOSENSOR MARKET, BY TYPE, 2018-2033 (VOLUME IN THOUSAND UNITS)
TABLE 73 U.S. CRITICAL QUALITY ATTRIBUTE (CQA) MONITORING IN BIOSENSOR MARKET, BY TYPE, 2018-2033 (ASP IN USD/UNITS)
TABLE 74 U.S. POTENCY & FUNCTIONAL ACTIVITY ASSAYS IN BIOSENSOR MARKET, BY TYPE, 2018-2033 (USD THOUSAND)
TABLE 75 U.S. POTENCY & FUNCTIONAL ACTIVITY ASSAYS IN BIOSENSOR MARKET, BY TYPE, 2018-2033 (VOLUME IN THOUSAND UNITS)
TABLE 76 U.S. POTENCY & FUNCTIONAL ACTIVITY ASSAYS IN BIOSENSOR MARKET, BY TYPE, 2018-2033 (ASP IN USD/UNITS)
TABLE 77 CANADA BIOSENSOR MARKET, BY THERAPY MODALITY, 2018-2033 (USD THOUSAND)
TABLE 78 CANADA BIOSENSOR MARKET, BY THERAPY MODALITY, 2018-2033 (VOLUME IN THOUSAND UNITS)
TABLE 79 CANADA BIOSENSORS FOR CELL THERAPIES IN BIOSENSOR MARKET, BY TYPE, 2018-2033 (USD THOUSAND)
TABLE 80 CANADA BIOSENSORS FOR CELL THERAPIES IN BIOSENSOR MARKET, BY TYPE, 2018-2033 (VOLUME IN THOUSAND UNITS)
TABLE 81 CANADA BIOSENSORS FOR CELL THERAPIES IN BIOSENSOR MARKET, BY TYPE, 2018-2033 (ASP IN USD/UNITS)
TABLE 82 CANADA BIOSENSORS FOR GENE THERAPIES IN BIOSENSOR MARKET, BY TYPE, 2018-2033 (USD THOUSAND)
TABLE 83 CANADA BIOSENSORS FOR GENE THERAPIES IN BIOSENSOR MARKET, BY TYPE, 2018-2033 (VOLUME IN THOUSAND UNITS)
TABLE 84 CANADA BIOSENSORS FOR GENE THERAPIES IN BIOSENSOR MARKET, BY TYPE, 2018-2033 (ASP IN USD/UNITS)
TABLE 85 CANADA BIOSENSOR MARKET, BY ANALYTICAL SENSOR, 2018-2033 (USD THOUSAND)
TABLE 86 CANADA BIOSENSOR MARKET, BY ANALYTICAL SENSOR, 2018-2033 (VOLUME IN THOUSAND UNITS)
TABLE 87 CANADA UPSTREAM BIOPROCESS MONITORING IN BIOSENSOR MARKET, BY TYPE, 2018-2033 (USD THOUSAND)
TABLE 88 CANADA UPSTREAM BIOPROCESS MONITORING IN BIOSENSOR MARKET, BY TYPE, 2018-2033 (VOLUME IN THOUSAND UNITS)
TABLE 89 CANADA UPSTREAM BIOPROCESS MONITORING IN BIOSENSOR MARKET, BY TYPE, 2018-2033 (ASP IN USD/UNITS)
TABLE 90 CANADA DOWNSTREAM PROCESSING & PURIFICATION ANALYTICS IN BIOSENSOR MARKET, BY TYPE, 2018-2033 (USD THOUSAND)
TABLE 91 CANADA DOWNSTREAM PROCESSING & PURIFICATION ANALYTICS IN BIOSENSOR MARKET, BY TYPE, 2018-2033 (VOLUME IN THOUSAND UNITS)
TABLE 92 CANADA DOWNSTREAM PROCESSING & PURIFICATION ANALYTICS IN BIOSENSOR MARKET, BY TYPE, 2018-2033 (ASP IN USD/UNITS)
TABLE 93 CANADA CRITICAL QUALITY ATTRIBUTE (CQA) MONITORING IN BIOSENSOR MARKET, BY TYPE, 2018-2033 (USD THOUSAND)
TABLE 94 CANADA CRITICAL QUALITY ATTRIBUTE (CQA) MONITORING IN BIOSENSOR MARKET, BY TYPE, 2018-2033 (VOLUME IN THOUSAND UNITS)
TABLE 95 CANADA CRITICAL QUALITY ATTRIBUTE (CQA) MONITORING IN BIOSENSOR MARKET, BY TYPE, 2018-2033 (ASP IN USD/UNITS)
TABLE 96 CANADA POTENCY & FUNCTIONAL ACTIVITY ASSAYS IN BIOSENSOR MARKET, BY TYPE, 2018-2033 (USD THOUSAND)
TABLE 97 CANADA POTENCY & FUNCTIONAL ACTIVITY ASSAYS IN BIOSENSOR MARKET, BY TYPE, 2018-2033 (VOLUME IN THOUSAND UNITS)
TABLE 98 CANADA POTENCY & FUNCTIONAL ACTIVITY ASSAYS IN BIOSENSOR MARKET, BY TYPE, 2018-2033 (ASP IN USD/UNITS)
TABLE 99 MEXICO BIOSENSOR MARKET, BY THERAPY MODALITY, 2018-2033 (USD THOUSAND)
TABLE 100 MEXICO BIOSENSOR MARKET, BY THERAPY MODALITY, 2018-2033 (VOLUME IN THOUSAND UNITS)
TABLE 101 MEXICO BIOSENSORS FOR CELL THERAPIES IN BIOSENSOR MARKET, BY TYPE, 2018-2033 (USD THOUSAND)
TABLE 102 MEXICO BIOSENSORS FOR CELL THERAPIES IN BIOSENSOR MARKET, BY TYPE, 2018-2033 (VOLUME IN THOUSAND UNITS)
TABLE 103 MEXICO BIOSENSORS FOR CELL THERAPIES IN BIOSENSOR MARKET, BY TYPE, 2018-2033 (ASP IN USD/UNITS)
TABLE 104 MEXICO BIOSENSORS FOR GENE THERAPIES IN BIOSENSOR MARKET, BY TYPE, 2018-2033 (USD THOUSAND)
TABLE 105 MEXICO BIOSENSORS FOR GENE THERAPIES IN BIOSENSOR MARKET, BY TYPE, 2018-2033 (VOLUME IN THOUSAND UNITS)
TABLE 106 MEXICO BIOSENSORS FOR GENE THERAPIES IN BIOSENSOR MARKET, BY TYPE, 2018-2033 (ASP IN USD/UNITS)
TABLE 107 MEXICO BIOSENSOR MARKET, BY ANALYTICAL SENSOR, 2018-2033 (USD THOUSAND)
TABLE 108 MEXICO BIOSENSOR MARKET, BY ANALYTICAL SENSOR, 2018-2033 (VOLUME IN THOUSAND UNITS)
TABLE 109 MEXICO UPSTREAM BIOPROCESS MONITORING IN BIOSENSOR MARKET, BY TYPE, 2018-2033 (USD THOUSAND)
TABLE 110 MEXICO UPSTREAM BIOPROCESS MONITORING IN BIOSENSOR MARKET, BY TYPE, 2018-2033 (VOLUME IN THOUSAND UNITS)
TABLE 111 MEXICO UPSTREAM BIOPROCESS MONITORING IN BIOSENSOR MARKET, BY TYPE, 2018-2033 (ASP IN USD/UNITS)
TABLE 112 MEXICO DOWNSTREAM PROCESSING & PURIFICATION ANALYTICS IN BIOSENSOR MARKET, BY TYPE, 2018-2033 (USD THOUSAND)
TABLE 113 MEXICO DOWNSTREAM PROCESSING & PURIFICATION ANALYTICS IN BIOSENSOR MARKET, BY TYPE, 2018-2033 (VOLUME IN THOUSAND UNITS)
TABLE 114 MEXICO DOWNSTREAM PROCESSING & PURIFICATION ANALYTICS IN BIOSENSOR MARKET, BY TYPE, 2018-2033 (ASP IN USD/UNITS)
TABLE 115 MEXICO CRITICAL QUALITY ATTRIBUTE (CQA) MONITORING IN BIOSENSOR MARKET, BY TYPE, 2018-2033 (USD THOUSAND)
TABLE 116 MEXICO CRITICAL QUALITY ATTRIBUTE (CQA) MONITORING IN BIOSENSOR MARKET, BY TYPE, 2018-2033 (VOLUME IN THOUSAND UNITS)
TABLE 117 MEXICO CRITICAL QUALITY ATTRIBUTE (CQA) MONITORING IN BIOSENSOR MARKET, BY TYPE, 2018-2033 (ASP IN USD/UNITS)
TABLE 118 MEXICO POTENCY & FUNCTIONAL ACTIVITY ASSAYS IN BIOSENSOR MARKET, BY TYPE, 2018-2033 (USD THOUSAND)
TABLE 119 MEXICO POTENCY & FUNCTIONAL ACTIVITY ASSAYS IN BIOSENSOR MARKET, BY TYPE, 2018-2033 (VOLUME IN THOUSAND UNITS)
TABLE 120 MEXICO POTENCY & FUNCTIONAL ACTIVITY ASSAYS IN BIOSENSOR MARKET, BY TYPE, 2018-2033 (ASP IN USD/UNITS)
List of Figure
FIGURE 1 NORTH AMERICA BIOSENSOR MARKET: SEGMENTATION
FIGURE 2 NORTH AMERICA BIOSENSOR MARKET: DATA TRIANGULATION
FIGURE 3 NORTH AMERICA BIOSENSOR MARKET: DROC ANALYSIS
FIGURE 4 NORTH AMERICA BIOSENSOR MARKET: NORTH AMERICA VS REGIONAL ANALYSIS
FIGURE 5 NORTH AMERICA BIOSENSOR MARKET: COMPANY RESEARCH ANALYSIS
FIGURE 6 NORTH AMERICA BIOSENSOR MARKET: INTERVIEW DEMOGRAPHICS
FIGURE 7 NORTH AMERICA BIOSENSOR MARKET: DBMR MARKET POSITION GRID
FIGURE 8 NORTH AMERICA BIOSENSOR MARKET: MARKET APPLICATION COVERAGE GRID
FIGURE 9 NORTH AMERICA BIOSENSOR MARKET: VENDOR SHARE ANALYSIS
FIGURE 10 NORTH AMERICA BIOSENSOR MARKET: SEGMENTATION
FIGURE 11 TWO SEGMENTS COMPRISE THE NORTH AMERICA BIOSENSORS MARKET, BY THERAPY MODALITY
FIGURE 12 RAPID EXPANSION OF CELL & GENE THERAPY MANUFACTURING TO DRIVE THE NORTH AMERICA BIOSENSOR MARKET IN THE FORECAST PERIOD OF 2026 TO 2033
FIGURE 13 BIOSENSORS FOR CELL THERAPIES SEGMENT IS EXPECTED TO ACCOUNT FOR THE LARGEST SHARE OF THE NORTH AMERICA BIOSENSOR MARKET IN 2026 & 2033
FIGURE 14 PORTER’S FIVE FORCES
FIGURE 15 TOTAL PATENTS IN THE NORTH AMERICA BIOSENSORS MARKET
FIGURE 16 DRIVER, RESTRAINTS, OPPORTUNITIES & CHALLENGES ANALYSIS OF NORTH AMERICA BIOSENSORS MARKET
FIGURE 17 NORTH AMERICA BIOSENSOR MARKET: BY THERAPY MODALITY, 2025
FIGURE 18 NORTH AMERICA BIOSENSOR MARKET: BY THERAPY MODALITY, 2026 TO 2033 (USD MILLION)
FIGURE 19 NORTH AMERICA BIOSENSOR MARKET: BY THERAPY MODALITY, CAGR (2026- 2033)
FIGURE 20 NORTH AMERICA BIOSENSOR MARKET: BY THERAPY MODALITY, LIFELINE CURVE
FIGURE 21 NORTH AMERICA BIOSENSOR MARKET: BY ANALYTICAL SENSOR, 2025
FIGURE 22 NORTH AMERICA BIOSENSOR MARKET: BY ANALYTICAL SENSOR, 2026 TO 2033 (USD MILLION)
FIGURE 23 NORTH AMERICA BIOSENSOR MARKET: BY ANALYTICAL SENSOR, CAGR (2026- 2033)
FIGURE 24 NORTH AMERICA BIOSENSOR MARKET: BY ANALYTICAL SENSOR, LIFELINE CURVE
FIGURE 25 NORTH AMERICA BIOSENSOR MARKET: SNAPSHOT (2025)
FIGURE 26 NORTH AMERICA BIOSENSOR MARKET: COMPANY SHARE 2025 (%)
Data collection and base year analysis are done using data collection modules with large sample sizes. The stage includes obtaining market information or related data through various sources and strategies. It includes examining and planning all the data acquired from the past in advance. It likewise envelops the examination of information inconsistencies seen across different information sources. The market data is analysed and estimated using market statistical and coherent models. Also, market share analysis and key trend analysis are the major success factors in the market report. To know more, please request an analyst call or drop down your inquiry.
The key research methodology used by DBMR research team is data triangulation which involves data mining, analysis of the impact of data variables on the market and primary (industry expert) validation. Data models include Vendor Positioning Grid, Market Time Line Analysis, Market Overview and Guide, Company Positioning Grid, Patent Analysis, Pricing Analysis, Company Market Share Analysis, Standards of Measurement, Global versus Regional and Vendor Share Analysis. To know more about the research methodology, drop in an inquiry to speak to our industry experts.
Data Bridge Market Research is a leader in advanced formative research. We take pride in servicing our existing and new customers with data and analysis that match and suits their goal. The report can be customized to include price trend analysis of target brands understanding the market for additional countries (ask for the list of countries), clinical trial results data, literature review, refurbished market and product base analysis. Market analysis of target competitors can be analyzed from technology-based analysis to market portfolio strategies. We can add as many competitors that you require data about in the format and data style you are looking for. Our team of analysts can also provide you data in crude raw excel files pivot tables (Fact book) or can assist you in creating presentations from the data sets available in the report.


