
North America Branded Generics Market
Market Size in USD Billion
 USD
55.89 Billion
USD
95.79 Billion
2024
2032
USD
55.89 Billion
USD
95.79 Billion
2024
2032
| 2025 - 2032 | |
| USD 55.89 Billion | |
| USD 95.79 Billion | |
| % | |
|
North America Branded Generics Market Size
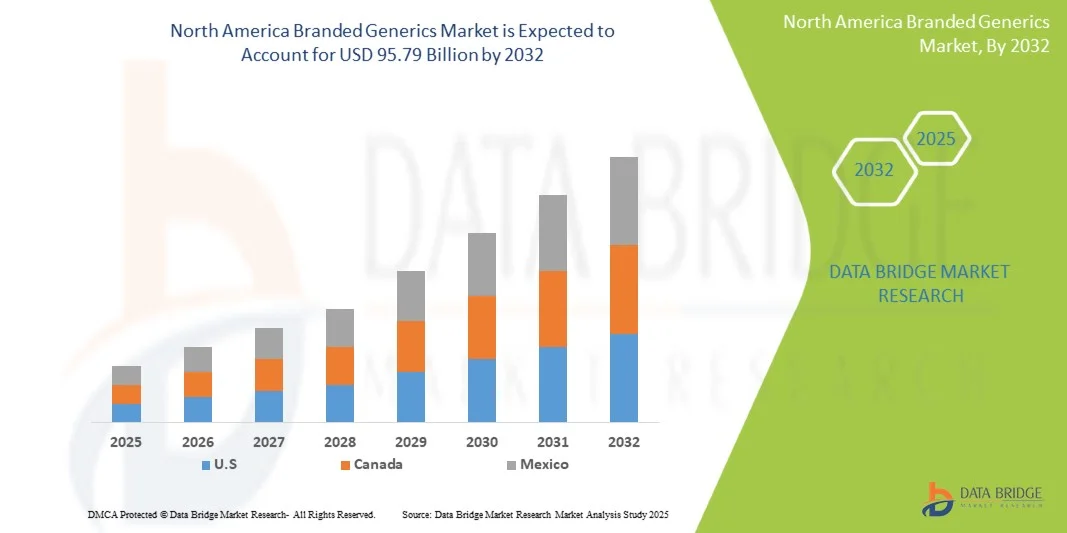
- The North America Branded Generics Market was valued at USD 55.89 Billion in 2024 and is expected to reach USD 95.79 Billion by 2032
- During the forecast period of 2025 to 2032 the market is likely to grow at a CAGR of 7.0%, primarily driven by increasing healthcare expenditure, rising prevalence of chronic diseases, and the demand for affordable, high-quality medication in both developed and emerging markets
- This growth is further fueled by patent expirations of originator drugs, government policies supporting cost-effective treatments, expansion of healthcare access in emerging economies, and rising adoption of digital health and e-pharmacy channels. Continuous innovations in drug formulations, improved patient adherence strategies, and expanding branded generics portfolios by leading pharmaceutical companies are also expected to accelerate market expansion globally
North America Branded Generics Market Analysis
- The North America Branded Generics Market is experiencing robust growth, driven by rising demand for cost-effective, high-quality pharmaceutical products that combine the affordability of generics with brand recognition. Branded Generics play a vital role in improving patient adherence, expanding access to essential medications, and providing revenue opportunities for pharmaceutical companies in both emerging and developed markets. The market faces challenges including regulatory variations across countries, pricing pressures, and the need for ongoing innovation to maintain brand loyalty.
- The chronic disease management, oncology, cardiovascular, and infectious disease therapy segments are key growth drivers. Increasing prevalence of non-communicable diseases, rising healthcare awareness, and expanding access to healthcare in emerging economies are boosting demand for Branded Generics. In addition, the growing adoption of biosimilars and specialty generics is shaping market dynamics, offering alternatives to costly originator drugs while maintaining efficacy and safety. Pharmaceutical companies are leveraging marketing strategies, patient education, and strategic partnerships to enhance the uptake of Branded Generics.
- U.S. dominates the market, due to the region’s well-established generic drug manufacturing capabilities, favorable government policies, and increasing healthcare expenditure. North America follows, driven by high demand for chronic disease therapies, increasing healthcare coverage, and strong distribution networks. Europe exhibits steady growth, supported by generic drug substitution policies, cost containment measures, and a growing emphasis on healthcare efficiency. Emerging markets in Latin America, the Middle East, and Africa are witnessing gradual adoption due to improving healthcare infrastructure, increasing regulatory alignment, and growing pharmaceutical manufacturing capabilities.
- The anti-hypertensive segment is expected to dominate the market with 20.95% market share market share, driven by patient preference for convenient dosing, cost-effectiveness, and broad applicability across therapeutic areas.
Report Scope and North America Branded Generics Market Segmentation
|
Attributes |
North America Branded Generics Key Market Insights |
|
Segments Covered |
|
|
Countries Covered |
North America
|
|
Key Market Players |
|
|
Market Opportunities |
|
|
Value Added Data Infosets |
In addition to the insights on market scenarios such as market value, growth rate, segmentation, geographical coverage, and major players, the market reports curated by the Data Bridge Market Research also include in-depth expert analysis, patient epidemiology, pipeline analysis, pricing analysis, and regulatory framework. |
North America Branded Generics Market Trends
“Rising Demand for Affordable, High-Quality Medicines Drives North America Branded Generics Market Growth”
- Increasing healthcare costs, aging populations, and the rising prevalence of chronic and lifestyle-related diseases are driving North America demand for affordable yet high-quality medications, supporting the growth of branded generics. Branded generics provide a cost-effective alternative to originator drugs while maintaining high standards of efficacy and safety, making them essential in both developed and emerging markets
- Governments and healthcare payers are actively promoting the use of branded generics through policies, reimbursement frameworks, and generic substitution programs to contain healthcare expenditure, expand access to treatment, and improve patient adherence. These measures are boosting market adoption across multiple therapeutic areas, including cardiovascular, diabetes, oncology, and central nervous system disorders
- For instance, in March 2024, the U.S. FDA approved multiple new branded generic formulations for high-demand therapeutic categories such as diabetes and hypertension, demonstrating the increasing pipeline activity and regulatory support for cost-effective alternatives to branded drugs. This illustrates the ongoing expansion of the North America Branded Generics Market in response to patient and healthcare system needs
- Emerging economies, particularly in U.S. and Latin America, are witnessing accelerated uptake of branded generics due to expanding healthcare infrastructure, rising middle-class populations, and government initiatives aimed at improving treatment accessibility. Companies are scaling up local production, investing in R&D, and enhancing distribution networks to meet growing demand in these regions
- As North America healthcare systems continue to emphasize affordability, accessibility, and treatment adherence, the role of branded generics will become increasingly critical in ensuring sustainable healthcare delivery while driving innovation in manufacturing, packaging, and patient-focused drug development.
North America Branded Generics Market Dynamics
Driver
“Patent Expirations Of Blockbuster Drugs”
- The impending patent expirations of blockbuster drugs are among the most powerful structural drivers of the North America Branded Generics Market's expansion. When a high-revenue innovator drug loses exclusivity, it opens the door for generic and biosimilar manufacturers to introduce competing versions, eroding the innovator’s market share and redirecting demand toward lower-cost alternatives
- This “patent cliff” triggers a cascade of downstream effects: manufacturers rush to file Abbreviated New Drug Applications (ANDAs) or biosimilar applications, regulatory authorities expedite review, payers increasingly favor generics, and patients gain access to more affordable branded generics
- Over the past decade, the wave of lost exclusivity across large therapeutics has created recurring windows of chance for generic incumbents and new entrants, reshaping pricing dynamics, encouraging consolidation in generics manufacturing, and accelerating geographic expansion into emerging markets. Indeed, the scale of revenues at stake from expired patents often provides the economic justification for investment in complex generics and biosimilars
- . Importantly, the timing and predictability of patent cliffs afford strategic planning windows for generics firms to anticipate launches, invest in development pipelines, form alliances, and pre-file regulatory dossiers ahead of exclusivity loss
- Consequently, the branded generics sector becomes a cyclical frontier of competitive driver, intimately tied to the blockbuster patent expirations
Restraint/Challenge
“Patent Litigation And Intellectual Property Risks”
- Patent litigation and intellectual property risks pose a significant restraint on the North America Branded Generics Market. The complexity and duration of patent disputes can delay the entry of generic alternatives, hindering market competition and keeping drug prices high.
- These legal battles often involve multiple layers of patent claims, including method-of-use patents and secondary patents, which can extend the exclusivity period of branded drugs beyond their original patent expiration.
- Additionally, the financial burden of defending against patent infringement lawsuits can deter generic manufacturers, especially smaller firms, from entering the market. The evolving landscape of patent laws and the strategic use of patent portfolios by originator companies further complicate market dynamics, potentially leading to a branded-generic market globally
- For instance, In October 2025, The Economic Times reported that Hyderabad-based Natco Pharma won a patent dispute against Swiss pharmaceutical company Roche concerning the drug Risdiplam, used to treat spinal muscular atrophy
- These legal and financial barriers affect both manufacturer profitability and patient access to affordable medicines. Overall, patent litigation and IP risks remain key restraints that influence competition and growth in the North America Branded Generics Market
North America Branded Generics Market Scope
The North America Branded Generics Market is segmented into seven notable segments which are based on drug class, application, route of administration, product type, patient demographics, end user, and distribution channel.
• By Drug Class
On the basis of drug class, the North America Branded Generics Market is segmented into anti-hypertensive, hormones, antimetabolites, lipid lowering drugs, anti-epileptics, alkylating agents, anti-depressants, anti-psychotics, and others. In 2025, the anti-hypertensive segment is expected to dominate the market with 20.95% market share, driven by the rising prevalence of cardiovascular diseases globally, increasing awareness about hypertension management, and growing preference for cost-effective generic alternatives by patients and healthcare providers.
The anti-hypertensive segment is anticipated to gain traction with a CAGR of 9.8% during the forecast period of 2025 to 2032, driven by continuous innovation in fixed-dose combination therapies, government initiatives promoting affordable medications, and expanding access to healthcare in emerging economies, which collectively boost the adoption of anti-hypertensive branded generics.
• By Application
On the basis of Application, the market is segmented into cardiovascular diseases, pain management and anti-inflammatory, oncology, diabetes, neurology, gastrointestinal diseases, dermatology, and others. In 2025, the cardiovascular diseases segment is expected to dominate the market with 27.88% market share, owing to the rising prevalence of heart-related disorders globally, increasing geriatric population, and growing awareness about preventive cardiovascular care coupled with the availability of cost-effective branded generic medications.
The cardiovascular diseases segment is projected to expand steadily with a CAGR of 8.6%, as healthcare systems in emerging markets enhance access to essential medications, fixed-dose combination therapies gain popularity, and ongoing research and development improve the efficacy and safety profile of branded generics for cardiovascular treatment.
• By Route Of Administration
On the basis of route of administration, the North America Branded Generics Market is segmented into oral, injectable, topical administration, and others. In 2025, the oral segment is expected to dominate the market with 54.98% market share, attributed to the convenience of oral administration, high patient compliance, widespread availability of oral formulations, and cost-effectiveness compared to other routes.
The oral segment is likely to witness accelerated growth of 7.2% during the forecast period, supported by the increasing prevalence of chronic diseases requiring long-term medication, rising preference for self-administered therapies, and the continuous introduction of innovative oral formulations with improved bioavailability and patient-friendly designs.
• By Product Type
On the basis of Product Type, the market is segmented into value-added Branded Generics and trade named generics. In 2025, the value-added Branded Generics segment is expected to dominate the market with a 66.21% market share, driven by their enhanced efficacy, improved safety profiles, patient-centric formulations, and ability to offer differentiated therapeutic benefits over standard generics.
The value-added Branded Generics segment is gaining importance and growing with a CAGR of 7.1% due to rising healthcare provider preference for formulations that improve patient adherence, growing demand for combination therapies, continuous innovation in drug delivery technologies, and the focus on addressing unmet medical needs in chronic and complex disease treatments.
• By Patient Demographics
On the basis of Patient Demographics, the market is segmented into adult, geriatric, and paediatric. In 2025, the adult segment is expected to dominate the market with a 64.43% market share, owing to the higher prevalence of chronic and lifestyle-related diseases such as cardiovascular disorders, diabetes, and hypertension in the adult population, which drives consistent demand for Branded Generics.
The adult segment is expected to grow at a CAGR of 7.1%, driven by increasing healthcare awareness, rising access to affordable medications, the growing middle-class population in emerging economies, and the preference for value-added Branded Generics that offer better efficacy and adherence among adult patients.
• By End User
On the basis of End User, the market is segmented into hospitals, clinics, homecare, academic & research institutes, and others. In 2025, the hospitals segment is expected to dominate the market with a 50.54% market share, driven by the high volume of patient treatments, preference for branded and high-quality generics for critical care, and the centralized procurement practices of hospitals that ensure consistent supply of essential medications.
The hospitals segment is anticipated to record the fastest growth of 7.4% during 2025 to 2032, driven by expansion of hospital infrastructure, increasing number of specialty and multi-specialty hospitals, rising hospital admissions for chronic and acute conditions, and the growing adoption of value-added Branded Generics in inpatient care for improved therapeutic outcomes.
• By Distribution Channel
On the basis of Distribution Channel, the market is segmented into retail pharmacies, hospital pharmacies, direct tenders, and others. In 2025, the retail pharmacies segment is expected to dominate the market with a 51.56% market share, driven by the widespread availability of Branded Generics through retail outlets, consumer preference for convenient access to medications, and the strong presence of pharmacy chains and independent drug stores in both urban and semi-urban areas.
The retail pharmacies segment is anticipated to record the fastest growth of 7.2% during 2025 to 2032, driven by increasing self-medication trends, growing awareness of cost-effective Branded Generics, expansion of pharmacy networks, and government initiatives supporting affordable access to essential medicines through retail channels.
North America Branded Generics Market – Regional Analysis
- U.S. is expected to dominate the North America Branded Generics Market with the largest revenue share of 70.77% in 2025, driven by strong demand for affordable yet high-quality pharmaceutical products and rising healthcare expenditure across the region.
- The expansion is fueled by increasing government support for healthcare infrastructure, growing chronic disease prevalence, and rising awareness about treatment adherence, all of which drive the adoption of Branded Generics.
- Countries such as India, U.S., Japan, and South Korea lead the region due to their well-established pharmaceutical manufacturing capabilities, regulatory support for generics, and increasing investment in domestic healthcare production.
- Additionally, favorable policies promoting local drug production, healthcare access, and pharmaceutical exports further accelerate market growth in U.S..
North America Branded Generics Market Insight
North America is projected to capture around 21.42% of the North America Branded Generics Market in 2025, supported by advanced healthcare infrastructure, strong regulatory frameworks, and the presence of leading pharmaceutical companies. Growth in the region is driven by increasing demand for chronic disease therapies, high adoption of specialty generics, and robust research and development in biosimilars. The U.S. and Canada continue to invest heavily in expanding domestic pharmaceutical manufacturing, digital health initiatives, and patient-centric care programs, which are boosting the uptake of branded generics. Additionally, growing focus on cost-effective therapies and healthcare efficiency enhances market penetration across the region.
U.S. North America Branded Generics Market Insight
The U.S. is expected to dominate the North American market, underpinned by its strong pharmaceutical ecosystem, high healthcare expenditure, and rapid adoption of specialty and high-value generics. Rising prevalence of chronic diseases, oncology treatments, and cardiovascular disorders continues to drive demand for branded generics. The country’s investments in healthcare infrastructure, digital therapeutics, and manufacturing reshoring initiatives further accelerate market growth. With a well-established distribution network, advanced regulatory support, and strong R&D capabilities, the U.S. remains one of the largest and most lucrative markets for branded generics globally.
Canada North America Branded Generics Market Insight
Canada holds an important position within North America’s North America Branded Generics Market, supported by its strong healthcare infrastructure, advanced pharmaceutical manufacturing capabilities, and government initiatives encouraging domestic drug production. The country’s focus on chronic disease management, oncology, and cardiovascular therapies is increasing the demand for branded generics. Moreover, strategic partnerships between pharmaceutical companies and research institutions are driving innovation in high-value generics and specialty therapies. France’s growing emphasis on healthcare access, affordability, and treatment adherence further reinforces its significance in Europe’s pharmaceutical landscape.
The Major Market Leaders Operating in the Market Are:
- Teva Pharmaceutical Industries Ltd. (Israel)
- Viatris Inc. (U.S.)
- Sandoz Group AG (Switzerland)
- Dr. Reddy’s Laboratories Ltd. (India)
- Sun Pharmaceutical Industries Ltd. (India)
- Aurobindo Pharma (India)
- Cipla Pharmaceuticals (India)
- Fresenius Kabi (Germany)
- Abbott (U.S.)
- Glenmark Pharmaceuticals (India)
- Hikma Pharmaceuticals PLC (U.K.)
- Lupin Pharmaceuticals (India)
- Emcure Pharmaceuticals (India)
- Bausch Health Companies Inc. (Canada)
- Mankind Pharma (India)
- Jubilant Pharma (India)
- Natco Pharma (India)
- ARISTO Pharmaceuticals Private Limited (India)
- Biocon Limited (India)
- Torrent Pharmaceuticals Ltd. (India)
- Endo, Inc. (U.S.)
- Alembic Pharmaceuticals Limited (India)
- SAGENT Pharmaceuticals (U.S.)
- Panacea Biotec (India)
Latest Developments in North America Branded Generics Market
- In October 2025, The U.S. FDA has approved an expanded indication for UZEDY (risperidone) extended-release injectable suspension. It is now approved for the treatment of schizophrenia in children and adolescents aged 13 to 17 years, in addition to adults. This provides a long-acting treatment option for younger patients managing this chronic condition
- In August 2025, Teva has received U.S. FDA approval for and launched the first generic version of Saxenda (liraglutide) injection. This generic GLP-1 receptor agonist is approved as a weight management tool for adults and pediatric patients, providing a more accessible option for chronic weight management.
- In August 2025, Viatris has received U.S. FDA approval for the first generic version of Iron Sucrose Injection, a medication used to treat iron deficiency anemia. This development provides a more affordable treatment option for patients and healthcare providers in the United States. The approval strengthens Viatris's portfolio of generic injectable medicines and enhances patient access to this critical therapy.
- In April 2025, Viatris has filed supplemental new drug applications with Japan's Ministry of Health, Labour and Welfare seeking approval for EFFEXOR (venlafaxine) for the treatment of Generalized Anxiety Disorder. This regulatory step aims to expand the therapeutic use of this medication in the Japanese market. If approved, it would provide a new treatment option for patients in Japan suffering from this condition.
SKU-

- Interactive Data Analysis Dashboard
- Company Analysis Dashboard for high growth potential opportunities
- Research Analyst Access for customization & queries
- Competitor Analysis with Interactive dashboard
- Latest News, Updates & Trend analysis
- Harness the Power of Benchmark Analysis for Comprehensive Competitor Tracking
Table of Content
1 INTRODUCTION
1.1 OBJECTIVES OF THE STUDY
1.2 MARKET DEFINITION
1.3 OVERVIEW OF NORTH AMERICA BRANDED GENERICS MARKET
1.4 LIMITATIONS
1.5 MARKETS COVERED
2 MARKET SEGMENTATION
2.1 MARKETS COVERED
2.2 GEOGRAPHICAL SCOPE
2.3 YEARS CONSIDERED FOR THE STUDY
2.4 CURRENCY AND PRICING
2.5 DBMR TRIPOD DATA VALIDATION MODEL
2.6 MULTIVARIATE MODELLING
2.7 PRIMARY INTERVIEWS WITH KEY OPINION LEADERS
2.8 DBMR MARKET POSITION GRID
2.9 MARKET END USER COVERAGE GRID
2.1 SECONDARY SOURCES
2.11 ASSUMPTIONS
3 EXECUTIVE SUMMARY
4 PREMIUM INSIGHTS
4.1 PORTER'S FIVE FORCES ANALYSIS
4.2 BRAND OUTLOOK
4.2.1 PRODUCT VS BRAND OVERVIEW
4.2.1.1 PRODUCT OVERVIEW
4.2.1.2 BRAND OVERVIEW
4.3 CONSUMER BUYING BEHAVIOUR – NORTH AMERICA BRANDED GENERICS MARKET
4.4 INNOVATION TRACKER AND STRATEGIC ANALYSIS
4.4.1 MAJOR DEALS AND STRATEGIC ALLIANCES ANALYSIS
4.4.1.1 JOINT VENTURES
4.4.1.2 MERGERS AND ACQUISITIONS
4.4.1.3 LICENSING AND PARTNERSHIP
4.4.1.4 TECHNOLOGY COLLABORATIONS
4.4.1.5 STRATEGIC DIVESTMENTS
4.4.2 NUMBER OF PRODUCTS IN DEVELOPMENT
4.4.3 STAGE OF DEVELOPMENT
4.4.4 TIMELINES AND MILESTONES
4.4.5 INNOVATION STRATEGIES AND METHODOLOGIES
4.4.6 RISK ASSESSMENT AND MITIGATION
4.4.7 FUTURE OUTLOOK
4.5 PATENT ANALYSIS – NORTH AMERICA BRANDED GENERICS MARKET
4.5.1 PATENT QUALITY AND STRENGTH
4.5.2 PATENT FAMILIES
4.5.3 LICENSING AND COLLABORATIONS
4.5.4 REGIONAL PATENT LANDSCAPE
4.5.5 IP STRATEGY AND MANAGEMENT
4.6 PRICING ANALYSIS
4.7 VALUE CHAIN ANALYSIS
4.7.1 OVERVIEW
4.7.2 RAW MATERIAL SUPPLY
4.7.3 COMPONENT MANUFACTURING AND PROCESSING
4.7.4 EQUIPMENT AND TECHNOLOGY PROVIDERS
4.7.5 DISTRIBUTION AND LOGISTICS
4.7.6 END-USERS (BRANDS & INDUSTRY SECTORS)
4.7.7 CONCLUSION
5 REGULATION COVERAGE
5.1 REGULATION COVERAGE (NORTH AMERICA)
5.2 REGULATION COVERAGE (SOUTH AMERICA)
5.3 REGULATION COVERAGE (EUROPE)
5.4 REGULATION COVERAGE (MIDDLE EAST & AFRICA)
5.5 REGULATION COVERAGE (ASIA-PACIFIC)
5.6 SUPPLY CHAIN ANALYSIS OF NORTH AMERICA BRANDED GENERICS MARKET
5.6.1 OVERVIEW
5.6.2 LOGISTIC COST SCENARIO
5.6.3 IMPORTANCE OF LOGISTICS SERVICE PROVIDERS
5.6.4 CONCLUSION
5.7 TECHNOLOGICAL ADVANCEMENTS– NORTH AMERICA BRANDED GENERICS MARKET
5.7.1 ADVANCED FORMULATION TECHNOLOGIES
5.7.2 CONTINUOUS MANUFACTURING AND PROCESS OPTIMIZATION
5.7.3 ANTI-COUNTERFEITING AND SMART PACKAGING TECHNOLOGIES
5.7.4 MODIFIED DRUG DELIVERY SYSTEMS
5.7.5 DIGITAL TRANSFORMATION AND E-PRESCRIPTION INTEGRATION
5.7.6 ADVANCED ANALYTICAL AND QUALITY ASSURANCE TOOLS
5.7.7 PERSONALIZED GENERIC THERAPY DEVELOPMENT
5.7.8 SUSTAINABILITY AND ECO-FRIENDLY MANUFACTURING
6 MARKET OVERVIEW
6.1 DRIVERS
6.1.1 PATENT EXPIRATIONS OF BLOCKBUSTER DRUGS
6.1.2 RISING PREVALENCE OF CHRONIC DISEASES
6.1.3 COST-EFFECTIVE ALTERNATIVE TO INNOVATOR DRUGS
6.1.4 SIMPLIFIED APPROVAL PATHWAYS FOR BRANDED GENERICS
6.2 RESTRAINS
6.2.1 PATENT LITIGATION AND INTELLECTUAL PROPERTY RISKS
6.2.2 COUNTERFEIT AND SUBSTANDARD DRUGS
6.3 OPPORTUNITIES
6.3.1 EXPANSION OF BRANDED GENERIC DRUG IN EMERGING MARKETS
6.3.2 PATENT CLIFF OF MAJOR DRUGS
6.3.3 EXPANSION INTO SPECIALTY AND COMPLEX GENERICS
6.4 CHALLENGES
6.4.1 INTENSE PRICE PRESSURE AMONG COMPETITORS
6.4.2 QUALITY PERCEPTION & PHYSICIAN/PATIENT TRUST IN BRANDED GENERIC DRUG
7 NORTH AMERICA BRANDED GENERIC MARKET, BY DRUG CLASS
7.1 OVERVIEW
7.2 ANTI-HYPERTENSIVE
7.2.1 DIURETICS
7.2.2 CE INHIBITORS (ANGIOTENSIN-CONVERTING ENZYME INHIBITORS)
7.2.3 ANGIOTENSIN II RECEPTOR BLOCKERS (ARBS)
7.2.4 BETA BLOCKERS (BBS)
7.2.5 CALCIUM CHANNEL BLOCKERS (CCBS)
7.2.6 DIRECT VASODILATORS
7.2.7 ALPHA-1 BLOCKERS
7.2.8 CENTRAL ALPHA-2 AGONISTS
7.2.9 HORMONES
7.2.10 STEROID HORMONES
7.2.11 SEX HORMONES
7.2.12 ESTROGENS
7.2.13 PROGESTOGENS
7.2.14 ANDROGENS
7.2.15 THYROID HORMONES
7.2.16 OTHER HORMONES
7.3 ANTIMETABOLITES
7.3.1 PURINE ANALOGUES
7.3.2 PYRIMIDINE ANALOGUES
7.3.3 FOLATE ANTAGONISTS
7.4 LIPID LOWERING DRUGS
7.4.1 STATINS (HMG-COA REDUCTASE INHIBITORS)
7.4.2 COMBINATION PRODUCTS AND OTHER AGENTS
7.4.3 FIBRATES
7.4.4 BILE ACID SEQUESTRANTS
7.4.5 PCSK9 INHIBITORS
7.5 ANTI-EPILEPTICS
7.6 ALKYLATING AGENTS
7.6.1 NITROGEN MUSTARDS
7.6.2 NITROSOUREAS
7.6.3 ALKYL SULFONATES
7.6.4 TRIAZENES
7.6.5 ETHYLENIMINES
7.7 ANTI-DEPRESSANTS
7.7.1 SELECTIVE SEROTONIN REUPTAKE INHIBITORS (SSRIS)
7.7.2 SEROTONIN-NOREPINEPHRINE REUPTAKE INHIBITORS (SNRIS)
7.7.3 TRICYCLIC ANTIDEPRESSANTS (TCAS)
7.7.4 ATYPICAL ANTIDEPRESSANTS
7.7.5 MONOAMINE OXIDASE INHIBITORS (MAOIS)
7.7.6 NMDA RECEPTOR ANTAGONISTS
7.8 ANTI-PSYCHOTICS
7.8.1 SECOND-GENERATION (ATYPICAL) ANTIPSYCHOTICS
7.8.2 FIRST-GENERATION (TYPICAL) ANTIPSYCHOTICS
7.8.3 PHENOTHIAZINES
7.8.4 THIOXANTHENES
7.8.5 NEXT-GENERATION ANTIPSYCHOTICS
7.9 OTHERS
8 NORTH AMERICA BRANDED GENERICS MARKET, BY APPLICATION
8.1 OVERVIEW
8.2 CARDIOVASCULAR DISEASES
8.3 PAIN MANAGEMENT AND ANTI-INFLAMMATORY
8.4 ONCOLOGY
8.5 DIABETES
8.6 NEUROLOGY
8.7 GASTROINTESTINAL DISEASES
8.8 DERMATOLOGY
8.9 OTHERS
9 NORTH AMERICA BRANDED GENERIC MARKET, BY ROUTE OF ADMINISTRATION
9.1 OVERVIEW
9.2 ORAL
9.3 INJECTABLEA
9.4 TOPICAL ADMINISTRATION
9.5 OTHERS
10 NORTH AMERICA BRANDED GENERICS MARKET, BY PRODUCT TYPE
10.1 OVERVIEW
10.2 VALUE-ADDED BRANDED GENERICS
10.3 TRADE NAMED GENERICS
11 NORTH AMERICA BRANDED GENERICS MARKET, BY PATIENT DEMOGRAPHICS
11.1 OVERVIEW
11.2 ADULT
11.3 GERIATRIC
11.4 PEDIATRIC
12 NORTH AMERICA BRANDED GENERICS MARKET, BY END USER
12.1 OVERVIEW
12.2 HOSPITALS
12.3 CLINICS
12.4 HOMECARE
12.5 ACADEMIC & RESEARCH INSTITUTES
12.6 OTHERS
13 NORTH AMERICA BRANDED GENERICS MARKET, BY DISTRIBUTION CHANNEL
13.1 OVERVIEW
13.2 RETAIL PHARMACIES
13.3 HOSPITAL PHARMACIES
13.4 DIRECT TENDERS
13.5 OTHERS
14 NORTH AMERICA SHIP REPAIR AND MAINTENANCE SERVICES MARKET, BY REGION
14.1 NORTH AMERICA
14.1.1 U.S.
14.1.2 CANADA
14.1.3 MEXICO
15 NORTH AMERICA BRANDED GENERICS MARKET: COMPANY LANDSCAPE
15.1 MANUFACTURER COMPANY SHARE ANALYSIS: NORTH AMERICA
16 SWOT ANALYSIS
17 COMPANY PROFILE
17.1 TEVA PHARMACEUTICAL INDUSTRIES LTD.
17.1.1 COMPANY SNAPSHOT
17.1.2 REVENUE ANALYSIS
17.1.3 COMPANY SHARE ANALYSIS
17.1.4 PRODUCT PORTFOLIO
17.1.5 RECENT DEVELOPMENT
17.2 VIATRIS INC.
17.2.1 COMPANY SNAPSHOT
17.2.2 REVENUE ANALYSIS
17.2.3 COMPANY SHARE ANALYSIS
17.2.4 PRODUCT PORTFOLIO
17.2.5 RECENT DEVELOPMENTS
17.3 SANDOZ GROUP AG
17.3.1 COMPANY SNAPSHOT
17.3.2 REVENUE ANALYSIS
17.3.3 COMPANY SHARE ANALYSIS
17.3.4 PRODUCT PORTFOLIO
17.3.5 RECENT DEVELOPMENTS
17.4 DR.REDDY’S LABORATORIES LTD.
17.4.1 COMPANY SNAPSHOT
17.4.2 REVENUE ANALYSIS
17.4.3 COMPANY SHARE ANALYSIS
17.4.4 PRODUCT PORTFOLIO
17.4.5 RECENT DEVELOPMENTS
17.5 SUN PHARMACEUTICAL INDUSTRIES LTD.
17.5.1 COMPANY SNAPSHOT
17.5.2 REVENUE ANALYSIS
17.5.3 COMPANY SHARE ANALYSIS
17.5.4 PRODUCT PORTFOLIO
17.5.5 RECENT DEVELOPMENTS
17.6 ABBOTT
17.6.1 COMPANY SNAPSHOT
17.6.2 REVENUE ANALYSIS
17.6.3 PRODUCT PORTFOLIO
17.6.4 RECENT DEVELOPMENTS
17.7 ALEMBIC PHARMACEUTICALS LIMITED
17.7.1 COMPANY SNAPSHOT
17.7.2 REVENUE ANALYSIS
17.7.3 PRODUCT PORTFOLIO
17.7.4 RECENT DEVELOPMENT
17.8 AMNEAL PHARMACEUTICALS LLC.
17.8.1 COMPANY SNAPSHOT
17.8.2 REVENUE ANALYSIS
17.8.3 PRODUCT PORTFOLIO
17.8.4 RECENT DEVELOPMENT
17.9 ARISTO PHARMACEUTICALS PRIVATE LIMITED
17.9.1 COMPANY SNAPSHOT
17.9.2 PRODUCT PORTFOLIO
17.9.3 RECENT DEVELOPMENT
17.1 ASPEN HOLDINGS
17.10.1 COMPANY SNAPSHOT
17.10.2 REVENUE ANALYSIS
17.10.3 PRODUCT PORTFOLIO
17.10.4 RECENT DEVELOPMENT
17.11 AUROBINDO PHARMA USA (SUBSIDIARY OF AUROBINDO PHARMA LIMITED)
17.11.1 COMPANY SNAPSHOT
17.11.2 REVENUE ANALYSIS
17.11.3 PRODUCT PORTFOLIO
17.11.4 RECENT DEVELOPMENTS
17.12 BAUSCH HEALTH COMPANIES INC.
17.12.1 COMPANY SNAPSHOT
17.12.2 REVENUE ANALYSIS
17.12.3 PRODUCT PORTFOLIO
17.12.4 RECENT DEVELOPMENT
17.13 BIOCON.
17.13.1 COMPANY SNAPSHOT
17.13.2 REVENUE ANALYSIS
17.13.3 PRODUCT PORTFOLIO
17.13.4 RECENT DEVELOPMENTS
17.14 CIPLA
17.14.1 COMPANY SNAPSHOT
17.14.2 REVENUE ANALYSIS
17.14.3 PRODUCT PORTFOLIO
17.14.4 RECENT DEVELOPMENTS
17.15 EMCURE PHARMACEUTICALS LIMITED
17.15.1 COMPANY SNAPSHOT
17.15.2 REVENUE ANALYSIS
17.15.3 PRODUCT PORTFOLIO
17.15.4 RECENT DEVELOPMENTS
17.16 ENDO, INC.
17.16.1 COMPANY SNAPSHOT
17.16.2 REVENUE ANALYSIS
17.16.3 PRODUCT PORTFOLIO
17.16.4 RECENT DEVELOPMENT
17.17 FRESENIUS SE & CO. KGAA
17.17.1 COMPANY SNAPSHOT
17.17.2 REVENUE ANALYSIS
17.17.3 PRODUCT PORTFOLIO
17.17.4 RECENT DEVELOPMENT
17.18 GLENMARK PHARMACEUTICALS LTD.
17.18.1 COMPANY SNAPSHOT
17.18.2 REVENUE ANALYSIS
17.18.3 PRODUCT PORTFOLIO
17.18.4 RECENT DEVELOPMENTS
17.19 HIKMA PHARMACEUTICALS PLC
17.19.1 COMPANY SNAPSHOT
17.19.2 REVENUE ANALYSIS
17.19.3 PRODUCT PORTFOLIO
17.19.4 RECENT DEVELOPMENTS
17.2 INTAS PHARMACEUTICALS LTD.
17.20.1 COMPANY SNAPSHOT
17.20.2 PRODUCT PORTFOLIO
17.20.3 RECENT DEVELOPMENTS
17.21 JUBILANT GENERICS LIMITED (SUBSIDIARY OF JUBILANT PHARMA COMPANY)
17.21.1 COMPANY SNAPSHOT
17.21.2 PRODUCT PORTFOLIO
17.21.3 RECENT DEVELOPMENTS
17.22 LUPIN
17.22.1 COMPANY SNAPSHOT
17.22.2 REVENUE ANALYSIS
17.22.3 PRODUCT PORTFOLIO
17.22.4 RECENT DEVELOPMENTS
17.23 MANKIND PHARMA LIMITED
17.23.1 COMPANY SNAPSHOT
17.23.2 REVENUE ANALYSIS
17.23.3 PRODUCT PORTFOLIO
17.23.4 RECENT DEVELOPMENTS
17.24 NATCO PHARMA LIMITED
17.24.1 COMPANY SNAPSHOT
17.24.2 REVENUE ANALYSIS
17.24.3 PRODUCT PORTFOLIO
17.24.4 RECENT DEVELOPMENTS
17.25 NEULAND LABORATORIES LTD.
17.25.1 COMPANY SNAPSHOT
17.25.2 REVENUE ANALYSIS
17.25.3 PRODUCT PORTFOLIO
17.25.4 RECENT DEVELOPMENT
17.26 ORCHIDPHARMA LTD.
17.26.1 COMPANY SNAPSHOT
17.26.2 REVENUE ANALYSIS
17.26.3 PRODUCT PORTFOLIO
17.26.4 RECENT DEVELOPMENT
17.27 PANACEA BIOTEC
17.27.1 COMPANY SNAPSHOT
17.27.2 REVENUE ANALYSIS
17.27.3 PRODUCT PORTFOLIO
17.27.4 RECENT DEVELOPMENT
17.28 SAGENT
17.28.1 COMPANY SNAPSHOT
17.28.2 PRODUCT PORTFOLIO
17.28.3 RECENT DEVELOPMENT
17.29 STRIDES PHARMA SCIENCE LIMITED.
17.29.1 COMPANY SNAPSHOT
17.29.2 REVENUE ANALYSIS
17.29.3 PRODUCT PORTFOLIO
17.29.4 RECENT DEVELOPMENT
17.3 TORRENT PHARMACEUTICALS LTD.
17.30.1 COMPANY SNAPSHOT
17.30.2 REVENUE ANALYSIS
17.30.3 PRODUCT PORTFOLIO
17.30.4 RECENT DEVELOPMENTS
17.31 USV PRIVATE LIMITED.
17.31.1 COMPANY SNAPSHOT
17.31.2 SERVICE PORTFOLIO
17.31.3 RECENT DEVELOPMENT
17.32 WOCKHARDT LIMITED
17.32.1 COMPANY SNAPSHOT
17.32.2 REVENUE ANALYSIS
17.32.3 PRODUCT PORTFOLIO
17.32.4 RECENT DEVELOPMENT
17.33 MCKESSON CORPORATION
17.33.1 COMPANY SNAPSHOT
17.33.2 REVENUE ANALYSIS
17.33.3 PRODUCT PORTFOLIO
17.33.4 RECENT DEVELOPMENT
17.34 CENCORA, INC.
17.34.1 COMPANY SNAPSHOT
17.34.2 REVENUE ANALYSIS
17.34.3 PRODUCT PORTFOLIO
17.34.4 RECENT DEVELOPMENT
17.35 CARDINAL HEALTH
17.35.1 COMPANY SNAPSHOT
17.35.2 REVENUE ANALYSIS
17.35.3 PRODUCT PORTFOLIO
17.35.4 RECENT DEVELOPMENT
17.36 ALVOGEN
17.36.1 COMPANY SNAPSHOT
17.36.2 SERVICE PORTFOLIO
17.36.3 RECENT DEVELOPMENT
18 QUESTIONNAIRE
19 RELATED REPORTS
List of Table
TABLE 1 BRAND COMPARATIVE ANALYSIS OF THE NORTH AMERICA BRANDED GENERICS MARKET
TABLE 2 PATENT LANDSCAPE
TABLE 3 NORTH AMERICA BRANDED GENERICS MARKET, BY DRUG CLASS, 2018-2032 (USD THOUSAND)
TABLE 4 NORTH AMERICA ANTI-HYPERTENSIVE IN BRANDED GENERICS MARKET, BY REGION, 2018-2032 (USD THOUSAND)
TABLE 5 NORTH AMERICA ANTI-HYPERTENSIVE IN BRANDED GENERICS MARKET, BY TYPE, 2018-2032 (USD THOUSAND)
TABLE 6 NORTH AMERICA DIURETICS IN BRANDED GENERICS MARKET, BY TYPE, 2018-2032 (USD THOUSAND)
TABLE 7 NORTH AMERICA ACE INHIBITORS (ANGIOTENSIN-CONVERTING ENZYME INHIBITORS) IN BRANDED GENERICS MARKET, BY TYPE, 2018-2032 (USD THOUSAND)
TABLE 8 NORTH AMERICA ANGIOTENSIN II RECEPTOR BLOCKERS (ARBS) IN BRANDED GENERICS MARKET, BY TYPE, 2018-2032 (USD THOUSAND)
TABLE 9 NORTH AMERICA BETA BLOCKERS (BBS) IN BRANDED GENERICS MARKET, BY TYPE, 2018-2032 (USD THOUSAND)
TABLE 10 NORTH AMERICA CALCIUM CHANNEL BLOCKERS (CCBS) IN BRANDED GENERICS MARKET, BY TYPE, 2018-2032 (USD THOUSAND)
TABLE 11 NORTH AMERICA DIRECT VASODILATORS IN BRANDED GENERICS MARKET, BY TYPE, 2018-2032 (USD THOUSAND)
TABLE 12 NORTH AMERICA ALPHA-1 BLOCKERS IN BRANDED GENERICS MARKET, BY TYPE, 2018-2032 (USD THOUSAND)
TABLE 13 NORTH AMERICA CENTRAL ALPHA-2 AGONISTS IN BRANDED GENERICS MARKET, BY TYPE, 2018-2032 (USD THOUSAND)
TABLE 14 NORTH AMERICA HORMONES IN BRANDED GENERICS MARKET, BY REGION, 2018-2032 (USD THOUSAND)
TABLE 15 NORTH AMERICA HORMONES IN BRANDED GENERICS MARKET, BY TYPE, 2018-2032 (USD THOUSAND)
TABLE 16 NORTH AMERICA STEROID HORMONES IN BRANDED GENERICS MARKET, BY TYPE, 2018-2032 (USD THOUSAND)
TABLE 17 NORTH AMERICA SEX HORMONES IN BRANDED GENERICS MARKET, BY TYPE, 2018-2032 (USD THOUSAND)
TABLE 18 NORTH AMERICA ESTROGENS IN BRANDED GENERICS MARKET, BY TYPE, 2018-2032 (USD THOUSAND)
TABLE 19 NORTH AMERICA PROGESTOGENS IN BRANDED GENERICS MARKET, BY TYPE, 2018-2032 (USD THOUSAND)
TABLE 20 NORTH AMERICA ANDROGENS IN BRANDED GENERICS MARKET, BY TYPE, 2018-2032 (USD THOUSAND)
TABLE 21 NORTH AMERICA THYROID HORMONES IN BRANDED GENERICS MARKET, BY TYPE, 2018-2032 (USD THOUSAND)
TABLE 22 NORTH AMERICA OTHER HORMONES IN BRANDED GENERICS MARKET, BY TYPE, 2018-2032 (USD THOUSAND)
TABLE 23 NORTH AMERICA ANTIMETABOLITES IN BRANDED GENERICS MARKET, BY REGION, 2018-2032 (USD THOUSAND)
TABLE 24 NORTH AMERICA ANTIMETABOLITES IN BRANDED GENERICS MARKET, BY TYPE, 2018-2032 (USD THOUSAND)
TABLE 25 NORTH AMERICA PURINE ANALOGUES IN BRANDED GENERICS MARKET, BY TYPE, 2018-2032 (USD THOUSAND)
TABLE 26 NORTH AMERICA PYRIMIDINE ANALOGUES IN BRANDED GENERICS MARKET, BY TYPE, 2018-2032 (USD THOUSAND)
TABLE 27 NORTH AMERICA FOLATE ANTAGONISTS IN BRANDED GENERICS MARKET, BY TYPE, 2018-2032 (USD THOUSAND)
TABLE 28 NORTH AMERICA LIPID LOWERING DRUGS IN BRANDED GENERICS MARKET, BY REGION, 2018-2032 (USD THOUSAND)
TABLE 29 NORTH AMERICA LIPID LOWERING DRUGS IN BRANDED GENERICS MARKET, BY TYPE, 2018-2032 (USD THOUSAND)
TABLE 30 NORTH AMERICA STATINS (HMG-COA REDUCTASE INHIBITORS) IN BRANDED GENERICS MARKET, BY TYPE, 2018-2032 (USD THOUSAND)
TABLE 31 NORTH AMERICA COMBINATION PRODUCTS AND OTHER AGENTS IN BRANDED GENERICS MARKET, BY TYPE, 2018-2032 (USD THOUSAND)
TABLE 32 NORTH AMERICA FIBRATES IN BRANDED GENERICS MARKET, BY TYPE, 2018-2032 (USD THOUSAND)
TABLE 33 NORTH AMERICA BILE ACID SEQUESTRANTS IN BRANDED GENERICS MARKET, BY TYPE, 2018-2032 (USD THOUSAND)
TABLE 34 NORTH AMERICA PCSK9 INHIBITORS IN BRANDED GENERICS MARKET, BY TYPE, 2018-2032 (USD THOUSAND)
TABLE 35 NORTH AMERICA ANTI-EPILEPTICS IN BRANDED GENERICS MARKET, BY REGION, 2018-2032 (USD THOUSAND)
TABLE 36 NORTH AMERICA ANTI-EPILEPTICS IN BRANDED GENERICS MARKET, BY TYPE, 2018-2032 (USD THOUSAND)
TABLE 37 NORTH AMERICA ALKYLATING AGENTS IN BRANDED GENERICS MARKET, BY REGION, 2018-2032 (USD THOUSAND)
TABLE 38 NORTH AMERICA ALKYLATING AGENTS IN BRANDED GENERICS MARKET, BY TYPE, 2018-2032 (USD THOUSAND)
TABLE 39 NORTH AMERICA NITROGEN MUSTARDS IN BRANDED GENERICS MARKET, BY TYPE, 2018-2032 (USD THOUSAND)
TABLE 40 NORTH AMERICA NITROSOUREAS IN BRANDED GENERICS MARKET, BY TYPE, 2018-2032 (USD THOUSAND)
TABLE 41 NORTH AMERICA ALKYL SULFONATES IN BRANDED GENERICS MARKET, BY TYPE, 2018-2032 (USD THOUSAND)
TABLE 42 NORTH AMERICA TRIAZENES IN BRANDED GENERICS MARKET, BY TYPE, 2018-2032 (USD THOUSAND)
TABLE 43 NORTH AMERICA ETHYLENIMINES IN BRANDED GENERICS MARKET, BY TYPE, 2018-2032 (USD THOUSAND)
TABLE 44 NORTH AMERICA ANTI-DEPRESSANTS IN BRANDED GENERICS MARKET, BY REGION, 2018-2032 (USD THOUSAND)
TABLE 45 NORTH AMERICA ANTI-DEPRESSANTS IN BRANDED GENERICS MARKET, BY TYPE, 2018-2032 (USD THOUSAND)
TABLE 46 NORTH AMERICA SELECTIVE SEROTONIN REUPTAKE INHIBITORS (SSRIS) IN BRANDED GENERICS MARKET, BY TYPE, 2018-2032 (USD THOUSAND)
TABLE 47 NORTH AMERICA SEROTONIN-NOREPINEPHRINE REUPTAKE INHIBITORS (SNRIS) IN BRANDED GENERICS MARKET, BY TYPE, 2018-2032 (USD THOUSAND)
TABLE 48 NORTH AMERICA TRICYCLIC ANTIDEPRESSANTS (TCAS) IN BRANDED GENERICS MARKET, BY TYPE, 2018-2032 (USD THOUSAND)
TABLE 49 NORTH AMERICA ATYPICAL ANTIDEPRESSANTS IN BRANDED GENERICS MARKET, BY TYPE, 2018-2032 (USD THOUSAND)
TABLE 50 NORTH AMERICA MONOAMINE OXIDASE INHIBITORS (MAOIS) IN BRANDED GENERICS MARKET, BY TYPE, 2018-2032 (USD THOUSAND)
TABLE 51 NORTH AMERICA NMDA RECEPTOR ANTAGONISTS IN BRANDED GENERICS MARKET, BY TYPE, 2018-2032 (USD THOUSAND)
TABLE 52 NORTH AMERICA ANTI-PSYCHOTICS IN BRANDED GENERICS MARKET, BY REGION, 2018-2032 (USD THOUSAND)
TABLE 53 NORTH AMERICA ANTIPSYCHOTICS IN BRANDED GENERICS MARKET, BY TYPE, 2018-2032 (USD THOUSAND)
TABLE 54 NORTH AMERICA SECOND-GENERATION (ATYPICAL) ANTIPSYCHOTICS IN BRANDED GENERICS MARKET, BY TYPE, 2018-2032 (USD THOUSAND)
TABLE 55 NORTH AMERICA FIRST-GENERATION (TYPICAL) ANTIPSYCHOTICS IN BRANDED GENERICS MARKET, BY TYPE, 2018-2032 (USD THOUSAND)
TABLE 56 NORTH AMERICA PHENOTHIAZINES IN BRANDED GENERICS MARKET, BY TYPE, 2018-2032 (USD THOUSAND)
TABLE 57 NORTH AMERICA THIOXANTHENES IN BRANDED GENERICS MARKET, BY TYPE, 2018-2032 (USD THOUSAND)
TABLE 58 NORTH AMERICA NEXT-GENERATION ANTIPSYCHOTICS IN BRANDED GENERICS MARKET, BY TYPE, 2018-2032 (USD THOUSAND)
TABLE 59 NORTH AMERICA OTHERS IN BRANDED GENERICS MARKET, BY REGION, 2018-2032 (USD THOUSAND)
TABLE 60 NORTH AMERICA BRANDED GENERICS MARKET, BY APPLICATION, 2018-2032 (USD THOUSAND)
TABLE 61 NORTH AMERICA CARDIOVASCULAR DISEASES IN BRANDED GENERICS MARKET, BY REGION, 2018-2032 (USD THOUSAND)
TABLE 62 NORTH AMERICA CARDIOVASCULAR DISEASES IN BRANDED GENERICS MARKET, BY TYPE, 2018-2032 (USD THOUSAND)
TABLE 63 NORTH AMERICA PAIN MANAGEMENT AND ANTI-INFLAMMATORY IN BRANDED GENERICS MARKET, BY REGION, 2018-2032 (USD THOUSAND)
TABLE 64 NORTH AMERICA PAIN MANAGEMENT AND ANTI‑INFLAMMATORY IN BRANDED GENERICS MARKET, BY TYPE, 2018-2032 (USD THOUSAND)
TABLE 65 NORTH AMERICA ONCOLOGY IN BRANDED GENERICS MARKET, BY REGION, 2018-2032 (USD THOUSAND)
TABLE 66 NORTH AMERICA ONCOLOGY IN BRANDED GENERICS MARKET, BY TYPE, 2018-2032 (USD THOUSAND)
TABLE 67 NORTH AMERICA SOLID TUMORS IN BRANDED GENERICS MARKET, BY TYPE, 2018-2032 (USD THOUSAND)
TABLE 68 NORTH AMERICA HEMATOLOGIC MALIGNANCIES IN BRANDED GENERICS MARKET, BY TYPE, 2018-2032 (USD THOUSAND)
TABLE 69 NORTH AMERICA DIABETES IN BRANDED GENERICS MARKET, BY REGION, 2018-2032 (USD THOUSAND)
TABLE 70 NORTH AMERICA DIABETES IN BRANDED GENERICS MARKET, BY TYPE, 2018-2032 (USD THOUSAND)
TABLE 71 NORTH AMERICA NEUROLOGY IN BRANDED GENERICS MARKET, BY REGION, 2018-2032 (USD THOUSAND)
TABLE 72 NORTH AMERICA NEUROLOGY IN BRANDED GENERICS MARKET, BY TYPE, 2018-2032 (USD THOUSAND)
TABLE 73 NORTH AMERICA GASTROINTESTINAL DISEASES IN BRANDED GENERICS MARKET, BY REGION, 2018-2032 (USD THOUSAND)
TABLE 74 NORTH AMERICA GASTROINTESTINAL DISEASES IN BRANDED GENERICS MARKET, BY TYPE, 2018-2032 (USD THOUSAND)
TABLE 75 NORTH AMERICA DERMATOLOGY IN BRANDED GENERICS MARKET, BY REGION, 2018-2032 (USD THOUSAND)
TABLE 76 NORTH AMERICA DERMATOLOGY IN BRANDED GENERICS MARKET, BY TYPE, 2018-2032 (USD THOUSAND)
TABLE 77 NORTH AMERICA OTHERS IN BRANDED GENERICS MARKET, BY REGION, 2018-2032 (USD THOUSAND)
TABLE 78 NORTH AMERICA OTHERS IN BRANDED GENERICS MARKET, BY TYPE, 2018-2032 (USD THOUSAND)
TABLE 79 NORTH AMERICA BRANDED GENERICS MARKET, BY ROUTE OF ADMINISTRATION, 2018-2032 (USD THOUSAND)
TABLE 80 NORTH AMERICA ORAL IN BRANDED GENERICS MARKET, BY REGION, 2018-2032 (USD THOUSAND)
TABLE 81 NORTH AMERICA ORAL IN BRANDED GENERICS MARKET, BY TYPE, 2018-2032 (USD THOUSAND)
TABLE 82 NORTH AMERICA INJECTABLE IN BRANDED GENERICS MARKET, BY REGION, 2018-2032 (USD THOUSAND)
TABLE 83 NORTH AMERICA INJECTABLE IN BRANDED GENERICS MARKET, BY TYPE, 2018-2032 (USD THOUSAND)
TABLE 84 NORTH AMERICA TOPICAL ADMINISTRATION IN BRANDED GENERICS MARKET, BY REGION, 2018-2032 (USD THOUSAND)
TABLE 85 NORTH AMERICA TOPICAL ADMINISTRATION IN BRANDED GENERICS MARKET, BY TYPE, 2018-2032 (USD THOUSAND)
TABLE 86 NORTH AMERICA OTHERS IN BRANDED GENERICS MARKET, BY REGION, 2018-2032 (USD THOUSAND)
TABLE 87 NORTH AMERICA BRANDED GENERICS MARKET, BY PRODUCT TYPE, 2018-2032 (USD THOUSAND)
TABLE 88 NORTH AMERICA VALUE-ADDED BRANDED GENERICS IN BRANDED GENERICS MARKET, BY REGION, 2018-2032 (USD THOUSAND)
TABLE 89 NORTH AMERICA TRADE NAMED GENERICS IN BRANDED GENERICS MARKET, BY REGION, 2018-2032 (USD THOUSAND)
TABLE 90 NORTH AMERICA BRANDED GENERICS MARKET, BY PATIENT DEMOGRAPHICS, 2018-2032 (USD THOUSAND)
TABLE 91 NORTH AMERICA ADULT IN BRANDED GENERICS MARKET, BY REGION, 2018-2032 (USD THOUSAND)
TABLE 92 NORTH AMERICA GERIATRIC IN BRANDED GENERICS MARKET, BY REGION, 2018-2032 (USD THOUSAND)
TABLE 93 NORTH AMERICA PEDIATRIC IN BRANDED GENERICS MARKET, BY REGION, 2018-2032 (USD THOUSAND)
TABLE 94 NORTH AMERICA BRANDED GENERICS MARKET, BY END USER, 2018-2032 (USD THOUSAND)
TABLE 95 NORTH AMERICA HOSPITALS IN BRANDED GENERICS MARKET, BY REGION, 2018-2032 (USD THOUSAND)
TABLE 96 NORTH AMERICA CLINICS IN BRANDED GENERICS MARKET, BY REGION, 2018-2032 (USD THOUSAND)
TABLE 97 NORTH AMERICA HOMECARE IN BRANDED GENERICS MARKET, BY REGION, 2018-2032 (USD THOUSAND)
TABLE 98 NORTH AMERICA ACADEMIC & RESEARCH INSTITUTES IN BRANDED GENERICS MARKET, BY REGION, 2018-2032 (USD THOUSAND)
TABLE 99 NORTH AMERICA OTHERS IN BRANDED GENERICS MARKET, BY REGION, 2018-2032 (USD THOUSAND)
TABLE 100 NORTH AMERICA BRANDED GENERICS MARKET, BY DISTRIBUTION CHANNEL, 2018-2032 (USD THOUSAND)
TABLE 101 NORTH AMERICA RETAIL PHARMACIES IN BRANDED GENERICS MARKET, BY REGION, 2018-2032 (USD THOUSAND)
TABLE 102 NORTH AMERICA RETAIL PHARMACIES IN BRANDED GENERICS MARKET, BY TYPE, 2018-2032 (USD THOUSAND)
TABLE 103 NORTH AMERICA HOSPITAL PHARMACIES IN BRANDED GENERICS MARKET, BY REGION, 2018-2032 (USD THOUSAND)
TABLE 104 NORTH AMERICA DIRECT TENDERS IN BRANDED GENERICS MARKET, BY REGION, 2018-2032 (USD THOUSAND)
TABLE 105 NORTH AMERICA OTHERS IN BRANDED GENERICS MARKET, BY REGION, 2018-2032 (USD THOUSAND)
TABLE 106 NORTH AMERICA BRANDED GENERICS MARKET, BY COUNTRY, 2018-2032 (USD THOUSAND)
TABLE 107 NORTH AMERICA BRANDED GENERICS MARKET, BY DRUG CLASS, 2018-2032 (USD THOUSAND)
TABLE 108 NORTH AMERICA ANTI-HYPERTENSIVE IN BRANDED GENERICS MARKET, BY TYPE, 2018-2032 (USD THOUSAND)
TABLE 109 NORTH AMERICA DIURETICS IN BRANDED GENERICS MARKET, BY TYPE, 2018-2032 (USD THOUSAND)
TABLE 110 NORTH AMERICA ACE INHIBITORS (ANGIOTENSIN-CONVERTING ENZYME INHIBITORS) IN BRANDED GENERICS MARKET, BY TYPE, 2018-2032 (USD THOUSAND)
TABLE 111 NORTH AMERICA ANGIOTENSIN II RECEPTOR BLOCKERS (ARBS) IN BRANDED GENERICS MARKET, BY TYPE, 2018-2032 (USD THOUSAND)
TABLE 112 NORTH AMERICA BETA BLOCKERS (BBS) IN BRANDED GENERICS MARKET, BY TYPE, 2018-2032 (USD THOUSAND)
TABLE 113 NORTH AMERICA CALCIUM CHANNEL BLOCKERS (CCBS) IN BRANDED GENERICS MARKET, BY TYPE, 2018-2032 (USD THOUSAND)
TABLE 114 NORTH AMERICA DIRECT VASODILATORS IN BRANDED GENERICS MARKET, BY TYPE, 2018-2032 (USD THOUSAND)
TABLE 115 NORTH AMERICA ALPHA-1 BLOCKERS IN BRANDED GENERICS MARKET, BY TYPE, 2018-2032 (USD THOUSAND)
TABLE 116 NORTH AMERICA CENTRAL ALPHA-2 AGONISTS IN BRANDED GENERICS MARKET, BY TYPE, 2018-2032 (USD THOUSAND)
TABLE 117 NORTH AMERICA HORMONES IN BRANDED GENERICS MARKET, BY TYPE, 2018-2032 (USD THOUSAND)
TABLE 118 NORTH AMERICA STEROID HORMONES IN BRANDED GENERICS MARKET, BY TYPE, 2018-2032 (USD THOUSAND)
TABLE 119 NORTH AMERICA SEX HORMONES IN BRANDED GENERICS MARKET, BY TYPE, 2018-2032 (USD THOUSAND)
TABLE 120 NORTH AMERICA ESTROGENS IN BRANDED GENERICS MARKET, BY TYPE, 2018-2032 (USD THOUSAND)
TABLE 121 NORTH AMERICA PROGESTOGENS IN BRANDED GENERICS MARKET, BY TYPE, 2018-2032 (USD THOUSAND)
TABLE 122 NORTH AMERICA ANDROGENS IN BRANDED GENERICS MARKET, BY TYPE, 2018-2032 (USD THOUSAND)
TABLE 123 NORTH AMERICA THYROID HORMONES IN BRANDED GENERICS MARKET, BY TYPE, 2018-2032 (USD THOUSAND)
TABLE 124 NORTH AMERICA OTHER HORMONES IN BRANDED GENERICS MARKET, BY TYPE, 2018-2032 (USD THOUSAND)
TABLE 125 NORTH AMERICA ANTIMETABOLITES IN BRANDED GENERICS MARKET, BY TYPE, 2018-2032 (USD THOUSAND)
TABLE 126 NORTH AMERICA PURINE ANALOGUES IN BRANDED GENERICS MARKET, BY TYPE, 2018-2032 (USD THOUSAND)
TABLE 127 NORTH AMERICA PYRIMIDINE ANALOGUES IN BRANDED GENERICS MARKET, BY TYPE, 2018-2032 (USD THOUSAND)
TABLE 128 NORTH AMERICA FOLATE ANTAGONISTS IN BRANDED GENERICS MARKET, BY TYPE, 2018-2032 (USD THOUSAND)
TABLE 129 NORTH AMERICA LIPID LOWERING DRUGS IN BRANDED GENERICS MARKET, BY TYPE, 2018-2032 (USD THOUSAND)
TABLE 130 NORTH AMERICA STATINS (HMG-COA REDUCTASE INHIBITORS) IN BRANDED GENERICS MARKET, BY TYPE, 2018-2032 (USD THOUSAND)
TABLE 131 NORTH AMERICA COMBINATION PRODUCTS AND OTHER AGENTS IN BRANDED GENERICS MARKET, BY TYPE, 2018-2032 (USD THOUSAND)
TABLE 132 NORTH AMERICA FIBRATES IN BRANDED GENERICS MARKET, BY TYPE, 2018-2032 (USD THOUSAND)
TABLE 133 NORTH AMERICA BILE ACID SEQUESTRANTS IN BRANDED GENERICS MARKET, BY TYPE, 2018-2032 (USD THOUSAND)
TABLE 134 NORTH AMERICA PCSK9 INHIBITORS IN BRANDED GENERICS MARKET, BY TYPE, 2018-2032 (USD THOUSAND)
TABLE 135 NORTH AMERICA ANTI-EPILEPTICS IN BRANDED GENERICS MARKET, BY TYPE, 2018-2032 (USD THOUSAND)
TABLE 136 NORTH AMERICA ALKYLATING AGENTS IN BRANDED GENERICS MARKET, BY TYPE, 2018-2032 (USD THOUSAND)
TABLE 137 NORTH AMERICA NITROGEN MUSTARDS IN BRANDED GENERICS MARKET, BY TYPE, 2018-2032 (USD THOUSAND)
TABLE 138 NORTH AMERICA NITROSOUREAS IN BRANDED GENERICS MARKET, BY TYPE, 2018-2032 (USD THOUSAND)
TABLE 139 NORTH AMERICA ALKYL SULFONATES IN BRANDED GENERICS MARKET, BY TYPE, 2018-2032 (USD THOUSAND)
TABLE 140 NORTH AMERICA TRIAZENES IN BRANDED GENERICS MARKET, BY TYPE, 2018-2032 (USD THOUSAND)
TABLE 141 NORTH AMERICA ETHYLENIMINES IN BRANDED GENERICS MARKET, BY TYPE, 2018-2032 (USD THOUSAND)
TABLE 142 NORTH AMERICA ANTI-DEPRESSANTS IN BRANDED GENERICS MARKET, BY TYPE, 2018-2032 (USD THOUSAND)
TABLE 143 NORTH AMERICA SELECTIVE SEROTONIN REUPTAKE INHIBITORS (SSRIS) IN BRANDED GENERICS MARKET, BY TYPE, 2018-2032 (USD THOUSAND)
TABLE 144 NORTH AMERICA SEROTONIN-NOREPINEPHRINE REUPTAKE INHIBITORS (SNRIS) IN BRANDED GENERICS MARKET, BY TYPE, 2018-2032 (USD THOUSAND)
TABLE 145 NORTH AMERICA TRICYCLIC ANTIDEPRESSANTS (TCAS) IN BRANDED GENERICS MARKET, BY TYPE, 2018-2032 (USD THOUSAND)
TABLE 146 NORTH AMERICA ATYPICAL ANTIDEPRESSANTS IN BRANDED GENERICS MARKET, BY TYPE, 2018-2032 (USD THOUSAND)
TABLE 147 NORTH AMERICA MONOAMINE OXIDASE INHIBITORS (MAOIS) IN BRANDED GENERICS MARKET, BY TYPE, 2018-2032 (USD THOUSAND)
TABLE 148 NORTH AMERICA NMDA RECEPTOR ANTAGONISTS IN BRANDED GENERICS MARKET, BY TYPE, 2018-2032 (USD THOUSAND)
TABLE 149 NORTH AMERICA ANTIPSYCHOTICS IN BRANDED GENERICS MARKET, BY TYPE, 2018-2032 (USD THOUSAND)
TABLE 150 NORTH AMERICA SECOND-GENERATION (ATYPICAL) ANTIPSYCHOTICS IN BRANDED GENERICS MARKET, BY TYPE, 2018-2032 (USD THOUSAND)
TABLE 151 NORTH AMERICA FIRST-GENERATION (TYPICAL) ANTIPSYCHOTICS IN BRANDED GENERICS MARKET, BY TYPE, 2018-2032 (USD THOUSAND)
TABLE 152 NORTH AMERICA PHENOTHIAZINES IN BRANDED GENERICS MARKET, BY TYPE, 2018-2032 (USD THOUSAND)
TABLE 153 NORTH AMERICA THIOXANTHENES IN BRANDED GENERICS MARKET, BY TYPE, 2018-2032 (USD THOUSAND)
TABLE 154 NORTH AMERICA NEXT-GENERATION ANTIPSYCHOTICS IN BRANDED GENERICS MARKET, BY TYPE, 2018-2032 (USD THOUSAND)
TABLE 155 NORTH AMERICA BRANDED GENERICS MARKET, BY APPLICATION, 2018-2032 (USD THOUSAND)
TABLE 156 NORTH AMERICA CARDIOVASCULAR DISEASES IN BRANDED GENERICS MARKET, BY TYPE, 2018-2032 (USD THOUSAND)
TABLE 157 NORTH AMERICA PAIN MANAGEMENT AND ANTI‑INFLAMMATORY IN BRANDED GENERICS MARKET, BY TYPE, 2018-2032 (USD THOUSAND)
TABLE 158 NORTH AMERICA ONCOLOGY IN BRANDED GENERICS MARKET, BY TYPE, 2018-2032 (USD THOUSAND)
TABLE 159 NORTH AMERICA SOLID TUMORS IN BRANDED GENERICS MARKET, BY TYPE, 2018-2032 (USD THOUSAND)
TABLE 160 NORTH AMERICA HEMATOLOGIC MALIGNANCIES IN BRANDED GENERICS MARKET, BY TYPE, 2018-2032 (USD THOUSAND)
TABLE 161 NORTH AMERICA DIABETES IN BRANDED GENERICS MARKET, BY TYPE, 2018-2032 (USD THOUSAND)
TABLE 162 NORTH AMERICA NEUROLOGY IN BRANDED GENERICS MARKET, BY TYPE, 2018-2032 (USD THOUSAND)
TABLE 163 NORTH AMERICA GASTROINTESTINAL DISEASES IN BRANDED GENERICS MARKET, BY TYPE, 2018-2032 (USD THOUSAND)
TABLE 164 NORTH AMERICA DERMATOLOGY IN BRANDED GENERICS MARKET, BY TYPE, 2018-2032 (USD THOUSAND)
TABLE 165 NORTH AMERICA OTHERS IN BRANDED GENERICS MARKET, BY TYPE, 2018-2032 (USD THOUSAND)
TABLE 166 NORTH AMERICA BRANDED GENERICS MARKET, BY ROUTE OF ADMINISTRATION, 2018-2032 (USD THOUSAND)
TABLE 167 NORTH AMERICA ORAL IN BRANDED GENERICS MARKET, BY TYPE, 2018-2032 (USD THOUSAND)
TABLE 168 NORTH AMERICA INJECTABLE IN BRANDED GENERICS MARKET, BY TYPE, 2018-2032 (USD THOUSAND)
TABLE 169 NORTH AMERICA TOPICAL ADMINISTRATION IN BRANDED GENERICS MARKET, BY TYPE, 2018-2032 (USD THOUSAND)
TABLE 170 NORTH AMERICA BRANDED GENERICS MARKET, BY PRODUCT TYPE, 2018-2032 (USD THOUSAND)
TABLE 171 NORTH AMERICA BRANDED GENERICS MARKET, BY PATIENT DEMOGRAPHICS, 2018-2032 (USD THOUSAND)
TABLE 172 NORTH AMERICA BRANDED GENERICS MARKET, BY END USER, 2018-2032 (USD THOUSAND)
TABLE 173 NORTH AMERICA BRANDED GENERICS MARKET, BY DISTRIBUTION CHANNEL, 2018-2032 (USD THOUSAND)
TABLE 174 NORTH AMERICA RETAIL PHARMACIES IN BRANDED GENERICS MARKET, BY TYPE, 2018-2032 (USD THOUSAND)
TABLE 175 U.S. BRANDED GENERICS MARKET, BY DRUG CLASS, 2018-2032 (USD THOUSAND)
TABLE 176 U.S. ANTI-HYPERTENSIVE IN BRANDED GENERICS MARKET, BY TYPE, 2018-2032 (USD THOUSAND)
TABLE 177 U.S. DIURETICS IN BRANDED GENERICS MARKET, BY TYPE, 2018-2032 (USD THOUSAND)
TABLE 178 U.S. ACE INHIBITORS (ANGIOTENSIN-CONVERTING ENZYME INHIBITORS) IN BRANDED GENERICS MARKET, BY TYPE, 2018-2032 (USD THOUSAND)
TABLE 179 U.S. ANGIOTENSIN II RECEPTOR BLOCKERS (ARBS) IN BRANDED GENERICS MARKET, BY TYPE, 2018-2032 (USD THOUSAND)
TABLE 180 U.S. BETA BLOCKERS (BBS) IN BRANDED GENERICS MARKET, BY TYPE, 2018-2032 (USD THOUSAND)
TABLE 181 U.S. CALCIUM CHANNEL BLOCKERS (CCBS) IN BRANDED GENERICS MARKET, BY TYPE, 2018-2032 (USD THOUSAND)
TABLE 182 U.S. DIRECT VASODILATORS IN BRANDED GENERICS MARKET, BY TYPE, 2018-2032 (USD THOUSAND)
TABLE 183 U.S. ALPHA-1 BLOCKERS IN BRANDED GENERICS MARKET, BY TYPE, 2018-2032 (USD THOUSAND)
TABLE 184 U.S. CENTRAL ALPHA-2 AGONISTS IN BRANDED GENERICS MARKET, BY TYPE, 2018-2032 (USD THOUSAND)
TABLE 185 U.S. HORMONES IN BRANDED GENERICS MARKET, BY TYPE, 2018-2032 (USD THOUSAND)
TABLE 186 U.S. STEROID HORMONES IN BRANDED GENERICS MARKET, BY TYPE, 2018-2032 (USD THOUSAND)
TABLE 187 U.S. SEX HORMONES IN BRANDED GENERICS MARKET, BY TYPE, 2018-2032 (USD THOUSAND)
TABLE 188 U.S. ESTROGENS IN BRANDED GENERICS MARKET, BY TYPE, 2018-2032 (USD THOUSAND)
TABLE 189 U.S. PROGESTOGENS IN BRANDED GENERICS MARKET, BY TYPE, 2018-2032 (USD THOUSAND)
TABLE 190 U.S. ANDROGENS IN BRANDED GENERICS MARKET, BY TYPE, 2018-2032 (USD THOUSAND)
TABLE 191 U.S. THYROID HORMONES IN BRANDED GENERICS MARKET, BY TYPE, 2018-2032 (USD THOUSAND)
TABLE 192 U.S. OTHER HORMONES IN BRANDED GENERICS MARKET, BY TYPE, 2018-2032 (USD THOUSAND)
TABLE 193 U.S. ANTIMETABOLITES IN BRANDED GENERICS MARKET, BY TYPE, 2018-2032 (USD THOUSAND)
TABLE 194 U.S. PURINE ANALOGUES IN BRANDED GENERICS MARKET, BY TYPE, 2018-2032 (USD THOUSAND)
TABLE 195 U.S. PYRIMIDINE ANALOGUES IN BRANDED GENERICS MARKET, BY TYPE, 2018-2032 (USD THOUSAND)
TABLE 196 U.S. FOLATE ANTAGONISTS IN BRANDED GENERICS MARKET, BY TYPE, 2018-2032 (USD THOUSAND)
TABLE 197 U.S. LIPID LOWERING DRUGS IN BRANDED GENERICS MARKET, BY TYPE, 2018-2032 (USD THOUSAND)
TABLE 198 U.S. STATINS (HMG-COA REDUCTASE INHIBITORS) IN BRANDED GENERICS MARKET, BY TYPE, 2018-2032 (USD THOUSAND)
TABLE 199 U.S. COMBINATION PRODUCTS AND OTHER AGENTS IN BRANDED GENERICS MARKET, BY TYPE, 2018-2032 (USD THOUSAND)
TABLE 200 U.S. FIBRATES IN BRANDED GENERICS MARKET, BY TYPE, 2018-2032 (USD THOUSAND)
TABLE 201 U.S. BILE ACID SEQUESTRANTS IN BRANDED GENERICS MARKET, BY TYPE, 2018-2032 (USD THOUSAND)
TABLE 202 U.S. PCSK9 INHIBITORS IN BRANDED GENERICS MARKET, BY TYPE, 2018-2032 (USD THOUSAND)
TABLE 203 U.S. ANTI-EPILEPTICS IN BRANDED GENERICS MARKET, BY TYPE, 2018-2032 (USD THOUSAND)
TABLE 204 U.S. ALKYLATING AGENTS IN BRANDED GENERICS MARKET, BY TYPE, 2018-2032 (USD THOUSAND)
TABLE 205 U.S. NITROGEN MUSTARDS IN BRANDED GENERICS MARKET, BY TYPE, 2018-2032 (USD THOUSAND)
TABLE 206 U.S. NITROSOUREAS IN BRANDED GENERICS MARKET, BY TYPE, 2018-2032 (USD THOUSAND)
TABLE 207 U.S. ALKYL SULFONATES IN BRANDED GENERICS MARKET, BY TYPE, 2018-2032 (USD THOUSAND)
TABLE 208 U.S. TRIAZENES IN BRANDED GENERICS MARKET, BY TYPE, 2018-2032 (USD THOUSAND)
TABLE 209 U.S. ETHYLENIMINES IN BRANDED GENERICS MARKET, BY TYPE, 2018-2032 (USD THOUSAND)
TABLE 210 U.S. ANTI-DEPRESSANTS IN BRANDED GENERICS MARKET, BY TYPE, 2018-2032 (USD THOUSAND)
TABLE 211 U.S. SELECTIVE SEROTONIN REUPTAKE INHIBITORS (SSRIS) IN BRANDED GENERICS MARKET, BY TYPE, 2018-2032 (USD THOUSAND)
TABLE 212 U.S. SEROTONIN-NOREPINEPHRINE REUPTAKE INHIBITORS (SNRIS) IN BRANDED GENERICS MARKET, BY TYPE, 2018-2032 (USD THOUSAND)
TABLE 213 U.S. TRICYCLIC ANTIDEPRESSANTS (TCAS) IN BRANDED GENERICS MARKET, BY TYPE, 2018-2032 (USD THOUSAND)
TABLE 214 U.S. ATYPICAL ANTIDEPRESSANTS IN BRANDED GENERICS MARKET, BY TYPE, 2018-2032 (USD THOUSAND)
TABLE 215 U.S. MONOAMINE OXIDASE INHIBITORS (MAOIS) IN BRANDED GENERICS MARKET, BY TYPE, 2018-2032 (USD THOUSAND)
TABLE 216 U.S. NMDA RECEPTOR ANTAGONISTS IN BRANDED GENERICS MARKET, BY TYPE, 2018-2032 (USD THOUSAND)
TABLE 217 U.S. ANTIPSYCHOTICS IN BRANDED GENERICS MARKET, BY TYPE, 2018-2032 (USD THOUSAND)
TABLE 218 U.S. SECOND-GENERATION (ATYPICAL) ANTIPSYCHOTICS IN BRANDED GENERICS MARKET, BY TYPE, 2018-2032 (USD THOUSAND)
TABLE 219 U.S. FIRST-GENERATION (TYPICAL) ANTIPSYCHOTICS IN BRANDED GENERICS MARKET, BY TYPE, 2018-2032 (USD THOUSAND)
TABLE 220 U.S. PHENOTHIAZINES IN BRANDED GENERICS MARKET, BY TYPE, 2018-2032 (USD THOUSAND)
TABLE 221 U.S. THIOXANTHENES IN BRANDED GENERICS MARKET, BY TYPE, 2018-2032 (USD THOUSAND)
TABLE 222 U.S. NEXT-GENERATION ANTIPSYCHOTICS IN BRANDED GENERICS MARKET, BY TYPE, 2018-2032 (USD THOUSAND)
TABLE 223 U.S. BRANDED GENERICS MARKET, BY APPLICATION, 2018-2032 (USD THOUSAND)
TABLE 224 U.S. CARDIOVASCULAR DISEASES IN BRANDED GENERICS MARKET, BY TYPE, 2018-2032 (USD THOUSAND)
TABLE 225 U.S. PAIN MANAGEMENT AND ANTI‑INFLAMMATORY IN BRANDED GENERICS MARKET, BY TYPE, 2018-2032 (USD THOUSAND)
TABLE 226 U.S. ONCOLOGY IN BRANDED GENERICS MARKET, BY TYPE, 2018-2032 (USD THOUSAND)
TABLE 227 U.S. SOLID TUMORS IN BRANDED GENERICS MARKET, BY TYPE, 2018-2032 (USD THOUSAND)
TABLE 228 U.S. HEMATOLOGIC MALIGNANCIES IN BRANDED GENERICS MARKET, BY TYPE, 2018-2032 (USD THOUSAND)
TABLE 229 U.S. DIABETES IN BRANDED GENERICS MARKET, BY TYPE, 2018-2032 (USD THOUSAND)
TABLE 230 U.S. NEUROLOGY IN BRANDED GENERICS MARKET, BY TYPE, 2018-2032 (USD THOUSAND)
TABLE 231 U.S. GASTROINTESTINAL DISEASES IN BRANDED GENERICS MARKET, BY TYPE, 2018-2032 (USD THOUSAND)
TABLE 232 U.S. DERMATOLOGY IN BRANDED GENERICS MARKET, BY TYPE, 2018-2032 (USD THOUSAND)
TABLE 233 U.S. OTHERS IN BRANDED GENERICS MARKET, BY TYPE, 2018-2032 (USD THOUSAND)
TABLE 234 U.S. BRANDED GENERICS MARKET, BY ROUTE OF ADMINISTRATION, 2018-2032 (USD THOUSAND)
TABLE 235 U.S. ORAL IN BRANDED GENERICS MARKET, BY TYPE, 2018-2032 (USD THOUSAND)
TABLE 236 U.S. INJECTABLE IN BRANDED GENERICS MARKET, BY TYPE, 2018-2032 (USD THOUSAND)
TABLE 237 U.S. TOPICAL ADMINISTRATION IN BRANDED GENERICS MARKET, BY TYPE, 2018-2032 (USD THOUSAND)
TABLE 238 U.S. BRANDED GENERICS MARKET, BY PRODUCT TYPE, 2018-2032 (USD THOUSAND)
TABLE 239 U.S. BRANDED GENERICS MARKET, BY PATIENT DEMOGRAPHICS, 2018-2032 (USD THOUSAND)
TABLE 240 U.S. BRANDED GENERICS MARKET, BY END USER, 2018-2032 (USD THOUSAND)
TABLE 241 U.S. BRANDED GENERICS MARKET, BY DISTRIBUTION CHANNEL, 2018-2032 (USD THOUSAND)
TABLE 242 U.S. RETAIL PHARMACIES IN BRANDED GENERICS MARKET, BY TYPE, 2018-2032 (USD THOUSAND)
TABLE 243 CANADA BRANDED GENERICS MARKET, BY DRUG CLASS, 2018-2032 (USD THOUSAND)
TABLE 244 CANADA ANTI-HYPERTENSIVE IN BRANDED GENERICS MARKET, BY TYPE, 2018-2032 (USD THOUSAND)
TABLE 245 CANADA DIURETICS IN BRANDED GENERICS MARKET, BY TYPE, 2018-2032 (USD THOUSAND)
TABLE 246 CANADA ACE INHIBITORS (ANGIOTENSIN-CONVERTING ENZYME INHIBITORS) IN BRANDED GENERICS MARKET, BY TYPE, 2018-2032 (USD THOUSAND)
TABLE 247 CANADA ANGIOTENSIN II RECEPTOR BLOCKERS (ARBS) IN BRANDED GENERICS MARKET, BY TYPE, 2018-2032 (USD THOUSAND)
TABLE 248 CANADA BETA BLOCKERS (BBS) IN BRANDED GENERICS MARKET, BY TYPE, 2018-2032 (USD THOUSAND)
TABLE 249 CANADA CALCIUM CHANNEL BLOCKERS (CCBS) IN BRANDED GENERICS MARKET, BY TYPE, 2018-2032 (USD THOUSAND)
TABLE 250 CANADA DIRECT VASODILATORS IN BRANDED GENERICS MARKET, BY TYPE, 2018-2032 (USD THOUSAND)
TABLE 251 CANADA ALPHA-1 BLOCKERS IN BRANDED GENERICS MARKET, BY TYPE, 2018-2032 (USD THOUSAND)
TABLE 252 CANADA CENTRAL ALPHA-2 AGONISTS IN BRANDED GENERICS MARKET, BY TYPE, 2018-2032 (USD THOUSAND)
TABLE 253 CANADA HORMONES IN BRANDED GENERICS MARKET, BY TYPE, 2018-2032 (USD THOUSAND)
TABLE 254 CANADA STEROID HORMONES IN BRANDED GENERICS MARKET, BY TYPE, 2018-2032 (USD THOUSAND)
TABLE 255 CANADA SEX HORMONES IN BRANDED GENERICS MARKET, BY TYPE, 2018-2032 (USD THOUSAND)
TABLE 256 CANADA ESTROGENS IN BRANDED GENERICS MARKET, BY TYPE, 2018-2032 (USD THOUSAND)
TABLE 257 CANADA PROGESTOGENS IN BRANDED GENERICS MARKET, BY TYPE, 2018-2032 (USD THOUSAND)
TABLE 258 CANADA ANDROGENS IN BRANDED GENERICS MARKET, BY TYPE, 2018-2032 (USD THOUSAND)
TABLE 259 CANADA THYROID HORMONES IN BRANDED GENERICS MARKET, BY TYPE, 2018-2032 (USD THOUSAND)
TABLE 260 262
TABLE 261 CANADA OTHER HORMONES IN BRANDED GENERICS MARKET, BY TYPE, 2018-2032 (USD THOUSAND)
TABLE 262 CANADA ANTIMETABOLITES IN BRANDED GENERICS MARKET, BY TYPE, 2018-2032 (USD THOUSAND)
TABLE 263 CANADA PURINE ANALOGUES IN BRANDED GENERICS MARKET, BY TYPE, 2018-2032 (USD THOUSAND)
TABLE 264 CANADA PYRIMIDINE ANALOGUES IN BRANDED GENERICS MARKET, BY TYPE, 2018-2032 (USD THOUSAND)
TABLE 265 CANADA FOLATE ANTAGONISTS IN BRANDED GENERICS MARKET, BY TYPE, 2018-2032 (USD THOUSAND)
TABLE 266 CANADA LIPID LOWERING DRUGS IN BRANDED GENERICS MARKET, BY TYPE, 2018-2032 (USD THOUSAND)
TABLE 267 CANADA STATINS (HMG-COA REDUCTASE INHIBITORS) IN BRANDED GENERICS MARKET, BY TYPE, 2018-2032 (USD THOUSAND)
TABLE 268 CANADA COMBINATION PRODUCTS AND OTHER AGENTS IN BRANDED GENERICS MARKET, BY TYPE, 2018-2032 (USD THOUSAND)
TABLE 269 CANADA FIBRATES IN BRANDED GENERICS MARKET, BY TYPE, 2018-2032 (USD THOUSAND)
TABLE 270 CANADA BILE ACID SEQUESTRANTS IN BRANDED GENERICS MARKET, BY TYPE, 2018-2032 (USD THOUSAND)
TABLE 271 CANADA PCSK9 INHIBITORS IN BRANDED GENERICS MARKET, BY TYPE, 2018-2032 (USD THOUSAND)
TABLE 272 CANADA ANTI-EPILEPTICS IN BRANDED GENERICS MARKET, BY TYPE, 2018-2032 (USD THOUSAND)
TABLE 273 CANADA ALKYLATING AGENTS IN BRANDED GENERICS MARKET, BY TYPE, 2018-2032 (USD THOUSAND)
TABLE 274 CANADA NITROGEN MUSTARDS IN BRANDED GENERICS MARKET, BY TYPE, 2018-2032 (USD THOUSAND)
TABLE 275 CANADA NITROSOUREAS IN BRANDED GENERICS MARKET, BY TYPE, 2018-2032 (USD THOUSAND)
TABLE 276 CANADA ALKYL SULFONATES IN BRANDED GENERICS MARKET, BY TYPE, 2018-2032 (USD THOUSAND)
TABLE 277 CANADA TRIAZENES IN BRANDED GENERICS MARKET, BY TYPE, 2018-2032 (USD THOUSAND)
TABLE 278 CANADA ETHYLENIMINES IN BRANDED GENERICS MARKET, BY TYPE, 2018-2032 (USD THOUSAND)
TABLE 279 CANADA ANTI-DEPRESSANTS IN BRANDED GENERICS MARKET, BY TYPE, 2018-2032 (USD THOUSAND)
TABLE 280 CANADA SELECTIVE SEROTONIN REUPTAKE INHIBITORS (SSRIS) IN BRANDED GENERICS MARKET, BY TYPE, 2018-2032 (USD THOUSAND)
TABLE 281 CANADA SEROTONIN-NOREPINEPHRINE REUPTAKE INHIBITORS (SNRIS) IN BRANDED GENERICS MARKET, BY TYPE, 2018-2032 (USD THOUSAND)
TABLE 282 CANADA TRICYCLIC ANTIDEPRESSANTS (TCAS) IN BRANDED GENERICS MARKET, BY TYPE, 2018-2032 (USD THOUSAND)
TABLE 283 CANADA ATYPICAL ANTIDEPRESSANTS IN BRANDED GENERICS MARKET, BY TYPE, 2018-2032 (USD THOUSAND)
TABLE 284 CANADA MONOAMINE OXIDASE INHIBITORS (MAOIS) IN BRANDED GENERICS MARKET, BY TYPE, 2018-2032 (USD THOUSAND)
TABLE 285 CANADA NMDA RECEPTOR ANTAGONISTS IN BRANDED GENERICS MARKET, BY TYPE, 2018-2032 (USD THOUSAND)
TABLE 286 CANADA ANTIPSYCHOTICS IN BRANDED GENERICS MARKET, BY TYPE, 2018-2032 (USD THOUSAND)
TABLE 287 CANADA SECOND-GENERATION (ATYPICAL) ANTIPSYCHOTICS IN BRANDED GENERICS MARKET, BY TYPE, 2018-2032 (USD THOUSAND)
TABLE 288 CANADA FIRST-GENERATION (TYPICAL) ANTIPSYCHOTICS IN BRANDED GENERICS MARKET, BY TYPE, 2018-2032 (USD THOUSAND)
TABLE 289 CANADA PHENOTHIAZINES IN BRANDED GENERICS MARKET, BY TYPE, 2018-2032 (USD THOUSAND)
TABLE 290 CANADA THIOXANTHENES IN BRANDED GENERICS MARKET, BY TYPE, 2018-2032 (USD THOUSAND)
TABLE 291 CANADA NEXT-GENERATION ANTIPSYCHOTICS IN BRANDED GENERICS MARKET, BY TYPE, 2018-2032 (USD THOUSAND)
TABLE 292 CANADA BRANDED GENERICS MARKET, BY APPLICATION, 2018-2032 (USD THOUSAND)
TABLE 293 CANADA CARDIOVASCULAR DISEASES IN BRANDED GENERICS MARKET, BY TYPE, 2018-2032 (USD THOUSAND)
TABLE 294 CANADA PAIN MANAGEMENT AND ANTI‑INFLAMMATORY IN BRANDED GENERICS MARKET, BY TYPE, 2018-2032 (USD THOUSAND)
TABLE 295 CANADA ONCOLOGY IN BRANDED GENERICS MARKET, BY TYPE, 2018-2032 (USD THOUSAND)
TABLE 296 CANADA SOLID TUMORS IN BRANDED GENERICS MARKET, BY TYPE, 2018-2032 (USD THOUSAND)
TABLE 297 CANADA HEMATOLOGIC MALIGNANCIES IN BRANDED GENERICS MARKET, BY TYPE, 2018-2032 (USD THOUSAND)
TABLE 298 CANADA DIABETES IN BRANDED GENERICS MARKET, BY TYPE, 2018-2032 (USD THOUSAND)
TABLE 299 CANADA NEUROLOGY IN BRANDED GENERICS MARKET, BY TYPE, 2018-2032 (USD THOUSAND)
TABLE 300 CANADA GASTROINTESTINAL DISEASES IN BRANDED GENERICS MARKET, BY TYPE, 2018-2032 (USD THOUSAND)
TABLE 301 CANADA DERMATOLOGY IN BRANDED GENERICS MARKET, BY TYPE, 2018-2032 (USD THOUSAND)
TABLE 302 CANADA OTHERS IN BRANDED GENERICS MARKET, BY TYPE, 2018-2032 (USD THOUSAND)
TABLE 303 CANADA BRANDED GENERICS MARKET, BY ROUTE OF ADMINISTRATION, 2018-2032 (USD THOUSAND)
TABLE 304 CANADA ORAL IN BRANDED GENERICS MARKET, BY TYPE, 2018-2032 (USD THOUSAND)
TABLE 305 CANADA INJECTABLE IN BRANDED GENERICS MARKET, BY TYPE, 2018-2032 (USD THOUSAND)
TABLE 306 CANADA TOPICAL ADMINISTRATION IN BRANDED GENERICS MARKET, BY TYPE, 2018-2032 (USD THOUSAND)
TABLE 307 CANADA BRANDED GENERICS MARKET, BY PRODUCT TYPE, 2018-2032 (USD THOUSAND)
TABLE 308 CANADA BRANDED GENERICS MARKET, BY PATIENT DEMOGRAPHICS, 2018-2032 (USD THOUSAND)
TABLE 309 CANADA BRANDED GENERICS MARKET, BY END USER, 2018-2032 (USD THOUSAND)
TABLE 310 CANADA BRANDED GENERICS MARKET, BY DISTRIBUTION CHANNEL, 2018-2032 (USD THOUSAND)
TABLE 311 CANADA RETAIL PHARMACIES IN BRANDED GENERICS MARKET, BY TYPE, 2018-2032 (USD THOUSAND)
TABLE 312 MEXICO BRANDED GENERICS MARKET, BY DRUG CLASS, 2018-2032 (USD THOUSAND)
TABLE 313 MEXICO ANTI-HYPERTENSIVE IN BRANDED GENERICS MARKET, BY TYPE, 2018-2032 (USD THOUSAND)
TABLE 314 MEXICO DIURETICS IN BRANDED GENERICS MARKET, BY TYPE, 2018-2032 (USD THOUSAND)
TABLE 315 MEXICO ACE INHIBITORS (ANGIOTENSIN-CONVERTING ENZYME INHIBITORS) IN BRANDED GENERICS MARKET, BY TYPE, 2018-2032 (USD THOUSAND)
TABLE 316 MEXICO ANGIOTENSIN II RECEPTOR BLOCKERS (ARBS) IN BRANDED GENERICS MARKET, BY TYPE, 2018-2032 (USD THOUSAND)
TABLE 317 MEXICO BETA BLOCKERS (BBS) IN BRANDED GENERICS MARKET, BY TYPE, 2018-2032 (USD THOUSAND)
TABLE 318 MEXICO CALCIUM CHANNEL BLOCKERS (CCBS) IN BRANDED GENERICS MARKET, BY TYPE, 2018-2032 (USD THOUSAND)
TABLE 319 MEXICO DIRECT VASODILATORS IN BRANDED GENERICS MARKET, BY TYPE, 2018-2032 (USD THOUSAND)
TABLE 320 MEXICO ALPHA-1 BLOCKERS IN BRANDED GENERICS MARKET, BY TYPE, 2018-2032 (USD THOUSAND)
TABLE 321 MEXICO CENTRAL ALPHA-2 AGONISTS IN BRANDED GENERICS MARKET, BY TYPE, 2018-2032 (USD THOUSAND)
TABLE 322 MEXICO HORMONES IN BRANDED GENERICS MARKET, BY TYPE, 2018-2032 (USD THOUSAND)
TABLE 323 MEXICO STEROID HORMONES IN BRANDED GENERICS MARKET, BY TYPE, 2018-2032 (USD THOUSAND)
TABLE 324 MEXICO SEX HORMONES IN BRANDED GENERICS MARKET, BY TYPE, 2018-2032 (USD THOUSAND)
TABLE 325 MEXICO ESTROGENS IN BRANDED GENERICS MARKET, BY TYPE, 2018-2032 (USD THOUSAND)
TABLE 326 MEXICO PROGESTOGENS IN BRANDED GENERICS MARKET, BY TYPE, 2018-2032 (USD THOUSAND)
TABLE 327 MEXICO ANDROGENS IN BRANDED GENERICS MARKET, BY TYPE, 2018-2032 (USD THOUSAND)
TABLE 328 MEXICO THYROID HORMONES IN BRANDED GENERICS MARKET, BY TYPE, 2018-2032 (USD THOUSAND)
TABLE 329 MEXICO OTHER HORMONES IN BRANDED GENERICS MARKET, BY TYPE, 2018-2032 (USD THOUSAND)
TABLE 330 MEXICO ANTIMETABOLITES IN BRANDED GENERICS MARKET, BY TYPE, 2018-2032 (USD THOUSAND)
TABLE 331 MEXICO PURINE ANALOGUES IN BRANDED GENERICS MARKET, BY TYPE, 2018-2032 (USD THOUSAND)
TABLE 332 MEXICO PYRIMIDINE ANALOGUES IN BRANDED GENERICS MARKET, BY TYPE, 2018-2032 (USD THOUSAND)
TABLE 333 MEXICO FOLATE ANTAGONISTS IN BRANDED GENERICS MARKET, BY TYPE, 2018-2032 (USD THOUSAND)
TABLE 334 MEXICO LIPID LOWERING DRUGS IN BRANDED GENERICS MARKET, BY TYPE, 2018-2032 (USD THOUSAND)
TABLE 335 MEXICO STATINS (HMG-COA REDUCTASE INHIBITORS) IN BRANDED GENERICS MARKET, BY TYPE, 2018-2032 (USD THOUSAND)
TABLE 336 MEXICO COMBINATION PRODUCTS AND OTHER AGENTS IN BRANDED GENERICS MARKET, BY TYPE, 2018-2032 (USD THOUSAND)
TABLE 337 MEXICO FIBRATES IN BRANDED GENERICS MARKET, BY TYPE, 2018-2032 (USD THOUSAND)
TABLE 338 MEXICO BILE ACID SEQUESTRANTS IN BRANDED GENERICS MARKET, BY TYPE, 2018-2032 (USD THOUSAND)
TABLE 339 MEXICO PCSK9 INHIBITORS IN BRANDED GENERICS MARKET, BY TYPE, 2018-2032 (USD THOUSAND)
TABLE 340 MEXICO ANTI-EPILEPTICS IN BRANDED GENERICS MARKET, BY TYPE, 2018-2032 (USD THOUSAND)
TABLE 341 MEXICO ALKYLATING AGENTS IN BRANDED GENERICS MARKET, BY TYPE, 2018-2032 (USD THOUSAND)
TABLE 342 MEXICO NITROGEN MUSTARDS IN BRANDED GENERICS MARKET, BY TYPE, 2018-2032 (USD THOUSAND)
TABLE 343 MEXICO NITROSOUREAS IN BRANDED GENERICS MARKET, BY TYPE, 2018-2032 (USD THOUSAND)
TABLE 344 MEXICO ALKYL SULFONATES IN BRANDED GENERICS MARKET, BY TYPE, 2018-2032 (USD THOUSAND)
TABLE 345 MEXICO TRIAZENES IN BRANDED GENERICS MARKET, BY TYPE, 2018-2032 (USD THOUSAND)
TABLE 346 MEXICO ETHYLENIMINES IN BRANDED GENERICS MARKET, BY TYPE, 2018-2032 (USD THOUSAND)
TABLE 347 MEXICO ANTI-DEPRESSANTS IN BRANDED GENERICS MARKET, BY TYPE, 2018-2032 (USD THOUSAND)
TABLE 348 MEXICO SELECTIVE SEROTONIN REUPTAKE INHIBITORS (SSRIS) IN BRANDED GENERICS MARKET, BY TYPE, 2018-2032 (USD THOUSAND)
TABLE 349 MEXICO SEROTONIN-NOREPINEPHRINE REUPTAKE INHIBITORS (SNRIS) IN BRANDED GENERICS MARKET, BY TYPE, 2018-2032 (USD THOUSAND)
TABLE 350 MEXICO TRICYCLIC ANTIDEPRESSANTS (TCAS) IN BRANDED GENERICS MARKET, BY TYPE, 2018-2032 (USD THOUSAND)
TABLE 351 MEXICO ATYPICAL ANTIDEPRESSANTS IN BRANDED GENERICS MARKET, BY TYPE, 2018-2032 (USD THOUSAND)
TABLE 352 MEXICO MONOAMINE OXIDASE INHIBITORS (MAOIS) IN BRANDED GENERICS MARKET, BY TYPE, 2018-2032 (USD THOUSAND)
TABLE 353 MEXICO NMDA RECEPTOR ANTAGONISTS IN BRANDED GENERICS MARKET, BY TYPE, 2018-2032 (USD THOUSAND)
TABLE 354 MEXICO ANTIPSYCHOTICS IN BRANDED GENERICS MARKET, BY TYPE, 2018-2032 (USD THOUSAND)
TABLE 355 MEXICO SECOND-GENERATION (ATYPICAL) ANTIPSYCHOTICS IN BRANDED GENERICS MARKET, BY TYPE, 2018-2032 (USD THOUSAND)
TABLE 356 MEXICO FIRST-GENERATION (TYPICAL) ANTIPSYCHOTICS IN BRANDED GENERICS MARKET, BY TYPE, 2018-2032 (USD THOUSAND)
TABLE 357 MEXICO PHENOTHIAZINES IN BRANDED GENERICS MARKET, BY TYPE, 2018-2032 (USD THOUSAND)
TABLE 358 MEXICO THIOXANTHENES IN BRANDED GENERICS MARKET, BY TYPE, 2018-2032 (USD THOUSAND)
TABLE 359 MEXICO NEXT-GENERATION ANTIPSYCHOTICS IN BRANDED GENERICS MARKET, BY TYPE, 2018-2032 (USD THOUSAND)
TABLE 360 MEXICO BRANDED GENERICS MARKET, BY APPLICATION, 2018-2032 (USD THOUSAND)
TABLE 361 MEXICO CARDIOVASCULAR DISEASES IN BRANDED GENERICS MARKET, BY TYPE, 2018-2032 (USD THOUSAND)
TABLE 362 MEXICO PAIN MANAGEMENT AND ANTI‑INFLAMMATORY IN BRANDED GENERICS MARKET, BY TYPE, 2018-2032 (USD THOUSAND)
TABLE 363 MEXICO ONCOLOGY IN BRANDED GENERICS MARKET, BY TYPE, 2018-2032 (USD THOUSAND)
TABLE 364 MEXICO SOLID TUMORS IN BRANDED GENERICS MARKET, BY TYPE, 2018-2032 (USD THOUSAND)
TABLE 365 MEXICO HEMATOLOGIC MALIGNANCIES IN BRANDED GENERICS MARKET, BY TYPE, 2018-2032 (USD THOUSAND)
TABLE 366 MEXICO DIABETES IN BRANDED GENERICS MARKET, BY TYPE, 2018-2032 (USD THOUSAND)
TABLE 367 MEXICO NEUROLOGY IN BRANDED GENERICS MARKET, BY TYPE, 2018-2032 (USD THOUSAND)
TABLE 368 MEXICO GASTROINTESTINAL DISEASES IN BRANDED GENERICS MARKET, BY TYPE, 2018-2032 (USD THOUSAND)
TABLE 369 MEXICO DERMATOLOGY IN BRANDED GENERICS MARKET, BY TYPE, 2018-2032 (USD THOUSAND)
TABLE 370 MEXICO OTHERS IN BRANDED GENERICS MARKET, BY TYPE, 2018-2032 (USD THOUSAND)
TABLE 371 MEXICO BRANDED GENERICS MARKET, BY ROUTE OF ADMINISTRATION, 2018-2032 (USD THOUSAND)
TABLE 372 MEXICO ORAL IN BRANDED GENERICS MARKET, BY TYPE, 2018-2032 (USD THOUSAND)
TABLE 373 MEXICO INJECTABLE IN BRANDED GENERICS MARKET, BY TYPE, 2018-2032 (USD THOUSAND)
TABLE 374 MEXICO TOPICAL ADMINISTRATION IN BRANDED GENERICS MARKET, BY TYPE, 2018-2032 (USD THOUSAND)
TABLE 375 MEXICO BRANDED GENERICS MARKET, BY PRODUCT TYPE, 2018-2032 (USD THOUSAND)
TABLE 376 MEXICO BRANDED GENERICS MARKET, BY PATIENT DEMOGRAPHICS, 2018-2032 (USD THOUSAND)
TABLE 377 MEXICO BRANDED GENERICS MARKET, BY END USER, 2018-2032 (USD THOUSAND)
TABLE 378 MEXICO BRANDED GENERICS MARKET, BY DISTRIBUTION CHANNEL, 2018-2032 (USD THOUSAND)
TABLE 379 MEXICO RETAIL PHARMACIES IN BRANDED GENERICS MARKET, BY TYPE, 2018-2032 (USD THOUSAND)
List of Figure
FIGURE 1 NORTH AMERICA BRANDED GENERICS MARKET: SEGMENTATION
FIGURE 2 NORTH AMERICA BRANDED GENERICS MARKET: DATA TRIANGULATION
FIGURE 3 NORTH AMERICA BRANDED GENERICS MARKET: DROC ANALYSIS
FIGURE 4 NORTH AMERICA BRANDED GENERICS MARKET: NORTH AMERICA VS. REGIONAL ANALYSIS
FIGURE 5 NORTH AMERICA BRANDED GENERICS MARKET: COMPANY RESEARCH ANALYSIS
FIGURE 6 NORTH AMERICA BRANDED GENERICS MARKET: INTERVIEW DEMOGRAPHICS
FIGURE 7 NORTH AMERICA BRANDED GENERICS MARKET: DBMR MARKET POSITION GRID
FIGURE 8 NORTH AMERICA BRANDED GENERICS MARKET: MARKET END USER COVERAGE GRID
FIGURE 9 EXECUTIVE SUMMARY
FIGURE 10 STRATEGIC DECISIONS
FIGURE 11 NINE SEGMENTS COMPRISE THE NORTH AMERICA BRANDED GENERICS MARKET, BY DRUG CLASS (2024)
FIGURE 12 NORTH AMERICA BRANDED GENERICS MARKET: SEGMENTATION
FIGURE 13 PATENT EXPIRATIONS OF BLOCKBUSTER DRUGS ARE EXPECTED TO DRIVE THE NORTH AMERICA BRANDED GENERICS MARKET IN THE FORECAST PERIOD OF 2025 TO 2032
FIGURE 14 ANTI-HYPERTENSIVE SEGMENT IS EXPECTED TO ACCOUNT FOR THE LARGEST SHARE OF THE NORTH AMERICA BRANDED GENERICS MARKET IN 2025 & 2032
FIGURE 15 DRIVERS, RESTRAINTS, OPPORTUNITIES AND CHALLENGES OF THE NORTH AMERICA BRANDED GENERICS MARKET
FIGURE 16 NORTH AMERICA BRANDED GENERIC MARKET: BY DRUG CLASS, 2024
FIGURE 17 NORTH AMERICA BRANDED GENERIC MARKET: BY DRUG CLASS, 2025 TO 2032 (USD THOUSAND)
FIGURE 18 NORTH AMERICA BRANDED GENERIC MARKET: BY DRUG CLASS, CAGR (2025- 2032)
FIGURE 19 NORTH AMERICA BRANDED GENERIC MARKET: BY DRUG CLASS, LIFELINE CURVE
FIGURE 20 NORTH AMERICA BRANDED GENERICS MARKET: BY APPLICATION, 2024
FIGURE 21 NORTH AMERICA BRANDED GENERICS MARKET: BY APPLICATION, 2025 TO 2032 (USD THOUSAND)
FIGURE 22 NORTH AMERICA BRANDED GENERICS MARKET: BY APPLICATION, CAGR (2025- 2032)
FIGURE 23 NORTH AMERICA BRANDED GENERICS MARKET: BY APPLICATION, LIFELINE CURVE
FIGURE 24 NORTH AMERICA BRANDED GENERIC MARKET: BY ROUTE OF ADMINISTRATION, 2024
FIGURE 25 NORTH AMERICA BRANDED GENERIC MARKET: BY ROUTE OF ADMINISTRATION, 2025 TO 2032 (USD THOUSAND)
FIGURE 26 NORTH AMERICA BRANDED GENERIC MARKET: BY ROUTE OF ADMINISTRATION, CAGR (2025- 2032)
FIGURE 27 NORTH AMERICA BRANDED GENERIC MARKET: BY ROUTE OF ADMINISTRATION, LIFELINE CURVE
FIGURE 28 NORTH AMERICA BRANDED GENERICS MARKET: BY PRODUCT TYPE, 2024
FIGURE 29 NORTH AMERICA BRANDED GENERICS MARKET: BY PRODUCT TYPE, 2025 TO 2032 (USD THOUSAND)
FIGURE 30 NORTH AMERICA BRANDED GENERICS MARKET: BY PRODUCT TYPE, CAGR (2025- 2032)
FIGURE 31 NORTH AMERICA BRANDED GENERICS MARKET: BY PRODUCT TYPE, LIFELINE CURVE
FIGURE 32 NORTH AMERICA BRANDED GENERICS MARKET: BY PATIENT DEMOGRAPHICS, 2024
FIGURE 33 NORTH AMERICA BRANDED GENERICS MARKET: BY PATIENT DEMOGRAPHICS, 2025 TO 2032 (USD THOUSAND)
FIGURE 34 NORTH AMERICA BRANDED GENERICS MARKET: BY PATIENT DEMOGRAPHICS, CAGR (2025- 2032)
FIGURE 35 NORTH AMERICA BRANDED GENERICS MARKET: BY PATIENT DEMOGRAPHICS, LIFELINE CURVE
FIGURE 36 NORTH AMERICA BRANDED GENERICS MARKET: BY END USER, 2024
FIGURE 37 NORTH AMERICA BRANDED GENERICS MARKET: BY END USER, 2025 TO 2032 (USD THOUSAND)
FIGURE 38 NORTH AMERICA BRANDED GENERICS MARKET: BY END USER, CAGR (2025- 2032)
FIGURE 39 NORTH AMERICA BRANDED GENERICS MARKET: BY END USER, LIFELINE CURVE
FIGURE 40 NORTH AMERICA BRANDED GENERICS MARKET: BY DISTRIBUTION CHANNEL, 2024
FIGURE 41 NORTH AMERICA BRANDED GENERICS MARKET: BY DISTRIBUTION CHANNEL, 2025 TO 2032 (USD THOUSAND)
FIGURE 42 NORTH AMERICA BRANDED GENERICS MARKET: BY DISTRIBUTION CHANNEL, CAGR (2025- 2032)
FIGURE 43 NORTH AMERICA BRANDED GENERICS MARKET: BY DISTRIBUTION CHANNEL, LIFELINE CURVE
FIGURE 44 NORTH AMERICA BRANDED GENERICS MARKET: SNAPSHOT (2024)
FIGURE 45 NORTH AMERICA BRANDED GENERICS MARKET: COMPANY SHARE 2024 (%)
Data collection and base year analysis are done using data collection modules with large sample sizes. The stage includes obtaining market information or related data through various sources and strategies. It includes examining and planning all the data acquired from the past in advance. It likewise envelops the examination of information inconsistencies seen across different information sources. The market data is analysed and estimated using market statistical and coherent models. Also, market share analysis and key trend analysis are the major success factors in the market report. To know more, please request an analyst call or drop down your inquiry.
The key research methodology used by DBMR research team is data triangulation which involves data mining, analysis of the impact of data variables on the market and primary (industry expert) validation. Data models include Vendor Positioning Grid, Market Time Line Analysis, Market Overview and Guide, Company Positioning Grid, Patent Analysis, Pricing Analysis, Company Market Share Analysis, Standards of Measurement, Global versus Regional and Vendor Share Analysis. To know more about the research methodology, drop in an inquiry to speak to our industry experts.
Data Bridge Market Research is a leader in advanced formative research. We take pride in servicing our existing and new customers with data and analysis that match and suits their goal. The report can be customized to include price trend analysis of target brands understanding the market for additional countries (ask for the list of countries), clinical trial results data, literature review, refurbished market and product base analysis. Market analysis of target competitors can be analyzed from technology-based analysis to market portfolio strategies. We can add as many competitors that you require data about in the format and data style you are looking for. Our team of analysts can also provide you data in crude raw excel files pivot tables (Fact book) or can assist you in creating presentations from the data sets available in the report.


