
 Market Analysis and Insights: North America Busbar Market
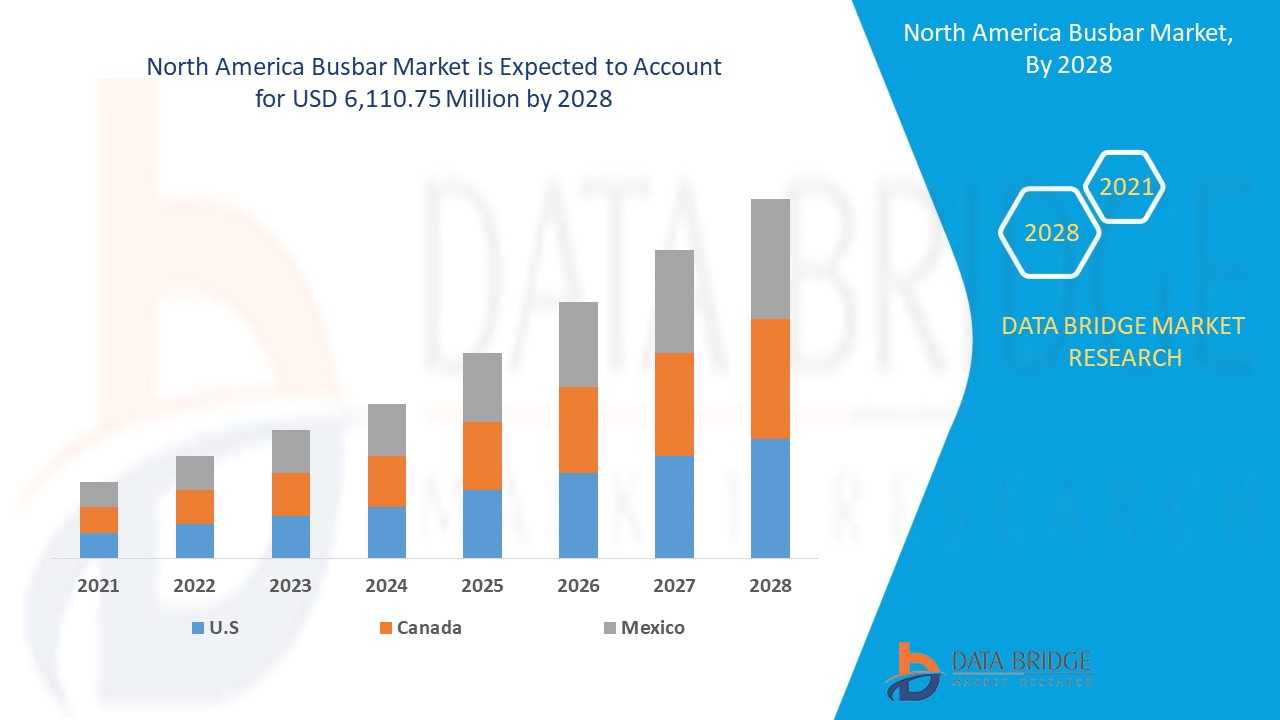
The busbar market is expected to gain market growth in the forecast period of 2021 to 2028. Data Bridge Market Research analyses that the market is growing with a CAGR of 5.9% in the forecast period of 2021 to 2028 and is expected to reach USD 6,110.75 million by 2028. Requirement of efficient conductivity and energy losses during transmission is boosting the market.
A busbar is a strip or bar of copper, brass, or aluminum that conducts electricity within a switchboard, distribution board, substation, battery bank, or other electrical apparatus in power distribution. Its primary function is to conduct electricity, not to serve as a structural member. The maximum amount of current that can be safely casted is determined by the cross-sectional size of the busbar. Busbars can have a cross-sectional area as small as 10 mm2, but electrical substations may use metal tubes with a diameter of 50 mm or more significant as busbars. Large busbars will be used in an aluminum smelter to carry tens of thousands of amperes to the electrochemical cells that produce aluminum from molten salts.
The growing focus on energy efficiency with preference for busbars over cables is the major driving factor in the market. The geopolitical trade conflict from china leading declining the sales can prove to be a challenge however many the advantages of smart city development and growth in switchgear and energy & power market prove to be an opportunity. The fluctuation in raw material prices, especially copper, can be a restraint for the adoption of busbar and the challenges faced due to the impact of Covid-19 on the supply chain of the raw materials.
The busbar market report provides details of market share, new developments, and product pipeline analysis, impact of domestic and localized market players, analyses opportunities in terms of emerging revenue pockets, changes in market regulations, product approvals, strategic decisions, product launches, geographic expansions, and technological innovations in the market. To understand the analysis and the busbar market scenario, contact Data Bridge Market Research for an Analyst Brief, our team will help you create a revenue impact solution to achieve your desired goal.
 Busbar Market Scope and Market Size
The busbar market is segmented on the basis of the conductor, weight wise, shape wise, insulation, length, busbar type, power rating, and end user. The growth among segments helps you analyze niche pockets of growth and strategies to approach the market and determine your core application areas and the difference in your target markets.
- On the basis of conductor, the busbar market is segmented into copper wire and aluminium wire. In 2021, copper is expected to dominate the segment owing to its property of strong ductility, tensile-strength, thermal-conductivity, and thermal-expansion. The copper performance in electrical ratings has a higher performance due to lower power losses, voltage drop, and higher ampacity.
- On the basis of weight wise, the busbar market is segmented into less than 1 kg and more than 1 kg. In 2021, more than 1 kg dominates the segment owing to wide usages of more than 1 kg in industrial usage for automotive and other verticals that overall enhances the demand for the busbar.
- On the basis of shape wise, the busbar market is segmented into rectangle and chamfer. In 2021, the rectangle busbar is widely used in power system connection that enhances the overall demand due to growing scenario for smart grid.
- On the basis of busbar type, the busbar market is segmented into single conductor busbars, multiple conductor busbars, flexible busbars, and laminate busbars. In 2021, laminate busbars dominate the segment as they are designed specifically for the low and high power applications increasing the capacitance and eliminating the wiring errors help to boost the overall growth.
- On the basis of power rating, the busbar market is segmented into low power, medium power (125 A-800 A) and high power (above 800 A). In 2021, low power segment dominates the segment due to wide adoption for protection in large equipment sector.
- On the basis of end user, the busbar market is segmented into passenger car, light commercial vehicle, heavy commercial vehicle and electric vehicle. The end user segment is further sub segmented on the basis of by type into aluminium and copper. In 2021, passenger car augments the market with largest market share due to the increase in number of passenger vehicles North Americaly as compared to other vehicle type.
Busbar Market Country Level Analysis
The Busbar market is analyzed and market size information is provided by the country, conductor, weight wise, shape wise, insulation ,length, busbar type, power rating and end user as referenced above.
The countries covered in the Busbar market report are the U.S., Canada, Mexico, Germany, France, U.K., Italy, Spain, Switzerland, Netherlands, Russia, Turkey, Belgium, Rest of Europe, Japan, China, South Korea, India, Australia, Singapore, Thailand, Malaysia, Indonesia, Philippines, Rest of Asia-Pacific, South Africa, Rest Of Middle East And Africa, Brazil, Argentina, And Rest Of South America.
U.S. dominates the North America region due to the increasing focus on energy efficiency with preference for busbars over cables.
The country section of the report also provides individual market impacting factors and changes in regulation in the market domestically that impacts the current and future trends of the market. Data points such as new sales, replacement sales, country demographics, regulatory acts and import-export tariffs are some of the major pointers used to forecast the market scenario for individual countries. Also, presence and availability of North America brands and their challenges faced due to large or scarce competition from local and domestic brands, impact of sales channels are considered while providing forecast analysis of the country data.
Rising Smart Cities Development of Busbar is Boosting the Market Growth of Busbar market.
The busbar market also provides you with detailed market analysis for every country growth in particular market. Additionally, it provides the detail information regarding the market players’ strategy and their geographical presence. The data is available for historic period 2010 to 2019.
Competitive Landscape and Busbar Market Share Analysis
Busbar market competitive landscape provides details by competitor. Details included are company overview, company financials, revenue generated, market potential, investment in research and development, new market initiatives, production sites and facilities, company strengths and weaknesses, product launch, product trials pipelines, product approvals, patents, product width and breadth, application dominance, technology lifeline curve. The above data points provided are only related to the company’s focus related to Busbar market.
The major companies which are dealing in the busbar are ABB, Siemens, Schneider Electric, Eaton, GENERAL ELECTRIC, Legrand SA, MERSEN PROPERTY, EMS Industrial & Service Company, Oriental Copper Co., Ltd., Rittal GmbH & Co. KG, CHINT Group., Promet AG., METHODE ELECTRONICS, Sun.King Technology Group Limited, Rogers Corporation., Amphenol Corporation, Watteredge, LLC, Emerson Electric Co., Busbar Systems Belgium other in domestic players. DBMR analysts understand competitive strengths and provide competitive analysis for each competitor separately.
Many contract and agreement are also initiated by the companies’ worldwide, which are also accelerating the Busbar market.
For instance,
- In February 2021, Siemens deployed a bus depot with charging and power distribution technology with the busbar trunking that enhances the charging stations supply in the eBuses. The company enhanced its wide business portfolio generating more income and profit.
- In March 2000, ABB has enhanced its low voltage main distribution board for the ongoing project of the large solar rooftop that holds the capacity of almost 2,900A from the initial capacity of current above 2,500 A. The company enhanced its wide business portfolio offering more reliability and distribution that overall drives the profit for the company.
SKU-

- Interactive Data Analysis Dashboard
- Company Analysis Dashboard for high growth potential opportunities
- Research Analyst Access for customization & queries
- Competitor Analysis with Interactive dashboard
- Latest News, Updates & Trend analysis
- Harness the Power of Benchmark Analysis for Comprehensive Competitor Tracking
Table of Content
1 INTRODUCTION
1.1 OBJECTIVES OF THE STUDY
1.2 MARKET DEFINITION
1.3 OVERVIEW OF NORTH AMERICA BUSBAR MARKET
1.4 CURRENCY AND PRICING
1.5 LIMITATIONS
1.6 MARKETS COVERED
2 MARKET SEGMENTATION
2.1 MARKETS COVERED
2.2 GEOGRAPHICAL SCOPE
2.3 YEARS CONSIDERED FOR THE STUDY
2.4 DBMR TRIPOD DATA VALIDATION MODEL
2.5 PRIMARY INTERVIEWS WITH KEY OPINION LEADERS
2.6 DBMR MARKET POSITION GRID
2.7 VENDOR SHARE ANALYSIS
2.8 MARKET END USER COVERED GRID
2.9 MULTIVARIATE MODELING
2.1 CONDUCTOR TIMELINE CURVE
2.11 SECONDARY SOURCES
2.12 ASSUMPTIONS
3 EXECUTIVE SUMMARY
4 PREMIUM INSIGHTS
4.1 TREND
4.1.1 GROWING ENERGY CONSUMPTION DUE TO INDUSTRIALIZATION & URBANIZATION
4.1.2 INCREASING FOCUS ON ENERGY EFFICIENCY
4.1.3 COST & OPERATIONAL BENEFITS OF BUSBAR
4.2 STANDARD
4.2.1 IEC 60439-2
4.2.2 BSEN 60439-2 STANDARD
5 MARKET OVERVIEW
5.1 DRIVER
5.1.1 REQUIREMENT OF EFFICIENT CONDUCTIVITY AND ENERGY LOSSES DURING TRANSMISSION.
5.1.2 COST & OPERATIONAL ADVANTAGES OF BUSBARS
5.1.3 INCREASING FOCUS ON ENERGY EFFICIENCY WITH PREFERENCE FOR BUSBARS OVER CABLES
5.1.4 RISING ADOPTION OF SMART GRID TECHNOLOGY
5.1.5 RISING DEMAND FOR ELECTRICITY ACROSS RESIDENTIAL, COMMERCIAL, AND INDUSTRIAL SECTOR
5.2 RESTRAINTS
5.2.1 AVAILABILITY OF CHEAP AND LOW QUALITY PRODUCTS
5.2.2 FLUCTUATION IN RAW MATERIAL PRICES, ESPECIALLY COPPER
5.3 OPPORTUNITY
5.3.1 SMART CITIES DEVELOPMENT
5.3.2 GROWTH IN SWITCHGEAR AND ENERGY & POWER MARKET
5.3.3 GROWING ADOPTION OF BUSBARS IN ELECTRIC VEHICLES
5.4 CHALLENGES
5.4.1 HIGH COST INVOLVED IN THE SETUP
5.4.2 GEOPOLITICAL TRADE CONFLICT FROM CHINA DECLINING THE SALES
6 IMPACT OF COVID-19 ON THE NORTH AMERICA BUSBAR MARKET
6.1 ANALYSIS ON IMPACT OF COVID-19 ON THE NORTH AMERICA BUSBAR MARKET
6.2 IMPACT ON PRICE
6.3 IMPACT ON DEMAND AND SUPPLY CHAIN
6.4 AFTERMATH OF COVID-19 AND INITIATIVES BY MANUFACTURERS TO BOOST THE MARKET
6.5 CONCLUSION
7 NORTH AMERICA BUSBAR MARKET, BY CONDUCTOR
7.1 OVERVIEW
7.2 COPPER
7.2.1 TRANSFORMERS
7.2.2 RECTIFIERS
7.2.3 GENERATORS
7.2.4 OTHERS
7.3 ALUMINIUM
8 NORTH AMERICA BUSBAR MARKET, BY WEIGHT WISE
8.1 OVERVIEW
8.2 MORE THAN 1 KG
8.3 LESS THAN 1 KG
9 NORTH AMERICA BUSBAR MARKET, BY SHAPE WISE
9.1 OVERVIEW
9.2 RECTANGLE
9.3 CHAMFER
10 NORTH AMERICA BUSBAR MARKET, BY INSULATION
10.1 OVERVIEW
10.2 EPOXY POWER COATING
10.3 MYLAR
10.4 NOMEX
10.5 KAPTON
10.6 TEONIX
10.7 TEDLER
10.8 OTHERS
11 NORTH AMERICA BUSBAR MARKET, BY LENGTH
11.1 OVERVIEW
11.2 1M TO 2M
11.3 2MT TO 3MT
11.4 MORE THAN 3MT
11.5 LESS THAN 1M
12 NORTH AMERICA BUSBAR MARKET, BY BUSBAR TYPE
12.1 OVERVIEW
12.2 LAMINATE BUSBARS
12.3 MULTIPLE CONDUCTOR BUSBARS
12.4 FLEXIBLE BUSBARS
12.5 SINGLE CONDUCTOR BUSBARS
13 NORTH AMERICA BUSBAR MARKET, BY POWER RATING
13.1 OVERVIEW
13.2 LOW POWER
13.2.1 TO 60 AMP
13.2.2 AMP TO 100 AMP
13.2.3 AMP TO 125 AMP
13.2.4 LESS THAN 40 AMP
13.3 MEDIUM POWER (125 A-800 A)
13.3.1 AMP TO 200 AMP
13.3.2 AMP TO 400 AMP
13.3.3 AMP TO 800 AMP
13.4 HIGH POWER (ABOVE 800 A)
13.4.1 AMP TO 1,000 AMP
13.4.2 1,000 AMP TO 1200 AMP
14 NORTH AMERICA BUSBAR MARKET, BY END USER
14.1 OVERVIEW
14.2 INDUSTRIAL
14.2.1 UTILITIES
14.2.1.1 Copper
14.2.1.2 Aluminium
14.2.2 MANUFACTURING
14.2.2.1 Copper
14.2.2.2 Aluminium
14.2.3 TELECOM
14.2.3.1 Copper
14.2.3.2 Aluminium
14.2.4 AEROSPACE AND DEFENSE
14.2.4.1 Copper
14.2.4.2 Aluminium
14.2.5 CHEMICALS & PETROLEUM
14.2.5.1 Copper
14.2.5.2 Aluminium
14.2.6 METALS AND MINING
14.2.6.1 Copper
14.2.6.2 Aluminium
14.2.7 OTHERS
14.2.7.1 Copper
14.2.7.2 Aluminium
14.3 RESIDENTIAL
14.4 COMMERCIAL
14.4.1 OFFICES
14.4.1.1 Copper
14.4.1.2 Aluminium
14.4.2 HOSPITALS
14.4.2.1 Copper
14.4.2.2 Aluminium
14.4.3 MALLS AND SUPERMARKETS
14.4.3.1 Copper
14.4.3.2 Aluminium
14.4.4 DATA CENTRE
14.4.4.1 Copper
14.4.4.2 Aluminium
14.4.5 WAREHOUSES
14.4.5.1 Copper
14.4.5.2 Aluminium
14.4.6 OTHERS
14.4.6.1 Copper
14.4.6.2 Aluminium
15 NORTH AMERICA BUSBAR MARKET, BY REGION
15.1 NORTH AMERICA
15.1.1 U.S.
15.1.2 CANADA
15.1.3 MEXICO
16 NORTH AMERICA BUSBAR MARKET COMPANY LANDSCAPE
16.1 COMPANY SHARE ANALYSIS: NORTH AMERICA
17 SWOT ANALYSIS
18 COMPANY PROFILE
18.1 ABB
18.1.1 COMPANY SNAPSHOT
18.1.2 REVENUE ANALYSIS
18.1.3 COMPANY SHARE ANALYSIS
18.1.4 PRODUCT PORTFOLIO
18.1.5 RECENT DEVELOPMENTS
18.2 GENERAL ELECTRIC
18.2.1 COMPANY SNAPSHOT
18.2.2 REVENUE ANALYSIS
18.2.3 COMPANY SHARE ANALYSIS
18.2.4 PRODUCT PORTFOLIO
18.2.5 RECENT DEVELOPMENT
18.3 SCHNEIDER ELECTRIC
18.3.1 COMPANY SNAPSHOT
18.3.2 REVENUE ANALYSIS
18.3.3 COMPANY SHARE ANALYSIS
18.3.4 PRODUCT PORTFOLIO
18.3.5 RECENT DEVELOPMENTS
18.4 LEGRAND SA
18.4.1 COMPANY SNAPSHOT
18.4.2 REVENUE ANALYSIS
18.4.3 COMPANY SHARE ANALYSIS
18.4.4 PRODUCT PORTFOLIO
18.4.5 RECENT DEVELOPMENTS
18.5 SIEMENS
18.5.1 COMPANY SNAPSHOT
18.5.2 REVENUE ANALYSIS
18.5.3 COMPANY SHARE ANALYSIS
18.5.4 PRODUCT PORTFOLIO
18.5.5 RECENT DEVELOPMENTS
18.6 EATON
18.6.1 COMPANY SNAPSHOT
18.6.2 REVENUE ANALYSIS
18.6.3 PRODUCT PORTFOLIO
18.6.4 RECENT DEVELOPMENTS
18.7 AMPHENOL CORPORATION
18.7.1 COMPANY SNAPSHOT
18.7.2 REVENUE ANALYSIS
18.7.3 PRODUCT PORTFOLIO
18.7.4 RECENT DEVELOPMENT
18.8 BUSBAR SYSTEMS BELGIUM
18.8.1 COMPANY SNAPSHOT
18.8.2 PRODUCT PORTFOLIO
18.8.3 RECENT DEVELOPMENT
18.9 CHINT GROUP
18.9.1 COMPANY SNAPSHOT
18.9.2 PRODUCT PORTFOLIO
18.9.3 RECENT DEVELOPMENT
18.1 EMERSON ELECTRIC CO.
18.10.1 COMPANY SNAPSHOT
18.10.2 REVENUE ANALYSIS
18.10.3 PRODUCT PORTFOLIO
18.10.4 RECENT DEVELOPMENT
18.11 EMS INDUSTRIAL & SERVICE COMPANY
18.11.1 COMPANY SNAPSHOT
18.11.2 PRODUCT PORTFOLIO
18.11.3 RECENT DEVELOPMENT
18.12 MERSEN PROPERTY
18.12.1 COMPANY SNAPSHOT
18.12.2 REVENUE ANALYSIS
18.12.3 PRODUCT PORTFOLIO
18.12.4 RECENT DEVELOPMENTS
18.13 METHODE ELECTRONICS
18.13.1 COMPANY SNAPSHOT
18.13.2 REVENUE ANALYSIS
18.13.3 PRODUCT PORTFOLIO
18.13.4 RECENT DEVELOPMENT
18.14 ORIENTAL COPPER CO.,LTD.
18.14.1 COMPANY SNAPSHOT
18.14.2 PRODUCT PORTFOLIO
18.14.3 RECENT DEVELOPMENT
18.15 PROMET AG
18.15.1 COMPANY SNAPSHOT
18.15.2 PRODUCT PORTFOLIO
18.15.3 RECENT DEVELOPMENT
18.16 RITTAL GMBH & CO. KG
18.16.1 COMPANY SNAPSHOT
18.16.2 PRODUCT PORTFOLIO
18.16.3 RECENT DEVELOPMENT
18.17 ROGERS CORPORATION
18.17.1 COMPANY SNAPSHOT
18.17.2 REVENUE ANALYSIS
18.17.3 PRODUCT PORTFOLIO
18.17.4 RECENT DEVELOPMENT
18.18 SUN.KING TECHNOLOGY GROUP LIMITED
18.18.1 COMPANY SNAPSHOT
18.18.2 REVENUE ANALYSIS
18.18.3 PRODUCT PORTFOLIO
18.18.4 RECENT DEVELOPMENT
18.19 WATTEREDGE, LLC
18.19.1 COMPANY SNAPSHOT
18.19.2 PRODUCT PORTFOLIO
18.19.3 RECENT DEVELOPMENT
19 QUESTIONNAIRE
20 RELATED REPORTS
List of Table
TABLE 1 NORTH AMERICA BUSBAR MARKET, BY CONDUCTOR, 2019-2028 (USD MILLION)
TABLE 2 NORTH AMERICA COPPER IN BUSBAR MARKET, BY REGION, 2019-2028 (USD MILLION)
TABLE 3 NORTH AMERICA COPPER IN BUSBAR MARKET, BY APPLICATION, 2019-2028 (USD MILLION)
TABLE 4 NORTH AMERICA ALUMINIUM IN BUSBAR MARKET, BY REGION, 2019-2028 (USD MILLION)
TABLE 5 NORTH AMERICA BUSBAR MARKET, BY WEIGHT WISE, 2019-2028 (USD MILLION)
TABLE 6 NORTH AMERICA MORE THAN 1 KG IN BUSBAR MARKET, BY REGION, 2019-2028 (USD MILLION)
TABLE 7 NORTH AMERICA LESS THAN 1 KG IN BUSBAR MARKET, BY REGION, 2019-2028 (USD MILLION)
TABLE 8 NORTH AMERICA BUSBAR MARKET, BY SHAPE WISE, 2019-2028 (USD MILLION)
TABLE 9 NORTH AMERICA RECTANGLE IN BUSBAR MARKET, BY REGION, 2019-2028 (USD MILLION)
TABLE 10 NORTH AMERICA CHAMFER IN BUSBAR MARKET, BY REGION, 2019-2028 (USD MILLION)
TABLE 11 NORTH AMERICA BUSBAR MARKET, BY INSULATION, 2019-2028 (USD MILLION)
TABLE 12 NORTH AMERICA EPOXY POWER COATING IN BUSBAR MARKET, BY REGION, 2019-2028 (USD MILLION)
TABLE 13 NORTH AMERICA MYLAR IN BUSBAR MARKET, BY REGION, 2019-2028 (USD MILLION)
TABLE 14 NORTH AMERICA NOMEX IN BUSBAR MARKET, BY REGION, 2019-2028 (USD MILLION)
TABLE 15 NORTH AMERICA KAPTON IN BUSBAR MARKET, BY REGION, 2019-2028 (USD MILLION)
TABLE 16 NORTH AMERICA TEONIX IN BUSBAR MARKET, BY REGION, 2019-2028 (USD MILLION)
TABLE 17 NORTH AMERICA TEDLER IN BUSBAR MARKET, BY REGION, 2019-2028 (USD MILLION)
TABLE 18 NORTH AMERICA OTHERS IN BUSBAR MARKET, BY REGION, 2019-2028 (USD MILLION)
TABLE 19 NORTH AMERICA BUSBAR MARKET, BY LENGTH, 2019-2028 (USD MILLION)
TABLE 20 NORTH AMERICA 1M TO 2M IN BUSBAR MARKET, BY REGION, 2019-2028 (USD MILLION)
TABLE 21 NORTH AMERICA 2MT TO 3 MT IN BUSBAR MARKET, BY REGION, 2019-2028 (USD MILLION)
TABLE 22 NORTH AMERICA MORE THAN 3 MT IN BUSBAR MARKET, BY REGION, 2019-2028 (USD MILLION)
TABLE 23 NORTH AMERICA LESS THAN 1M IN BUSBAR MARKET, BY REGION, 2019-2028 (USD MILLION)
TABLE 24 NORTH AMERICA BUSBAR MARKET, BY BUSBAR TYPE, 2019-2028 (USD MILLION)
TABLE 25 NORTH AMERICA LAMINATED BUSBARS IN BUSBAR MARKET, BY REGION, 2019-2028 (USD MILLION)
TABLE 26 NORTH AMERICA MULTIPLE CONDUCTOR BUSBARS IN BUSBAR MARKET, BY REGION, 2019-2028 (USD MILLION)
TABLE 27 NORTH AMERICA FLEXIBLE BUSBARS IN BUSBAR MARKET, BY REGION, 2019-2028 (USD MILLION)
TABLE 28 NORTH AMERICA SINGLE CONDUCTOR BUSBARS IN BUSBAR MARKET, BY REGION, 2019-2028 (USD MILLION)
TABLE 29 NORTH AMERICA BUSBAR MARKET, BY POWER RATING, 2019-2028 (USD MILLION)
TABLE 30 NORTH AMERICA LOW POWER IN BUSBAR MARKET, BY REGION, 2019-2028 (USD MILLION)
TABLE 31 NORTH AMERICA LOW POWER IN BUSBAR MARKET, BY TYPE, 2019-2028 (USD MILLION)
TABLE 32 NORTH AMERICA MEDIUM POWER (125 A-800 A) IN BUSBAR MARKET, BY REGION, 2019-2028 (USD MILLION)
TABLE 33 NORTH AMERICA MEDIUM POWER (125 A-800 A) IN BUSBAR MARKET, BY TYPE, 2019-2028 (USD MILLION)
TABLE 34 NORTH AMERICA HIGH POWER (ABOVE 800 A) IN BUSBAR MARKET, BY REGION, 2019-2028 (USD MILLION)
TABLE 35 NORTH AMERICA HIGH POWER (ABOVE 800 A) IN BUSBAR MARKET, BY TYPE, 2019-2028 (USD MILLION)
TABLE 36 NORTH AMERICA BUSBAR MARKET, BY END USER, 2019-2028 (USD MILLION)
TABLE 37 NORTH AMERICA INDUSTRIAL IN BUSBAR MARKET, BY REGION, 2019-2028 (USD MILLION)
TABLE 38 NORTH AMERICA INDUSTRIAL IN BUSBAR MARKET, BY END USER, 2019-2028 (USD MILLION)
TABLE 39 NORTH AMERICA UTILITES IN BUSBAR MARKET, BY CONDUCTOR, 2019-2028 (USD MILLION)
TABLE 40 NORTH AMERICA MANUFACTURING IN BUSBAR MARKET, BY CONDUCTOR, 2019-2028 (USD MILLION)
TABLE 41 NORTH AMERICA TELECOM IN BUSBAR MARKET, BY CONDUCTOR, 2019-2028 (USD MILLION)
TABLE 42 NORTH AMERICA AEROSPACE AND DEFENSE IN BUSBAR MARKET, BY CONDUCTOR, 2019-2028 (USD MILLION)
TABLE 43 NORTH AMERICA CHEMICALS & PETROLEUM IN BUSBAR MARKET, BY CONDUCTOR, 2019-2028 (USD MILLION)
TABLE 44 NORTH AMERICA METAL AND MINING IN BUSBAR MARKET, BY CONDUCTOR, 2019-2028 (USD MILLION)
TABLE 45 NORTH AMERICA OTHERS IN BUSBAR MARKET, BY CONDUCTOR, 2019-2028 (USD MILLION)
TABLE 46 NORTH AMERICA RESIDENTIAL IN BUSBAR MARKET, BY REGION, 2019-2028 (USD MILLION)
TABLE 47 NORTH AMERICA COMMERCIAL IN BUSBAR MARKET, BY REGION, 2019-2028 (USD MILLION)
TABLE 48 NORTH AMERICA COMMERCIAL IN BUSBAR MARKET, BY END USER, 2019-2028 (USD MILLION)
TABLE 49 NORTH AMERICA OFFICES IN BUSBAR MARKET, BY CONDUCTOR, 2019-2028 (USD MILLION)
TABLE 50 NORTH AMERICA HOSPITALS IN BUSBAR MARKET, BY CONDUCTOR, 2019-2028 (USD MILLION)
TABLE 51 NORTH AMERICA MALLS AND SUPERMARKETS IN BUSBAR MARKET, BY CONDUCTOR, 2019-2028 (USD MILLION)
TABLE 52 NORTH AMERICA DATA CENTRE IN BUSBAR MARKET, BY CONDUCTOR, 2019-2028 (USD MILLION)
TABLE 53 NORTH AMERICA WAREHOUSES IN BUSBAR MARKET, BY CONDUCTOR, 2019-2028 (USD MILLION)
TABLE 54 NORTH AMERICA OTHERS IN BUSBAR MARKET, BY CONDUCTOR, 2019-2028 (USD MILLION)
TABLE 55 NORTH AMERICA BUSBAR MARKET, BY COUNTRY, 2019-2028 (USD MILLION)
TABLE 56 NORTH AMERICA BUSBAR MARKET, BY CONDUCTOR, 2019-2028 (USD MILLION)
TABLE 57 NORTH AMERICA COPPER IN BUSBAR MARKET, BY APPLICATION, 2019-2028 (USD MILLION)
TABLE 58 NORTH AMERICA BUSBAR MARKET, BY WEIGHT WISE, 2019-2028 (USD MILLION)
TABLE 59 NORTH AMERICA BUSBAR MARKET, BY SHAPE WISE, 2019-2028 (USD MILLION)
TABLE 60 NORTH AMERICA BUSBAR MARKET, BY INSULATION, 2019-2028 (USD MILLION)
TABLE 61 NORTH AMERICA BUSBAR MARKET, BY LENGTH, 2019-2028 (USD MILLION)
TABLE 62 NORTH AMERICA BUSBAR MARKET, BY BUSBAR TYPE, 2019-2028 (USD MILLION)
TABLE 63 NORTH AMERICA BUSBAR MARKET, BY POWER RATING, 2019-2028 (USD MILLION)
TABLE 64 NORTH AMERICA LOW POWER IN BUSBAR MARKET, BY TYPE, 2019-2028 (USD MILLION)
TABLE 65 NORTH AMERICA MEDIUM POWER (125A-800A) IN BUSBAR MARKET, BY TYPE, 2019-2028 (USD MILLION)
TABLE 66 NORTH AMERICA HIGH POWER (ABOVE 800A) IN BUSBAR MARKET, BY TYPE, 2019-2028 (USD MILLION)
TABLE 67 NORTH AMERICA BUSBAR MARKET, BY END USER, 2019-2028 (USD MILLION)
TABLE 68 NORTH AMERICA INDUSTRIAL IN BUSBAR MARKET, BY TYPE, 2019-2028 (USD MILLION)
TABLE 69 NORTH AMERICA UTILITIES IN BUSBAR MARKET, BY CONDUCTOR, 2019-2028 (USD MILLION)
TABLE 70 NORTH AMERICA MANUFACTURING IN BUSBAR MARKET, BY CONDUCTOR, 2019-2028 (USD MILLION)
TABLE 71 NORTH AMERICA TELECOM IN BUSBAR MARKET, BY CONDUCTOR, 2019-2028 (USD MILLION)
TABLE 72 NORTH AMERICA AEROSPACE AND DEFENSE IN BUSBAR MARKET, BY CONDUCTOR, 2019-2028 (USD MILLION)
TABLE 73 NORTH AMERICA CHEMICALS & PETROLEUM IN BUSBAR MARKET, BY CONDUCTOR, 2019-2028 (USD MILLION)
TABLE 74 NORTH AMERICA METAL AND MINING IN BUSBAR MARKET, BY CONDUCTOR, 2019-2028 (USD MILLION)
TABLE 75 NORTH AMERICA OTHERS IN BUSBAR MARKET, BY CONDUCTOR, 2019-2028 (USD MILLION)
TABLE 76 NORTH AMERICA COMMERCIAL IN BUSBAR MARKET, BY TYPE, 2019-2028 (USD MILLION)
TABLE 77 NORTH AMERICA OFFICES IN BUSBAR MARKET, BY CONDUCTOR, 2019-2028 (USD MILLION)
TABLE 78 NORTH AMERICA HOSPITAL IN BUSBAR MARKET, BY CONDUCTOR, 2019-2028 (USD MILLION)
TABLE 79 NORTH AMERICA MALLS AND SUPERMARKETS IN BUSBAR MARKET, BY CONDUCTOR, 2019-2028 (USD MILLION)
TABLE 80 NORTH AMERICA DATA CENTRE IN BUSBAR MARKET, BY CONDUCTOR, 2019-2028 (USD MILLION)
TABLE 81 NORTH AMERICA WAREHOUSE IN BUSBAR MARKET, BY CONDUCTOR, 2019-2028 (USD MILLION)
TABLE 82 NORTH AMERICA OTHERS IN BUSBAR MARKET, BY CONDUCTOR, 2019-2028 (USD MILLION)
TABLE 83 U.S. BUSBAR MARKET, BY CONDUCTOR, 2019-2028 (USD MILLION)
TABLE 84 U.S. COPPER IN BUSBAR MARKET, BY APPLICATION, 2019-2028 (USD MILLION)
TABLE 85 U.S. BUSBAR MARKET, BY WEIGHT WISE, 2019-2028 (USD MILLION)
TABLE 86 U.S. BUSBAR MARKET, BY SHAPE WISE, 2019-2028 (USD MILLION)
TABLE 87 U.S. BUSBAR MARKET, BY INSULATION, 2019-2028 (USD MILLION)
TABLE 88 U.S. BUSBAR MARKET, BY LENGTH, 2019-2028 (USD MILLION)
TABLE 89 U.S. BUSBAR MARKET, BY BUSBAR TYPE, 2019-2028 (USD MILLION)
TABLE 90 U.S. BUSBAR MARKET, BY POWER RATING, 2019-2028 (USD MILLION)
TABLE 91 U.S. LOW POWER IN BUSBAR MARKET, BY TYPE, 2019-2028 (USD MILLION)
TABLE 92 U.S. MEDIUM POWER (125A-800A) IN BUSBAR MARKET, BY TYPE, 2019-2028 (USD MILLION)
TABLE 93 U.S. HIGH POWER (ABOVE 800A) IN BUSBAR MARKET, BY TYPE, 2019-2028 (USD MILLION)
TABLE 94 U.S. BUSBAR MARKET, BY END USER, 2019-2028 (USD MILLION)
TABLE 95 U.S. INDUSTRIAL IN BUSBAR MARKET, BY TYPE, 2019-2028 (USD MILLION)
TABLE 96 U.S. UTILITIES IN BUSBAR MARKET, BY CONDUCTOR, 2019-2028 (USD MILLION)
TABLE 97 U.S. MANUFACTURING IN BUSBAR MARKET, BY CONDUCTOR, 2019-2028 (USD MILLION)
TABLE 98 U.S. TELECOM IN BUSBAR MARKET, BY CONDUCTOR, 2019-2028 (USD MILLION)
TABLE 99 U.S. AEROSPACE AND DEFENSE IN BUSBAR MARKET, BY CONDUCTOR, 2019-2028 (USD MILLION)
TABLE 100 U.S. CHEMICALS & PETROLEUM IN BUSBAR MARKET, BY CONDUCTOR, 2019-2028 (USD MILLION)
TABLE 101 U.S. METAL AND MINING IN BUSBAR MARKET, BY CONDUCTOR, 2019-2028 (USD MILLION)
TABLE 102 U.S. OTHERS IN BUSBAR MARKET, BY CONDUCTOR, 2019-2028 (USD MILLION)
TABLE 103 U.S. COMMERCIAL IN BUSBAR MARKET, BY TYPE, 2019-2028 (USD MILLION)
TABLE 104 U.S. OFFICES IN BUSBAR MARKET, BY CONDUCTOR, 2019-2028 (USD MILLION)
TABLE 105 U.S. HOSPITAL IN BUSBAR MARKET, BY CONDUCTOR, 2019-2028 (USD MILLION)
TABLE 106 U.S. MALLS AND SUPERMARKETS IN BUSBAR MARKET, BY CONDUCTOR, 2019-2028 (USD MILLION)
TABLE 107 U.S. DATA CENTRE IN BUSBAR MARKET, BY CONDUCTOR, 2019-2028 (USD MILLION)
TABLE 108 U.S. WAREHOUSE IN BUSBAR MARKET, BY CONDUCTOR, 2019-2028 (USD MILLION)
TABLE 109 U.S. OTHERS IN BUSBAR MARKET, BY CONDUCTOR, 2019-2028 (USD MILLION)
TABLE 110 CANADA BUSBAR MARKET, BY CONDUCTOR, 2019-2028 (USD MILLION)
TABLE 111 CANADA COPPER IN BUSBAR MARKET, BY APPLICATION, 2019-2028 (USD MILLION)
TABLE 112 CANADA BUSBAR MARKET, BY WEIGHT WISE, 2019-2028 (USD MILLION)
TABLE 113 CANADA BUSBAR MARKET, BY SHAPE WISE, 2019-2028 (USD MILLION)
TABLE 114 CANADA BUSBAR MARKET, BY INSULATION, 2019-2028 (USD MILLION)
TABLE 115 CANADA BUSBAR MARKET, BY LENGTH, 2019-2028 (USD MILLION)
TABLE 116 CANADA BUSBAR MARKET, BY BUSBAR TYPE, 2019-2028 (USD MILLION)
TABLE 117 CANADA BUSBAR MARKET, BY POWER RATING, 2019-2028 (USD MILLION)
TABLE 118 CANADA LOW POWER IN BUSBAR MARKET, BY TYPE, 2019-2028 (USD MILLION)
TABLE 119 CANADA MEDIUM POWER (125A-800A) IN BUSBAR MARKET, BY TYPE, 2019-2028 (USD MILLION)
TABLE 120 CANADA HIGH POWER (ABOVE 800A) IN BUSBAR MARKET, BY TYPE, 2019-2028 (USD MILLION)
TABLE 121 CANADA BUSBAR MARKET, BY END USER, 2019-2028 (USD MILLION)
TABLE 122 CANADA INDUSTRIAL IN BUSBAR MARKET, BY TYPE, 2019-2028 (USD MILLION)
TABLE 123 CANADA UTILITIES IN BUSBAR MARKET, BY CONDUCTOR, 2019-2028 (USD MILLION)
TABLE 124 CANADA MANUFACTURING IN BUSBAR MARKET, BY CONDUCTOR, 2019-2028 (USD MILLION)
TABLE 125 CANADA TELECOM IN BUSBAR MARKET, BY CONDUCTOR, 2019-2028 (USD MILLION)
TABLE 126 CANADA AEROSPACE AND DEFENSE IN BUSBAR MARKET, BY CONDUCTOR, 2019-2028 (USD MILLION)
TABLE 127 CANADA CHEMICALS & PETROLEUM IN BUSBAR MARKET, BY CONDUCTOR, 2019-2028 (USD MILLION)
TABLE 128 CANADA METAL AND MINING IN BUSBAR MARKET, BY CONDUCTOR, 2019-2028 (USD MILLION)
TABLE 129 CANADA OTHERS IN BUSBAR MARKET, BY CONDUCTOR, 2019-2028 (USD MILLION)
TABLE 130 CANADA COMMERCIAL IN BUSBAR MARKET, BY TYPE, 2019-2028 (USD MILLION)
TABLE 131 CANADA OFFICES IN BUSBAR MARKET, BY CONDUCTOR, 2019-2028 (USD MILLION)
TABLE 132 CANADA HOSPITAL IN BUSBAR MARKET, BY CONDUCTOR, 2019-2028 (USD MILLION)
TABLE 133 CANADA MALLS AND SUPERMARKETS IN BUSBAR MARKET, BY CONDUCTOR, 2019-2028 (USD MILLION)
TABLE 134 CANADA DATA CENTRE IN BUSBAR MARKET, BY CONDUCTOR, 2019-2028 (USD MILLION)
TABLE 135 CANADA WAREHOUSE IN BUSBAR MARKET, BY CONDUCTOR, 2019-2028 (USD MILLION)
TABLE 136 CANADA OTHERS IN BUSBAR MARKET, BY CONDUCTOR, 2019-2028 (USD MILLION)
TABLE 137 MEXICO BUSBAR MARKET, BY CONDUCTOR, 2019-2028 (USD MILLION)
TABLE 138 MEXICO COPPER IN BUSBAR MARKET, BY APPLICATION, 2019-2028 (USD MILLION)
TABLE 139 MEXICO BUSBAR MARKET, BY WEIGHT WISE, 2019-2028 (USD MILLION)
TABLE 140 MEXICO BUSBAR MARKET, BY SHAPE WISE, 2019-2028 (USD MILLION)
TABLE 141 MEXICO BUSBAR MARKET, BY INSULATION, 2019-2028 (USD MILLION)
TABLE 142 MEXICO BUSBAR MARKET, BY LENGTH, 2019-2028 (USD MILLION)
TABLE 143 MEXICO BUSBAR MARKET, BY BUSBAR TYPE, 2019-2028 (USD MILLION)
TABLE 144 MEXICO BUSBAR MARKET, BY POWER RATING, 2019-2028 (USD MILLION)
TABLE 145 MEXICO LOW POWER IN BUSBAR MARKET, BY TYPE, 2019-2028 (USD MILLION)
TABLE 146 MEXICO MEDIUM POWER (125A-800A) IN BUSBAR MARKET, BY TYPE, 2019-2028 (USD MILLION)
TABLE 147 MEXICO HIGH POWER (ABOVE 800A) IN BUSBAR MARKET, BY TYPE, 2019-2028 (USD MILLION)
TABLE 148 MEXICO BUSBAR MARKET, BY END USER, 2019-2028 (USD MILLION)
TABLE 149 MEXICO INDUSTRIAL IN BUSBAR MARKET, BY TYPE, 2019-2028 (USD MILLION)
TABLE 150 MEXICO UTILITIES IN BUSBAR MARKET, BY CONDUCTOR, 2019-2028 (USD MILLION)
TABLE 151 MEXICO MANUFACTURING IN BUSBAR MARKET, BY CONDUCTOR, 2019-2028 (USD MILLION)
TABLE 152 MEXICO TELECOM IN BUSBAR MARKET, BY CONDUCTOR, 2019-2028 (USD MILLION)
TABLE 153 MEXICO AEROSPACE AND DEFENSE IN BUSBAR MARKET, BY CONDUCTOR, 2019-2028 (USD MILLION)
TABLE 154 MEXICO CHEMICALS & PETROLEUM IN BUSBAR MARKET, BY CONDUCTOR, 2019-2028 (USD MILLION)
TABLE 155 MEXICO METAL AND MINING IN BUSBAR MARKET, BY CONDUCTOR, 2019-2028 (USD MILLION)
TABLE 156 MEXICO OTHERS IN BUSBAR MARKET, BY CONDUCTOR, 2019-2028 (USD MILLION)
TABLE 157 MEXICO COMMERCIAL IN BUSBAR MARKET, BY TYPE, 2019-2028 (USD MILLION)
TABLE 158 MEXICO OFFICES IN BUSBAR MARKET, BY CONDUCTOR, 2019-2028 (USD MILLION)
TABLE 159 MEXICO HOSPITAL IN BUSBAR MARKET, BY CONDUCTOR, 2019-2028 (USD MILLION)
TABLE 160 MEXICO MALLS AND SUPERMARKETS IN BUSBAR MARKET, BY CONDUCTOR, 2019-2028 (USD MILLION)
TABLE 161 MEXICO DATA CENTRE IN BUSBAR MARKET, BY CONDUCTOR, 2019-2028 (USD MILLION)
TABLE 162 MEXICO WAREHOUSE IN BUSBAR MARKET, BY CONDUCTOR, 2019-2028 (USD MILLION)
TABLE 163 MEXICO OTHERS IN BUSBAR MARKET, BY CONDUCTOR, 2019-2028 (USD MILLION)
List of Figure
FIGURE 1 NORTH AMERICA BUSBAR MARKET: SEGMENTATION
FIGURE 2 NORTH AMERICA BUSBAR MARKET: DATA TRIANGULATION
FIGURE 3 NORTH AMERICA BUSBAR MARKET: DROC ANALYSIS
FIGURE 4 NORTH AMERICA BUSBAR MARKET: NORTH AMERICA VS REGIONAL MARKET ANALYSIS
FIGURE 5 NORTH AMERICA BUSBAR MARKET: COMPANY RESEARCH ANALYSIS
FIGURE 6 NORTH AMERICA BUSBAR MARKET: INTERVIEW DEMOGRAPHICS
FIGURE 7 NORTH AMERICA BUSBAR MARKET: DBMR MARKET POSITION GRID
FIGURE 8 NORTH AMERICA BUSBAR MARKET: VENDOR SHARE ANALYSIS
FIGURE 9 NORTH AMERICA BUSBAR MARKET: MARKET END USER COVERED GRID
FIGURE 10 NORTH AMERICA BUSBAR MARKET: SEGMENTATION
FIGURE 11 THE RISE IN DEMAND FOR ELECTRICITY ACROSS RESIDENTIAL, COMMERCIAL, AND INDUSTRIAL SECTOR IS EXPECTED TO DRIVE THE NORTH AMERICA BUSBAR MARKET IN THE FORECAST PERIOD OF 2021 TO 2028
FIGURE 12 COPPER WIRE SEGMENT IS EXPECTED TO ACCOUNT FOR THE LARGEST SHARE OF THE NORTH AMERICA BUSBAR MARKET IN 2021 & 2028
FIGURE 13 BREAKDOWN OF NUCLEAR POWER PLANT O&M COSTS
FIGURE 14 DRIVERS, RESTRAINTS, OPPORTUNITIES AND CHALLENGES OF NORTH AMERICA BUSBAR MARKET
FIGURE 15 ENERGY INTENSITY IN VARIOUS COUNTRIES
FIGURE 16 TOTAL ENERGY CAPACITY BY FUEL TYPE (MW), 2016
FIGURE 17 ANNUAL SMART GRID INVESTMENT
FIGURE 18 INVESTMENT IN SMART GRID TECHNOLOGY
FIGURE 19 INDUSTRIAL ENERGY CONSUMPTION
FIGURE 20 URBAN MANAGEMENT MODEL FOR DECENTERALIZATION OF POWER ELECTRIC SYSTEM IN SMART CITY
FIGURE 21 COMMODITY DEMAND CHANGE-100%EV
FIGURE 22 NORTH AMERICA BUSBAR MARKET: BY CONDUCTOR, 2020
FIGURE 23 NORTH AMERICA BUSBAR MARKET: BY WEIGHT WISE, 2020
FIGURE 24 NORTH AMERICA BUSBAR MARKET: BY SHAPE WISE, 2020
FIGURE 25 NORTH AMERICA BUSBAR MARKET: BY INSULATION, 2020
FIGURE 26 NORTH AMERICA BUSBAR MARKET: BY LENGTH, 2020
FIGURE 27 NORTH AMERICA BUSBAR MARKET: BY BUSBAR TYPE, 2020
FIGURE 28 NORTH AMERICA BUSBAR MARKET: BY POWER RATING, 2020
FIGURE 29 NORTH AMERICA BUSBAR MARKET: BY END USER, 2020
FIGURE 30 NORTH AMERICA BUSBAR MARKET: SNAPSHOT (2020)
FIGURE 31 NORTH AMERICA BUSBAR MARKET: BY COUNTRY (2020)
FIGURE 32 NORTH AMERICA BUSBAR MARKET: BY COUNTRY (2021 & 2028)
FIGURE 33 NORTH AMERICA BUSBAR MARKET: BY COUNTRY (2020 & 2028)
FIGURE 34 NORTH AMERICA BUSBAR MARKET: BY CONDUCTOR (2021-2028)
FIGURE 35 NORTH AMERICA BUSBAR MARKET: COMPANY SHARE 2020 (%)
North America Busbar Market, Supply Chain Analysis and Ecosystem Framework
To support market growth and help clients navigate the impact of geopolitical shifts, DBMR has integrated in-depth supply chain analysis into its North America Busbar Market research reports. This addition empowers clients to respond effectively to global changes affecting their industries. The supply chain analysis section includes detailed insights such as North America Busbar Market consumption and production by country, price trend analysis, the impact of tariffs and geopolitical developments, and import and export trends by country and HSN code. It also highlights major suppliers with data on production capacity and company profiles, as well as key importers and exporters. In addition to research, DBMR offers specialized supply chain consulting services backed by over a decade of experience, providing solutions like supplier discovery, supplier risk assessment, price trend analysis, impact evaluation of inflation and trade route changes, and comprehensive market trend analysis.
Data collection and base year analysis are done using data collection modules with large sample sizes. The stage includes obtaining market information or related data through various sources and strategies. It includes examining and planning all the data acquired from the past in advance. It likewise envelops the examination of information inconsistencies seen across different information sources. The market data is analysed and estimated using market statistical and coherent models. Also, market share analysis and key trend analysis are the major success factors in the market report. To know more, please request an analyst call or drop down your inquiry.
The key research methodology used by DBMR research team is data triangulation which involves data mining, analysis of the impact of data variables on the market and primary (industry expert) validation. Data models include Vendor Positioning Grid, Market Time Line Analysis, Market Overview and Guide, Company Positioning Grid, Patent Analysis, Pricing Analysis, Company Market Share Analysis, Standards of Measurement, Global versus Regional and Vendor Share Analysis. To know more about the research methodology, drop in an inquiry to speak to our industry experts.
Data Bridge Market Research is a leader in advanced formative research. We take pride in servicing our existing and new customers with data and analysis that match and suits their goal. The report can be customized to include price trend analysis of target brands understanding the market for additional countries (ask for the list of countries), clinical trial results data, literature review, refurbished market and product base analysis. Market analysis of target competitors can be analyzed from technology-based analysis to market portfolio strategies. We can add as many competitors that you require data about in the format and data style you are looking for. Our team of analysts can also provide you data in crude raw excel files pivot tables (Fact book) or can assist you in creating presentations from the data sets available in the report.


