
North America Busway Market
Market Size in USD Billion
 USD
5.14 Billion
USD
8.13 Billion
2025
2033
USD
5.14 Billion
USD
8.13 Billion
2025
2033
| 2026 - 2033 | |
| USD 5.14 Billion | |
| USD 8.13 Billion | |
| % | |
|
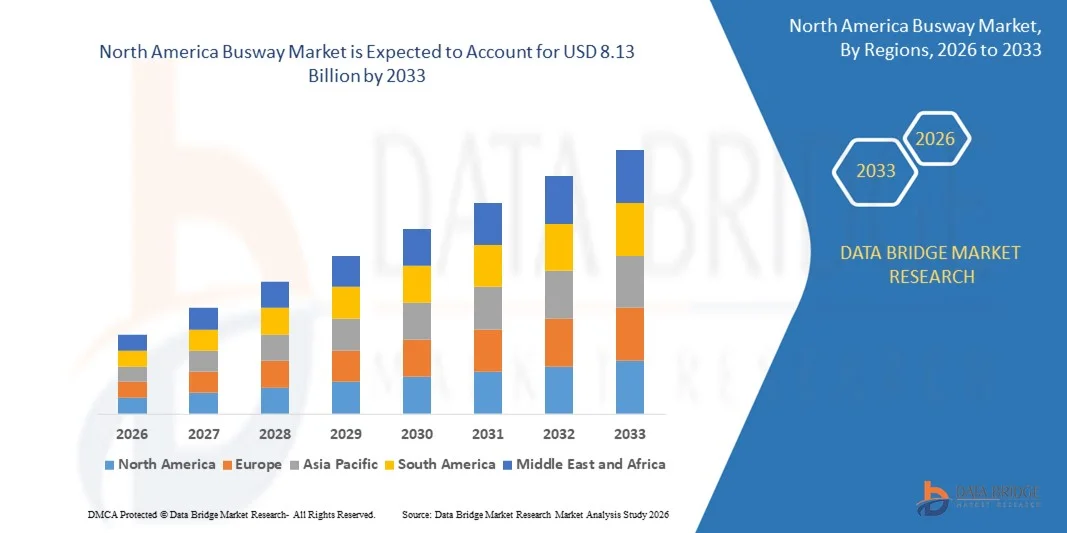
What is the North America Busway Market Size and Growth Rate?
- The North America busway market size was valued at USD 5.14 billion in 2025 and is expected to reach USD 8.13 billion by 2033, at a CAGR of 5.90% during the forecast period
- The market growth is largely fuelled by the increasing demand for reliable and efficient power distribution systems, expansion of smart grid infrastructure, and the rising need for compact and cost-effective power systems in industrial and commercial sectors
- In addition, the growing focus on renewable energy integration and the modernization of aging electrical infrastructure are further contributing to the steady rise in global busbar demand
What are the Major Takeaways of Busway Market?
- The busbar market is witnessing steady growth due to the growing integration of renewable energy sources into existing power grids, which requires flexible and efficient power distribution solutions
- Rapid urbanization and infrastructure development across developing regions, particularly in Asia-Pacific, are generating a significant demand for advanced electrical components, including busbars
- The U.S. dominated the North America busbar market with the largest revenue share of 37.2% in 2024, supported by its strong industrial manufacturing base, advanced power infrastructure, and significant investments in renewable energy integration, EV charging networks, and grid modernization projects
- Canada is witnessing the fastest growth rate of 10.87% in North America, driven by rapid expansion of renewable energy projects, electrification of transportation, and upgrades to aging transmission infrastructure
- The copper segment dominated the market with the largest revenue share in 2024, owing to its superior electrical conductivity, corrosion resistance, and mechanical strength
Report Scope and Busway Market Segmentation
|
Attributes |
Busway Key Market Insights |
|
Segments Covered |
|
|
Countries Covered |
North America
|
|
Key Market Players |
|
|
Market Opportunities |
|
|
Value Added Data Infosets |
In addition to the insights on market scenarios such as market value, growth rate, segmentation, geographical coverage, and major players, the market reports curated by the Data Bridge Market Research also include in-depth expert analysis, pricing analysis, brand share analysis, consumer survey, demography analysis, supply chain analysis, value chain analysis, raw material/consumables overview, vendor selection criteria, PESTLE Analysis, Porter Analysis, and regulatory framework. |
What is the Key Trend in the Busway Market?
Growing Adoption of Compact and Modular Busbar Systems
- The global shift toward space optimization is accelerating the adoption of compact and modular busbar systems, especially in urban infrastructure and commercial buildings where space is limited and system efficiency is prioritized. These systems reduce the footprint of electrical installations while enhancing layout flexibility. As a result, industries are turning to modular busbars to meet both structural and performance requirements
- Industries are favoring modular busbars due to their simplified installation, improved thermal management, and ability to handle high power loads within a confined layout, making them ideal for dense electrical setups. These features make them particularly suitable for manufacturing environments and server rooms. Their plug-and-play nature also reduces installation errors and labor costs
- Energy-efficient building designs are increasingly integrating modular systems that reduce energy losses and require minimal maintenance, aligning with green building standards and operational cost reduction goals. This trend supports sustainability objectives while improving long-term system reliability. Modular busbars also help reduce the use of non-recyclable wiring materials
- For instance, Schneider Electric’s I-Line Busway system and Siemens' BD2 compact busbars are being widely implemented in data centers and automated industrial environments due to their plug-and-play capability and system reliability. These products demonstrate industry adoption of modularity to reduce complexity and improve power density. Both systems are also designed with future scalability in mind
- The growing focus on modularity, compact design, and performance is pushing modular busbars to the forefront of power distribution innovation across various sectors. As urban infrastructure continues to densify and energy efficiency becomes a key metric, demand for these systems will continue to rise globally
What are the Key Drivers of Busway Market?
- Industrial expansion and commercial real estate growth are leading to higher demand for reliable and streamlined power distribution systems that support uninterrupted operations, reduced energy losses, and system scalability. Busbars help improve power flow efficiency across complex electrical grids. They are increasingly viewed as critical infrastructure in power-intensive operations
- Busbars provide a compact and organized alternative to traditional wiring, enhancing current-carrying capacity, reducing electromagnetic interference, and supporting safe energy distribution in high-load environments. Their structured design helps reduce fault risks and facilitates better energy monitoring. This is crucial in sectors with continuous power demands such as automotive and food processing
- The adoption of Industry 4.0 and automation technologies is reinforcing the demand for advanced power systems, where busbars serve as an integral component to support robotics, sensors, and smart equipment networks. Their reliability and ease of integration make them ideal for smart factories. They also support rapid reconfiguration of equipment layouts
- For instance, ABB’s busbar systems are widely used in automotive manufacturing plants and high-rise commercial complexes for their flexibility, load-handling efficiency, and ease of integration into intelligent power management systems. These systems enhance operational safety and facilitate centralized energy monitoring. ABB’s products are also favored for their modular expandability
- As industries and commercial buildings evolve toward smarter and more efficient infrastructures, busbars are becoming indispensable for supporting next-generation electrical demands. Their role in minimizing energy losses, improving power distribution, and adapting to automation trends solidifies their place in modern industrial architecture
Which Factor is Challenging the Growth of the Busway Market?
- The significant upfront investment required for installing busbar systems, especially in retrofitting applications, poses a challenge for widespread adoption, particularly among small and mid-sized enterprises with budget constraints. These businesses may opt for traditional cabling despite the long-term savings offered by busbars. Cost sensitivity often overrides efficiency considerations in early phases
- Compatibility with existing electrical infrastructure often demands layout redesigns, custom fittings, or additional components, which can increase overall system costs and delay project implementation. This is especially challenging in older buildings where space and panel configurations may not support standardized busbar systems. Upgrades can require significant downtime
- The shortage of skilled professionals with expertise in busbar system design and installation further complicates deployment, particularly in rural or underdeveloped areas where technical resources are limited. Without qualified technicians, the risk of improper installation increases. This adds to the total cost through rework or system inefficiencies
- For instance, in several aging industrial plants across Eastern North America, the adoption of busbar systems has been delayed due to high costs of integration and the need for building structural modifications. In these facilities, managers have cited a lack of local support and high custom installation costs as key deterrents. This trend affects retrofit adoption rates
- While busbars offer long-term efficiency benefits, the high initial expenditure and technical barriers continue to hinder market penetration, especially in cost-sensitive and legacy infrastructure environments. Addressing these challenges through cost-reduction strategies, skilled workforce development, and flexible system design will be critical for future market expansion
How is the Busway Market Segmented?
The market is segmented on the basis of conductor, weight, shape, insulation, length, busbar type, power rating, and end user.
- By Conductor
On the basis of conductor, the global busbar market is segmented into aluminium and copper. The copper segment dominated the market with the largest revenue share in 2024, owing to its superior electrical conductivity, corrosion resistance, and mechanical strength. Copper busbars are widely used in high-performance electrical applications such as switchgear, panel boards, and substations due to their durability and reliability under varying load conditions.
The aluminium segment is expected to witness the fastest growth rate from 2025 to 2032, driven by its lightweight nature, cost-effectiveness, and increasing preference in low-to-medium voltage applications. Aluminium busbars are gaining traction in commercial buildings and renewable energy systems where weight reduction and affordability are critical considerations.
- By Weight Wise
On the basis of weight, the busbar market is segmented into less than 1 kg and more than 1 kg. The more than 1 kg segment accounted for the largest revenue share in 2024, supported by high-volume industrial applications such as energy-intensive manufacturing, electric vehicle infrastructure, and data centers. These installations demand thicker, heavier busbars to handle high currents and ensure system stability.
The less than 1 kg segment is expected to witness the fastest growth rate from 2025 to 2032, owing to rising use in compact electrical units, residential panels, and portable electronic systems. Miniaturization of components and focus on lightweight electrical assemblies are encouraging the demand for lighter busbars.
- By Shape Wise
On the basis of shape, the market is segmented into chamfer and rectangle. The rectangle segment led the market in 2024 due to its standardization, ease of installation, and suitability for high-load electrical systems. Rectangular busbars are preferred in industrial and utility-scale projects where uniformity and design consistency are critical.
The chamfer segment is expected to witness the fastest growth rate from 2025 to 2032, due to its growing adoption in custom and high-frequency applications. Chamfered designs improve current flow, reduce skin effect losses, and are gaining popularity in aerospace and advanced electronics segments.
- By Insulation
On the basis of insulation, the market is segmented into epoxy power coating, teonix, tedler, mylar, nomex, kapton, and others. The epoxy power coating segment held the largest market share in 2024 due to its superior dielectric strength, mechanical protection, and resistance to harsh environmental conditions. It is widely used in outdoor switchgear and transportation systems.
Kapton is expected to witness the fastest growth rate from 2025 to 2032, owing to its exceptional thermal stability and application in high-temperature environments such as aerospace, defense electronics, and specialized industrial systems.
- By Length
On the basis of length, the market is segmented into less than 1m, 1m to 2m, 2m to 3m, and more than 3m. The 1m to 2m segment dominated the market in 2024, supported by standardized product configurations for electrical cabinets, control panels, and switchboards across industrial and commercial installations.
The more than 3m segment is expected to witness the fastest growth rate from 2025 to 2032, as large-scale infrastructure projects, substations, and renewable energy systems increasingly require longer busbars to span greater distances without performance loss.
- By Busbar Type
On the basis of type, the market is segmented into single conductor busbars, multiple conductor busbars, flexible busbars, and laminate busbars. The single conductor busbar segment captured the largest market share in 2024 due to its simplicity, robustness, and extensive use in power distribution panels and industrial control systems.
The flexible busbar segment is expected to witness the fastest growth rate from 2025 to 2032, driven by its ability to bend and adapt to compact spaces, making it ideal for electric vehicles, modular switchgear, and compact control assemblies.
- By Power Rating
On the basis of power rating, the market is segmented into low power, medium power (125A–800A), and high power (above 800A). The medium power segment dominated the market in 2024 due to its wide application range in commercial buildings, manufacturing units, and data centers, where moderate current distribution is required.
The high power segment is expected to witness the fastest growth rate from 2025 to 2032, supported by the surge in demand from power utilities, heavy industries, and electric vehicle charging stations requiring high-capacity current handling.
- By End User
On the basis of end user, the market is segmented into industrial, residential, and commercial. The industrial segment held the largest revenue share in 2024, owing to large-scale deployment of busbars in machinery, power systems, and automation lines for uninterrupted energy supply.
The commercial segment is expected to witness the fastest growth rate from 2025 to 2032, driven by increased investment in commercial infrastructure such as malls, hospitals, hotels, and office buildings that demand efficient and safe power distribution solutions.
Which Region Holds the Largest Share of the Busway Market?
- The U.S. dominated the North America busbar market with the largest revenue share of 37.2% in 2024, supported by its strong industrial manufacturing base, advanced power infrastructure, and significant investments in renewable energy integration, EV charging networks, and grid modernization projects
- The country’s emphasis on industrial automation, large-scale data center expansion, electric vehicle production, smart grid deployment, and commercial construction activities significantly drives demand for high-conductivity copper and aluminum busbar systems across power distribution and control applications
- Adoption of energy-efficient electrical systems, compact switchgear installations, and advanced transmission and distribution solutions enhances operational safety and performance. Federal clean energy incentives and infrastructure modernization programs further reinforce the U.S.’s leadership position within the North America Busbar market
Canada Busbar Market Insight
Canada is witnessing the fastest growth rate of 10.87% in North America, driven by rapid expansion of renewable energy projects, electrification of transportation, and upgrades to aging transmission infrastructure. Increasing investments in hydropower integration, battery storage systems, and commercial building electrification accelerate demand for reliable and flexible busbar solutions. Strong regulatory focus on decarbonization and sustainable energy development further boosts market adoption across industrial and utility sectors.
Mexico Busbar Market Insight
Mexico is expanding steadily, supported by growing industrialization, manufacturing facility expansion, and rising investments in renewable energy and commercial infrastructure. Development of new industrial parks, automotive production hubs, and energy distribution upgrades is increasing demand for efficient busbar trunking systems. Implementation of improved safety standards and modernization of electrical networks enhances system reliability. Favorable trade agreements and infrastructure investments position Mexico as a key growth contributor within the North America Busbar market.
Which are the Top Companies in Busway Market?
The Busway industry is primarily led by well-established companies, including:
- Texas Instruments Incorporated (U.S.)
- LIHOM XTALS (South Korea)
- Masterclock Inc. (U.S.)
- Renesas Electronics Corporation (Japan)
- Infineon Technologies AG (Germany)
- TXC (Taiwan)
- KYOCERA Corporation (Japan)
- Murata Manufacturing Co., Ltd. (Japan)
- Abracon (U.S.)
- Seiko Epson Corporation (Japan)
- Microchip Technology Inc. (U.S.)
- Rakon Limited (New Zealand)
- NIHON DEMPA KOGYO CO., LTD. (Japan)
- Silicon Laboratories (U.S.)
- SiTime Corp. (U.S.)
- Analog Devices, Inc. (U.S.)
- Vishay Intertechnology, Inc. (U.S.)
What are the Recent Developments in Global Busway Market?
- In April 2024, Referro Systems, an authorized distributor of Rockwell Automation in South Africa, announced the launch of the Cubic Cu-Flex range, a new line of flexible copper busbars. This development aims to offer enhanced flexibility and ease of installation in power distribution systems. The introduction of Cu-Flex is expected to support compact design requirements in modern electrical setups, improving both space efficiency and system reliability in commercial and industrial applications
- In March 2024, ABB unveiled its FlexLine series of modular protection devices designed to simplify installation and improve flexibility in residential and small commercial buildings. The series includes RCDs, MCBs, and AFDDs, all featuring push-in technology for quick integration on a single busbar type. This innovation enhances user convenience, reduces wiring time, and supports the growing demand for safer, smarter electrical distribution systems
- In April 2021, Tai Sin Electric launched its Busbar Trunking System, also known as Busway or Busduct, and established Singapore’s first and only Busbar Test Lab. This innovation marks a significant milestone in power distribution, offering a compact, efficient alternative to traditional cable systems. The move reinforces Tai Sin Electric’s position in the market and is expected to accelerate the adoption of advanced busbar systems across Southeast Asia
SKU-

- Interactive Data Analysis Dashboard
- Company Analysis Dashboard for high growth potential opportunities
- Research Analyst Access for customization & queries
- Competitor Analysis with Interactive dashboard
- Latest News, Updates & Trend analysis
- Harness the Power of Benchmark Analysis for Comprehensive Competitor Tracking
Data collection and base year analysis are done using data collection modules with large sample sizes. The stage includes obtaining market information or related data through various sources and strategies. It includes examining and planning all the data acquired from the past in advance. It likewise envelops the examination of information inconsistencies seen across different information sources. The market data is analysed and estimated using market statistical and coherent models. Also, market share analysis and key trend analysis are the major success factors in the market report. To know more, please request an analyst call or drop down your inquiry.
The key research methodology used by DBMR research team is data triangulation which involves data mining, analysis of the impact of data variables on the market and primary (industry expert) validation. Data models include Vendor Positioning Grid, Market Time Line Analysis, Market Overview and Guide, Company Positioning Grid, Patent Analysis, Pricing Analysis, Company Market Share Analysis, Standards of Measurement, Global versus Regional and Vendor Share Analysis. To know more about the research methodology, drop in an inquiry to speak to our industry experts.
Data Bridge Market Research is a leader in advanced formative research. We take pride in servicing our existing and new customers with data and analysis that match and suits their goal. The report can be customized to include price trend analysis of target brands understanding the market for additional countries (ask for the list of countries), clinical trial results data, literature review, refurbished market and product base analysis. Market analysis of target competitors can be analyzed from technology-based analysis to market portfolio strategies. We can add as many competitors that you require data about in the format and data style you are looking for. Our team of analysts can also provide you data in crude raw excel files pivot tables (Fact book) or can assist you in creating presentations from the data sets available in the report.


