
North America Cancer Photodynamic Therapy Market
Market Size in USD Billion
 USD
1.53 Billion
USD
2.46 Billion
2024
2032
USD
1.53 Billion
USD
2.46 Billion
2024
2032
| 2025 - 2032 | |
| USD 1.53 Billion | |
| USD 2.46 Billion | |
| % | |
|
North America Cancer Photodynamic Therapy Market Size
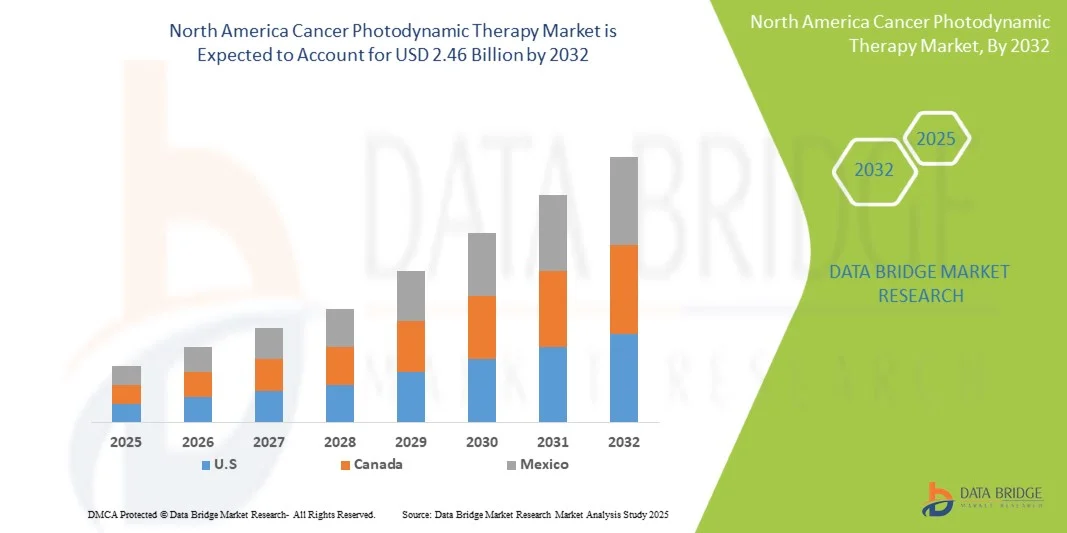
- The North America Cancer Photodynamic Therapy Market was valued at USD 1.53 billion in 2024 and is expected to reach USD 2.46 billion by 2032 at a CAGR of 6.2% during the forecast period
- The market is primarily driven by the rising cancer prevalence, increasing healthcare expenditure, and growing awareness of advanced treatment options. Rapid improvements in healthcare infrastructure, expansion of specialized cancer treatment centers
- This growth is driven by factors such as government initiatives promoting early diagnosis and innovative therapies, large patient pool and increasing investments by international and local companies in photodynamic therapy technologies
North America Cancer Photodynamic Therapy Market Analysis
- The Cancer Photodynamic Therapy (PDT) market is experiencing steady growth, driven by increasing cancer prevalence, rising awareness of non-invasive treatments, and advancements in photosensitizer drugs and laser technologies. North America dominates due to robust healthcare infrastructure and strong R&D investments
- Emerging markets are witnessing rapid adoption of PDT, fueled by government initiatives, growing healthcare expenditure, and rising geriatric populations. However, high treatment costs and limited reimbursement remain key restraints, while ongoing innovations in combination therapies and targeted photosensitizers present significant growth opportunities
- U.S. is expected to dominate the North America Cancer Photodynamic Therapy Market with the largest revenue share of 82.99% in 2025, supported by advanced healthcare infrastructure, high adoption of innovative treatments, strong R&D investments, favorable reimbursement policies, and awareness of minimally invasive therapies. Additionally, the presence of leading market players and supportive regulatory frameworks accelerates the region’s market growth and adoption rates
- U.S. is expected to be the fastest-growing in the North America Cancer Photodynamic Therapy Market during the forecast period with a CAGR of 6.4%, fueled by rising cancer prevalence, expanding healthcare infrastructure, increasing awareness of advanced therapies, and government initiatives promoting early diagnosis. Additionally, growing adoption of innovative technologies and rising disposable incomes drive demand for photodynamic therapy
- The Photosensitizer Drugs segment is expected to dominate the North America Cancer Photodynamic Therapy Market with a market share of 74.52% in 2025, driven by their central role in treatment, high specificity in targeting cancer cells, growing approvals of novel drugs, increasing adoption in combination therapies, and ongoing R&D driving enhanced efficacy and reduced side effects
Report Scope and North America Cancer Photodynamic Therapy Market Segmentation
|
Attributes |
North America Silk Key Market Insights |
|
Segments Covered |
|
|
Countries Covered |
North America
|
|
Key Market Players |
|
|
Market Opportunities |
|
|
Value Added Data Infosets |
In addition to the insights on market scenarios such as market value, growth rate, segmentation, geographical coverage, and major players, the market reports curated by the Data Bridge Market Research also include import export analysis, production capacity overview, production consumption analysis, price trend analysis, climate change scenario, supply chain analysis, value chain analysis, raw material/consumables overview, vendor selection criteria, PESTLE Analysis, Porter Analysis, and regulatory framework. |
North America Cancer Photodynamic Therapy Market Trends
“Integration With Other Cancer Therapies”
- The ability of photodynamic therapy (PDT) to produce localized tumour cell killing while stimulating immune responses positions it as an attractive partner for multimodal cancer treatment
- Rising evidence shows PDT can increase tumour antigen release, modulate the tumour microenvironment, and enhance infiltration or activation of immune cells — mechanisms that can synergize with immune checkpoint inhibitors, therapeutic cancer vaccines, chemotherapy or radiotherapy
- Combining PDT with systemic therapies may convert local control into durable systemic responses, enable dose reductions of toxic agents, and expand indications (for instance, unresectable or metastatic disease)
- As clinical and translational research multiplies, integration with other modalities represents a high-value pathway to broaden PDT’s clinical relevance and commercial uptake
North America Cancer Photodynamic Therapy Market Dynamics
Driver
“Increasing Prevalence of Cancer”
- The increasing prevalence of cancer globally is one of the foremost drivers fuelling demand for therapies such as photodynamic therapy (PDT)
- As populations grow and age, and as diagnostic tools improve, more cancer cases are being detected each year
- Higher rates of risk-factors such as tobacco use, obesity, sedentary lifestyles, air pollution, and infections in low- and middle-income countries are also contributing to rising incidence.
- With more patients requiring effective, less invasive, and cost-efficient localised treatment modalities, PDT becomes more attractive
- This rising cancer burden stresses health systems, creating urgent pressure for therapies that can improve outcomes, reduce side effects, and be deployed more widely
Restraint/Challenge
“Limited Depth of Light Penetration”
- A significant limitation hampering the wider adoption and effectiveness of photodynamic therapy is the restricted penetration of activating light into human tissues
- Because photosensitizers must be activated by light of specific wavelengths, the absorption and scattering of light by tissue reduce how deep illumination can reach
- Visible-light PSs often work only for superficial or easily accessible tumors; deeper or larger tumors remain challenging
- This limitation leads to incomplete tumor destruction, necessitates invasive light delivery (for instance, fiber probes, endoscopy), increases procedure complexity, and can lead to poor outcomes or recurrence
- Until breakthroughs overcome this, PDT remains constrained in the range of cancers it can treat non-invasively and effectively
North America Cancer Photodynamic Therapy Market Scope
The market is segmented on the basis of product type, cancer indication, therapy modality, procedure technique, disease stage, patient demographics, end user, and distribution channel.
- By Product Type
On the basis of Product Type, North America Cancer Photodynamic Therapy Market is segmented into Photosensitizer Drugs, and Photodynamic Therapy Devices. In 2025, the Photosensitizer Drugs is expected to dominate the market with 74.52% share, due to their critical role in treatment efficacy, wide applicability across cancer types, and versatile formulations (intravenous, topical, oral, intravesical, intraperitoneal). Key factors driving this dominance include rising cancer prevalence, growing adoption of minimally invasive therapies, ongoing drug innovations, and regulatory approvals, which together make photosensitizers the primary revenue contributor over PDT devices.
Photosensitizer Drugs is the fastest-growing segment with 6.4% CAGR in the North America Cancer Photodynamic Therapy Market due to increasing adoption of targeted and minimally invasive cancer treatments. Rising awareness of PDT’s effectiveness, fewer side effects compared to conventional therapies, and the development of next-generation photosensitizers with improved tumor selectivity and deeper tissue penetration are driving demand. Additionally, supportive clinical research and approvals for novel photosensitizing agents fuel market expansion.
- By Cancer Indication
On the basis of Cancer Indication, the North America Cancer Photodynamic Therapy Market is segmented into Skin & Cutaneous Oncology, Head & Neck, Esophageal, Lung, Bladder, Cervical, and Prostate. In 2025, the Skin & Cutaneous Oncology segment is expected to dominate the market with 51.21% share, owing to the high prevalence of skin cancers, widespread awareness of early detection, and the effectiveness of PDT in achieving superior cosmetic outcomes. The segment benefits from broad adoption of photosensitizer drugs and PDT devices, especially for geriatric and adult patients, who represent the largest patient demographics. Additionally, increasing demand for minimally invasive, targeted therapies for actinic keratoses, basal cell carcinoma, and squamous cell carcinoma, along with favorable reimbursement policies in key regions, further reinforces its market leadership over other cancer indications.
The Skin & Cutaneous Oncology segment is the fastest growing with 6.8% CAGR in the North America Cancer Photodynamic Therapy Market due to increasing prevalence of skin cancers, rising awareness about early diagnosis, and preference for minimally invasive treatments with fewer side effects. Photodynamic therapy offers targeted action, quick recovery, and improved cosmetic outcomes, making it highly favorable for dermatological oncology. Additionally, technological advancements in photosensitizers and light delivery systems are driving adoption in this segment.
- By Therapy Modality
On the basis of Therapy Modality, the North America Cancer Photodynamic Therapy Market is segmented into Standalone Therapy, Adjunctive Therapy, Palliation Therapy, And Others. In 2025, the Standalone Therapy segment is expected to dominate the market with 39.97% share, due to its effectiveness as a primary treatment for localized cancers, including skin, esophageal, and lung cancers. Key factors driving this dominance include high efficacy, minimal invasiveness, superior cosmetic outcomes, and growing clinical preference for targeted therapies. Regionally, North America and Europe lead the adoption of standalone PDT due to advanced healthcare infrastructure, established reimbursement frameworks, and high patient awareness, while emerging markets in Asia-Pacific are witnessing growing uptake driven by rising cancer prevalence, expanding hospital networks, and increasing access to modern oncology treatments. These regional dynamics, combined with increasing education and awareness about PDT benefits, reinforce the dominance of standalone therapy globally.
Standalone therapy is the fastest-growing segment with 6.8% CAGR in the North America Cancer Photodynamic Therapy Market due to its simplicity, cost-effectiveness, and reduced side effects compared to combination therapies. It allows targeted tumor treatment without the need for additional drugs or interventions, improving patient compliance. Increasing adoption in outpatient settings, rising awareness of minimally invasive treatments, and advancements in photosensitizers and light delivery systems are further driving the rapid growth of this segment.
- By Procedure Technique
On the basis of Procedure Technique, the North America Cancer Photodynamic Therapy Market is segmented into External Beam, Intracavitary (Endoscopic) Delivery, Interstitial (Internal) Delivery, and Others. In 2025, the External Beam segment is expected to dominate the market with 68.32% share, due to its non-invasive nature, ease of use, and effectiveness for superficial tumors. Strong adoption in North America and Europe, supported by advanced healthcare infrastructure and reimbursement policies, along with rising demand in Asia-Pacific from growing cancer prevalence and awareness, drives its market leadership.
The Intracavitary (Endoscopic) Delivery segment is the fastest growing with 6.2% CAGR in the North America Cancer Photodynamic Therapy Market as it enables minimally invasive, targeted light and photosensitizer administration to hollow-organ tumors, reduces systemic exposure and side effects, allows repeatable treatments, improves tumor access in esophageal, bronchial, and bladder cancers, and shortens recovery time.
- By Disease Stage
On the basis of Disease Stage, the North America Cancer Photodynamic Therapy Market is segmented into Early-Stage Cancer, and Late-Stage Cancer. In 2025, the Early-Stage Cancer segment is expected to dominate the market with 81.12% share, due to effectiveness of PDT in targeting localized tumors, minimizing damage to healthy tissue, and offering better cosmetic outcomes. The segment benefits from high patient awareness, preference for minimally invasive treatments, and widespread adoption in North America and Europe, while growing cancer diagnosis rates and expanding oncology infrastructure in Asia-Pacific further support its market leadership.
Early-Stage Cancer is the fastest-growing segment with 6.3% CAGR in the North America Cancer Photodynamic Therapy Market due to increasing adoption of minimally invasive treatments, rising awareness about early detection, and improved patient outcomes with PDT. Early-stage cancers respond better to targeted therapies, leading to higher efficacy and fewer side effects. Additionally, supportive government initiatives and advancements in photosensitizers and light delivery systems are driving faster market penetration in this segment.
- By Patient Demographics
On the basis of Patient Demographics, the North America Cancer Photodynamic Therapy Market is segmented into Geriatric, Adults, and Pediatric. In 2025, the Geriatric segment is expected to dominate the market with 66.15% share, due to the higher prevalence of cancer among older adults, increased susceptibility to skin and cutaneous cancers, and preference for minimally invasive, targeted treatments. Strong adoption in North America and Europe, supported by advanced healthcare infrastructure and awareness, along with growing elderly populations.
The Geriatric segment is the fastest growing with 6.5% CAGR in the North America Cancer Photodynamic Therapy Market due to the higher cancer prevalence among older adults. Aging weakens the immune system and increases susceptibility to various cancers, driving demand for effective, minimally invasive treatments like PDT. Additionally, PDT offers lower side effects and quicker recovery, making it suitable for elderly patients who may not tolerate aggressive therapies, fueling market growth in this demographic.
- By End User
On the basis of End User, the North America Cancer Photodynamic Therapy Market is segmented into Hospitals, Dermatology & Skin-cancer clinics, Ambulatory Surgical Centers (ASCS), Academic & Research Institutes, and Others. In 2025, the Hospitals segment is expected to dominate the market with 40.10% share, due to their comprehensive infrastructure, availability of specialized oncology departments, and ability to offer integrated PDT treatments. Both public and private hospitals, particularly Tier 1 and Tier 2 facilities in North America and Europe, lead adoption due to advanced healthcare systems and reimbursement support. Growing hospital networks and expanding oncology services in Asia-Pacific further reinforce the dominance of hospitals as the primary end users of cancer PDT globally.
Hospitals is the fastest-growing segment with 7.0% CAGR in the North America Cancer Photodynamic Therapy Market due to increasing adoption of advanced cancer treatments, higher patient inflow, and availability of specialized oncology departments. Hospitals provide comprehensive PDT services, including diagnosis, treatment, and post-therapy care, making them preferred over standalone clinics. Additionally, rising awareness, government initiatives, and insurance coverage further drive hospital-based PDT adoption.
- By Distribution Channel
On the basis of Distribution Channel, the North America Cancer Photodynamic Therapy Market is segmented into Direct Tender, Third Party Distributors, Online, and Others. In 2025, the Direct Tender segment is expected to dominate the market with 49.75% share, due to bulk procurement by hospitals, government healthcare programs, and large oncology centers, which ensures cost efficiency and reliable supply of photosensitizers and PDT devices. Strong adoption in North America and Europe, supported by structured hospital procurement systems and public health tenders, along with growing institutional demand.
The Direct Tender segment is the fastest growing with 6.5% CAGR in the North America Cancer Photodynamic Therapy Market due to increasing government and hospital procurement of advanced PDT devices through direct contracts. This approach ensures cost-effectiveness, faster procurement, and reliable supply for large-scale cancer treatment programs. Additionally, rising public healthcare spending, government initiatives for cancer care, and preference for centralized purchasing drive the adoption of direct tendering over distributors or online channels.
North America Cancer Photodynamic Therapy Market Regional Analysis
- U.S. is expected to dominate the North America Cancer Photodynamic Therapy Market with the largest revenue share of 82.99% in 2025, supported by advanced healthcare infrastructure, high adoption of innovative treatments, strong R&D investments, favorable reimbursement policies, and awareness of minimally invasive therapies. Additionally, the presence of leading market players and supportive regulatory frameworks accelerates the region’s market growth and adoption rates
- U.S. is expected to be the fastest-growing in the North America Cancer Photodynamic Therapy Market during the forecast period with a CAGR of 6.4%, fueled by rising cancer prevalence, expanding healthcare infrastructure, increasing awareness of advanced therapies, and government initiatives promoting early diagnosis. Additionally, growing adoption of innovative technologies and rising disposable incomes drive demand for photodynamic therapy.
- Additionally, the presence of leading market players and supportive regulatory frameworks accelerates the region’s market growth and adoption rates.
U.S. North America Cancer Photodynamic Therapy Market Insight
The U.S. North America Cancer Photodynamic Therapy Market accounted for the largest revenue share in North America in 2024, supported by advanced healthcare infrastructure, high adoption of innovative therapies, and strong R&D investments. Presence of major PDT device manufacturers, favorable reimbursement policies, and rising cancer prevalence drive market revenue. Additionally, awareness programs and early diagnosis initiatives increase treatment uptake. The combination of technological advancement, supportive regulatory environment, and high patient spending power positions the U.S. as the largest revenue contributor.
Canada North America Cancer Photodynamic Therapy Market Insight
The Canada North America Cancer Photodynamic Therapy Market is steadily growing in North America in 2024, supported increasing cancer incidence, supportive government healthcare funding, and faster regulatory approvals for PDT devices and photosensitizers. Rising adoption in specialized oncology centers, growing physician awareness, expanding clinical evidence demonstrating efficacy for superficial and localized tumors, and collaborations between hospitals and biotech firms fuel uptake. Patient preference for minimally invasive treatments and reimbursement improvements further sustain market expansion across provinces nationally.
The Major Market Leaders Operating in the Market Are:
- Novartis Pharma AG (Switzerland)
- Galderma SA (Switzerland)
- Bausch Health Companies Inc. (Canada)
- Photocure ASA (Norway)
- ADVANZ PHARMA Corp. (U.K.)
- Sun Pharmaceutical Industries Ltd. (India)
- Biofrontera AG (Germany)
- LUMIBIRD SA (France)
- LUZITIN S.A. (Portugal)
- Lumeda Inc. (Sweden)
- ImPact Biotech (Israel)
- biolitec Holding GmbH & Co KG (Germany)
- Modulight Corporation (Finland)
- THERALASE TECHNOLOGIES INC. (Canada)
Latest Developments in North America Cancer Photodynamic Therapy Market
- In February 2023, the collaboration between Galderma and German Medical Engineering (GME) represents a strategic development in the dermatology and photodynamic therapy (PDT) market. By combining Galderma’s Metvix, a leading photosensitizer for precancerous and non-melanoma skin cancers, with GME’s MultiLite device, the partnership strengthens Galderma’s integrated treatment offering and expands its ability to deliver both conventional red-light PDT (C-PDT) and the more patient-friendly artificial daylight PDT (ADL-PDT).
- In 2025, McKesson completed acquisition of Core Ventures (Community Oncology Revitalization Enterprise Ventures), acquiring ~70% controlling interest for about US$2.49B, to strengthen its community-based oncology care through Florida Cancer Specialists & Research Institute.
- In 2025, Biofrontera AG transferred all U.S. assets related to Ameluz and RhodoLED to Biofrontera Inc., receiving a 10% equity stake and royalties of 12–15% on U.S. Ameluz sales.
SKU-

- Interactive Data Analysis Dashboard
- Company Analysis Dashboard for high growth potential opportunities
- Research Analyst Access for customization & queries
- Competitor Analysis with Interactive dashboard
- Latest News, Updates & Trend analysis
- Harness the Power of Benchmark Analysis for Comprehensive Competitor Tracking
Table of Content
1 INTRODUCTION
1.1 OBJECTIVES OF THE STUDY
1.2 MARKET DEFINITION
1.3 OVERVIEW OF NORTH AMERICA CANCER PHOTODYNAMIC THERAPY MARKET
1.4 LIMITATIONS
1.5 MARKETS COVERED
2 MARKET SEGMENTATION
2.1 MARKETS COVERED
2.2 GEOGRAPHICAL SCOPE
2.3 YEARS CONSIDERED FOR THE STUDY
2.4 CURRENCY AND PRICING
2.5 DBMR TRIPOD DATA VALIDATION MODEL
2.6 MULTIVARIATE MODELLING
2.7 PRIMARY INTERVIEWS WITH KEY OPINION LEADERS
2.8 DBMR MARKET POSITION GRID
2.9 MARKET END USER COVERAGE GRID
2.1 SECONDARY SOURCES
2.11 ASSUMPTIONS
3 EXECUTIVE SUMMARY
4 PREMIUM INSIGHTS
4.1 PORTER’S FIVE FORCES
4.2 PESTEL ANALYSIS
4.3 PRODUCTION CONSUMPTION ANALYSIS
4.3.1 INTRODUCTION
4.3.2 PRODUCTION SIDE ANALYSIS
4.3.2.1 PHOTOSENSITIZER MANUFACTURING
4.3.2.2 DEVICE MANUFACTURING
4.3.2.3 RESEARCH AND INNOVATION
4.3.3 CONSUMPTION SIDE ANALYSIS
4.3.3.1 CLINICAL APPLICATION
4.3.3.2 TREATMENT VOLUMES AND TRENDS
4.3.3.3 DOSAGE AND PROTOCOLS
4.3.4 PRODUCTION–CONSUMPTION DYNAMICS
4.3.4.1 SUPPLY CONSTRAINTS
4.3.4.2 REGIONAL OVERVIEW
4.3.4.3 FUTURE OUTLOOK
4.3.5 CONCLUSION
4.4 COST ANALYSIS BREAKDOWN
4.4.1 INTRODUCTION
4.4.2 DIRECT MEDICAL COSTS
4.4.2.1 COST OF PHOTOSENSITIZERS
4.4.2.2 LIGHT DELIVERY SYSTEMS
4.4.2.3 HEALTHCARE FACILITY CHARGES
4.4.3 INDIRECT COSTS
4.4.3.1 PATIENT-RELATED EXPENSES
4.4.3.2 POST-TREATMENT MONITORING
4.4.4 COMPARATIVE COST-EFFECTIVENESS
4.4.5 REIMBURSEMENT AND INSURANCE IMPACT
4.4.6 REGIONAL COST VARIATIONS
4.4.7 FUTURE COST TRENDS AND REDUCTION STRATEGIES
4.4.7.1 TECHNOLOGICAL ADVANCEMENTS
4.4.7.2 HEALTHCARE EFFICIENCY INITIATIVES
4.4.8 CONCLUSION
4.5 TECHNOLOGICAL ADVANCEMENTS
4.5.1 INTRODUCTION
4.5.2 NEXT-GENERATION PHOTOSENSITIZERS
4.5.3 ADVANCEMENTS IN LIGHT DELIVERY SYSTEMS
4.5.4 NANOTECHNOLOGY-ENABLED DELIVERY
4.5.5 COMBINATION THERAPIES AND IMMUNOMODULATION
4.5.6 DIGITAL INTEGRATION AND TREATMENT PLANNING
4.5.7 RECENT TRENDS AND OUTLOOK
4.5.8 CONCLUSION
4.6 VALUE CHAIN ANALYSIS
4.6.1 INTRODUCTION
4.6.2 RESEARCH & DEVELOPMENT
4.6.2.1 DISCOVERY OF PHOTOSENSITIZERS
4.6.2.2 DEVELOPMENT OF LIGHT DELIVERY SYSTEMS
4.6.2.3 CLINICAL TRIALS AND REGULATORY APPROVALS
4.6.3 MANUFACTURING
4.6.3.1 PRODUCTION OF PHOTOSENSITIZERS
4.6.3.2 FABRICATION OF LIGHT DELIVERY DEVICES
4.6.4 DISTRIBUTION & LOGISTICS
4.6.4.1 SUPPLY CHAIN MANAGEMENT
4.6.4.2 INTERNATIONAL TRADE AND MARKET ACCESS
4.6.5 CLINICAL APPLICATION
4.6.5.1 INTEGRATION INTO TREATMENT PROTOCOLS
4.6.5.2 TRAINING AND EDUCATION
4.6.6 POST-TREATMENT MONITORING & SUPPORT
4.6.6.1 FOLLOW-UP CARE
4.6.6.2 PATIENT SUPPORT SERVICES
4.6.7 TECHNOLOGICAL ADVANCEMENTS INFLUENCING THE PDT VALUE CHAIN
4.6.7.1 NANOTECHNOLOGY IN PDT
4.6.7.2 ARTIFICIAL INTELLIGENCE AND IMAGING
4.6.7.3 PERSONALIZED MEDICINE
4.6.8 CONCLUSION
4.7 VENDOR SELECTION CRITERIA
4.7.1 INTRODUCTION
4.7.2 CORE SELECTION CRITERIA
4.7.2.1 REGULATORY COMPLIANCE
4.7.2.2 CLINICAL EVIDENCE AND RESEARCH SUPPORT
4.7.2.3 TECHNICAL PERFORMANCE AND DEVICE COMPATIBILITY
4.7.2.4 QUALITY MANAGEMENT AND MANUFACTURING STANDARDS
4.7.2.5 SERVICE, TRAINING, AND AFTER-SALES SUPPORT
4.7.2.6 SUPPLY CHAIN RELIABILITY
4.7.3 RECENT TRENDS IN VENDOR SELECTION
4.7.4 RISK FACTORS AND VULNERABILITIES
4.7.5 KEY PERFORMANCE INDICATORS
4.7.6 STRATEGIC RECOMMENDATIONS
4.7.7 CONCLUSION
4.8 PATENT ANALYSIS
4.8.1 PATENT QUALITY AND STRENGTH
4.8.2 PATENT FAMILIES
4.8.3 LICENSING AND COLLABORATIONS
4.8.4 REGIONAL PATENT LANDSCAPE
4.8.5 IP STRATEGY AND MANAGEMENT
4.9 SUPPLY CHAIN ANALYSIS
4.9.1 OVERVIEW
4.9.2 LOGISTIC COST SCENARIO
4.9.3 IMPORTANCE OF LOGISTICS SERVICE PROVIDERS
4.9.4 CONCLUSION
4.1 INDUSTRY ECOSYSTEM ANALYSIS
4.10.1 INTRODUCTION
4.10.2 ECOSYSTEM ARCHITECTURE — KEY ACTORS AND ROLES
4.10.2.1 CORE TECHNOLOGY PROVIDERS
4.10.2.2 ENABLING INSTITUTIONS
4.10.3 VALUE CHAIN AND FUNCTIONAL FLOWS
4.10.3.1 RESEARCH AND DISCOVERY
4.10.3.2 CLINICAL DEVELOPMENT AND REGULATORY VALIDATION
4.10.3.3 MANUFACTURING AND QUALITY ASSURANCE
4.10.3.4 DISTRIBUTION, PROCUREMENT AND CLINICAL ADOPTION
4.10.4 MARKET ENABLERS AND INFRASTRUCTURE
4.10.4.1 SCIENTIFIC AND REGULATORY ENABLERS
4.10.4.2 REIMBURSEMENT AND HEALTH-ECONOMICS INFRASTRUCTURE
4.10.4.3 MANUFACTURING AND SUPPLY-CHAIN CAPACITY
4.10.5 INTERDEPENDENCIES AND STRATEGIC PARTNERSHIPS
4.10.5.1 ACADEMIA-INDUSTRY TECHNOLOGY TRANSFER
4.10.5.2 VERTICAL INTEGRATION AND CONTRACT MANUFACTURING
4.10.5.3 CLINICAL NETWORKS AND KOL ECOSYSTEMS
4.10.6 RISKS, CONSTRAINTS AND SYSTEMIC VULNERABILITIES
4.10.6.1 REGULATORY COMPLEXITY FOR COMBINED PRODUCTS
4.10.6.2 SUPPLY-CHAIN CONCENTRATION AND MATERIAL RISK
4.10.6.3 EVIDENCE AND REIMBURSEMENT UNCERTAINTY
4.10.6.4 CLINICAL OPERATIONAL BARRIERS
4.10.7 STRATEGIC IMPLICATIONS AND RECOMMENDATIONS
4.10.8 OUTLOOK — EVOLUTION OF THE ECOSYSTEM
4.10.9 CONCLUSION
4.11 INNOVATION TRACKER AND STRATEGIC ANALYSIS
4.11.1 INTRODUCTION
4.11.2 RECENT TECHNOLOGICAL INNOVATIONS
4.11.2.1 ADVANCED PHOTOSENSITIZERS
4.11.2.2 OXYGEN-SELF-SUFFICIENT PLATFORMS
4.11.2.3 ALTERNATIVE ACTIVATION MODALITIES
4.11.2.4 SMART NANOPLATFORMS
4.11.2.5 NOVEL CHEMICAL STRUCTURES
4.11.3 STRATEGIC INNOVATIONS IN DELIVERY SYSTEMS
4.11.3.1 LIGHT DELIVERY DEVICES
4.11.3.2 COMBINATION THERAPIES
4.11.3.3 IMAGING INTEGRATION
4.11.4 KEY CHALLENGES
4.11.5 STRATEGIC THEMES
4.11.6 STRATEGIC IMPLICATIONS FOR MARKET PLAYERS
4.11.7 RECOMMENDATIONS
4.11.8 OUTLOOK AND STRATEGIC RISKS
4.11.9 CONCLUSION
4.12 PRICING ANALYSIS
4.12.1 INTRODUCTION
4.12.2 COMPONENTS OF THE TOTAL TREATMENT PRICE
4.12.2.1 PHOTOSENSITIZING AGENT (DRUG) COSTS
4.12.2.2 DEVICE CAPITAL AND MAINTENANCE COST
4.12.2.3 CONSUMABLES AND PROCEDURAL OVERHEAD
4.12.2.4 INDIRECT AND DOWNSTREAM COSTS
4.12.3 PRICING MODELS AND APPROACHES
4.12.3.1 COST-PLUS AND MARKUP MODELS
4.12.3.2 VALUE-BASED AND OUTCOMES-LINKED PRICING
4.12.3.3 BUNDLED PAYMENTS AND PROCEDURAL TARIFFS
4.12.3.4 SUBSCRIPTION AND MANAGED-SERVICE MODELS FOR DEVICES
4.12.4 REIMBURSEMENT LANDSCAPE
4.12.4.1 UNITED STATES: MEDICARE AND COMMERCIAL PAYERS
4.12.4.2 EUROPE AND OTHER HIGH-INCOME MARKETS
4.12.4.3 EMERGING MARKETS AND OUT-OF-POCKET DYNAMICS
4.12.5 REGIONAL PRICE DIFFERENTIALS AND DRIVERS
4.12.5.1 MANUFACTURING FOOTPRINT AND SUPPLY-CHAIN EFFECTS
4.12.5.2 REGULATORY BURDEN AND MARKET ACCESS TIMELINES
4.12.5.3 CLINICAL PRACTICE PATTERNS AND REIMBURSEMENT POLICY
4.12.6 PRICE SENSITIVITY, ACCESS, AND EQUITY
4.12.6.1 PRICE ELASTICITY IN HOSPITAL PROCUREMENT
4.12.6.2 PATIENT ACCESS AND SOCIOECONOMIC BARRIERS
4.12.7 COMPETITIVE & STRATEGIC PRICING IMPLICATIONS
4.12.7.1 DIFFERENTIATION-BASED PREMIUM PRICING
4.12.7.2 PENETRATION PRICING AND VOLUME STRATEGIES
4.12.7.3 MANAGED ENTRY AGREEMENTS AND OUTCOMES GUARANTEES
4.12.8 RECOMMENDATIONS FOR STAKEHOLDERS
4.12.8.1 FOR MANUFACTURERS
4.12.8.2 FOR PROVIDERS AND HOSPITAL SYSTEMS
4.12.8.3 FOR PAYERS AND POLICYMAKERS
4.12.9 RISKS, UNCERTAINTIES, AND FUTURE PRICE PRESSURES
4.12.10 CONCLUSION
5 TARIFFS & IMPACT ON THE MARKET
5.1 INTRODUCTION
5.2 TARIFF LANDSCAPE RELEVANT TO PDT PRODUCTS
5.2.1 CATEGORIES OF TRADE EXPOSURE
5.2.2 RECENT AND EMERGING TARIFF MEASURES OF CONSEQUENCE
5.3 DIRECT COST IMPACTS
5.3.1 INCREASED LANDED COSTS AND MARGIN COMPRESSION
5.3.2 PRICE VOLATILITY AND PROCUREMENT BUDGETING
5.4 SUPPLY-CHAIN & MANUFACTURING IMPLICATIONS
5.4.1 SUPPLIER DIVERSIFICATION AND RESHORING INCENTIVES
5.4.2 SOURCING OF HIGH-VALUE NANOMATERIALS AND COMPONENTS
5.4.3 REGULATORY AND QUALIFICATION COSTS FOR NEW SUPPLIERS
5.5 CLINICAL ACCESS, PRICING & REIMBURSEMENT EFFECTS
5.5.1 ACCESS RISK FOR PATIENTS AND PROVIDERS
5.5.2 REIMBURSEMENT PRESSURE AND HEALTH-ECONOMIC ASSESSMENTS
5.6 R&D, INNOVATION & COMPETITIVE IMPLICATIONS
5.6.1 DISRUPTION OF RESEARCH SUPPLIES AND COLLABORATION FLOWS
5.6.2 STRATEGIC REPOSITIONING AND COMPETITIVE ADVANTAGE
5.7 POLICY, COMPLIANCE & REGULATORY CONSIDERATIONS
5.7.1 USE OF WTO AND PREFERENTIAL TRADE RULES
5.7.2 TARIFF MITIGATION TOOLS AND ADVOCACY
5.8 RECOMMENDATIONS FOR STAKEHOLDERS
5.9 CONCLUSION
6 REGULATION COVERAGE
6.1 PRODUCT CODES
6.1.1 CERTIFIED STANDARDS
6.1.2 SAFETY STANDARDS
6.1.3 MATERIAL HANDLING & STORAGE
6.1.4 TRANSPORT & PRECAUTIONS
6.1.5 HAZARD IDENTIFICATION
6.1.6 CONCLUSION
7 MARKET OVERVIEW
7.1 DRIVERS
7.1.1 INCREASING PREVALENCE OF CANCER
7.1.2 GROWING PREFERENCE FOR MINIMALLY INVASIVE THERAPIES
7.1.3 TECHNOLOGICAL ADVANCEMENTS IN PHOTOSENSITIZERS AND DEVICES
7.1.4 EXPANDING RESEARCH AND CLINICAL DEVELOPMENT PIPELINE
7.2 RESTRAINTS
7.2.1 LIMITED DEPTH OF LIGHT PENETRATION
7.2.2 HIGH COST OF TREATMENT
7.3 OPPORTUNITIES
7.3.1 INTEGRATION WITH OTHER CANCER THERAPIES
7.3.2 DEVELOPMENT OF NOVEL PHOTOSENSITIZERS
7.3.3 M&A AND PARTNERSHIPS WITH ONCOLOGY DEVICE/LASER FIRMS AND PHARMA
7.4 CHALLENGES
7.4.1 TUMOR HYPOXIA AS A BIOLOGICAL BARRIER TO PHOTODYNAMIC THERAPY EFFICACY
7.4.2 COMPETITION FROM ALTERNATIVE TREATMENTS
8 NORTH AMERICA CANCER PHOTODYNAMIC THERAPY MARKET, BY PRODUCT TYPE
8.1 OVERVIEW
8.2 PHOTOSENSITIZER DRUGS
8.3 PHOTODYNAMIC THERAPY DEVICES
9 NORTH AMERICA CANCER PHOTODYNAMIC THERAPY MARKET, BY CANCER INDICATION
9.1 OVERVIEW
9.2 SKIN & CUTANEOUS ONCOLOGY
9.3 HEAD & NECK
9.4 ESOPHAGAL
9.5 LUNG
9.6 BLADDER
9.7 CERVICAL
9.8 PROSTATE
10 NORTH AMERICA CANCER PHOTODYNAMIC THERAPY MARKET, BY THERAPY MODALITY
10.1 OVERVIEW
10.2 STANDALONE THERAPY
10.3 ADJUNCTIVE THERAPY
10.4 PALLIATION THERAPY
10.5 OTHERS
11 NORTH AMERICA CANCER PHOTODYNAMIC THERAPY MARKET, BY PROCEDURE TECHNIQUE
11.1 OVERVIEW
11.2 EXTERNAL BEAM
11.3 INTRACAVITARY (ENDOSCOPIC) DELIVERY
11.4 INTERSTITIAL (INTERNAL) DELIVERY
11.5 OTHERS
12 NORTH AMERICA CANCER PHOTODYNAMIC THERAPY MARKET, BY DISEASE STAGE
12.1 OVERVIEW
12.2 EARLY-STAGE CANCER
12.3 LATE-STAGE CANCER
13 NORTH AMERICA CANCER PHOTODYNAMIC THERAPY MARKET, BY PATIENT DEMOGRAPHICS
13.1 OVERVIEW
13.2 GERIATRIC
13.3 ADULTS
13.4 PEDIATRIC
14 NORTH AMERICA CANCER PHOTODYNAMIC THERAPY MARKET, BY END USER
14.1 OVERVIEW
14.2 HOSPITALS
14.3 DERMATOLOGY & SKIN-CANCER CLINICS
14.4 AMBULATORY SURGICAL CENTERS (ASCS)
14.5 ACADEMIC & RESEARCH INSTITUTES
14.6 OTHERS
15 NORTH AMERICA CANCER PHOTODYNAMIC THERAPY MARKET, BY DISTRIBUTION CHANNEL
15.1 OVERVIEW
15.2 DIRECT TENDER
15.3 THIRD PARTY DISTRIBUTORS
15.4 ONLINE
15.5 OTHERS
16 NORTH AMERICA CANCER PHOTODYNAMIC THERAPY MARKET, BY REGION
16.1 NORTH AMERICA
16.1.1 U.S.
16.1.2 CANADA
16.1.3 MEXICO
17 NORTH AMERICA CANCER PHOTODYNAMIC THERAPY MARKET: COMPANY LANDSCAPE
17.1 COMPANY SHARE ANALYSIS: GLOBAL
18 SWOT ANALYSIS
19 COMPANY PROFILE
19.1 NOVERTIS AG
19.1.1 COMPANY SNAPSHOT
19.1.2 REVENUE ANALYSIS
19.1.3 COMPANY SHARE ANALYSIS
19.1.4 PRODUCT PORTFOLIO
19.1.5 RECENT DEVELOPMENT
19.2 GALDERMA S. A.
19.2.1 COMPANY SNAPSHOT
19.2.2 REVENUE ANALYSIS
19.2.3 COMPANY SHARE ANALYSIS
19.2.4 PRODUCT PORTFOLIO
19.2.5 RECENT DEVELOPMENTS
19.3 PHOTOCURE
19.3.1 COMPANY SNAPSHOT
19.3.2 REVENUE ANALYSIS
19.3.3 COMPANY SHARE ANALYSIS
19.3.4 PRODUCT PORTFOLIO
19.3.5 RECENT DEVELOPMENT
19.4 ADVANZ PHARMA CORP.
19.4.1 COMPANY SNAPSHOT
19.4.2 COMPANY SHARE ANALYSIS
19.4.3 PRODUCT PORTFOLIO
19.4.4 RECENT DEVELOPMENT
19.5 AMERISOURCE BERGEN CORPORATION
19.5.1 COMPANY SNAPSHOT
19.5.2 REVENUE ANALYSIS
19.5.3 COMPANY SHARE ANALYSIS
19.5.4 PRODUCT PORTFOLIO
19.5.5 RECENT DEVELOPMENT
19.6 BIOFRONTERA AG
19.6.1 COMPANY SNAPSHOT
19.6.2 REVENUE ANALYSIS
19.6.3 PRODUCT PORTFOLIO
19.6.4 RECENT DEVELOPMENTS
19.7 BIOLITEC HOLDING GMBH & CO KG
19.7.1 COMPANY SNAPSHOT
19.7.2 PRODUCT PORTFOLIO
19.7.3 RECENT DEVELOPMENT
19.8 CARDINAL HEALTH
19.8.1 COMPANY SNAPSHOT
19.8.2 REVENUE ANALYSIS
19.8.3 PRODUCT PORTFOLIO
19.8.4 RECENT DEVELOPMENT
19.9 HEMERION THERAPEUTICS
19.9.1 COMPANY SNAPSHOT
19.9.2 PRODUCT PORTFOLIO
19.9.3 RECENT DEVELOPMENTS
19.1 IMPACT BIOTECH
19.10.1 COMPANY SNAPSHOT
19.10.2 PRODUCT PORTFOLIO
19.10.3 RECENT DEVELOPMENTS
19.11 INOVA
19.11.1 COMPANY SNAPSHOT
19.11.2 PRODUCT PORTFOLIO
19.11.3 RECENT DEVELOPMENT
19.12 LUMIBIRD
19.12.1 COMPANY SNAPSHOT
19.12.2 REVENUE ANALYSIS
19.12.3 PRODUCT PORTFOLIO
19.12.4 RECENT DEVELOPMENT
19.13 LUZITIN
19.13.1 COMPANY SNAPSHOT
19.13.2 PRODUCT PORTFOLIO
19.13.3 RECENT DEVELOPMENT
19.14 MCKESSON
19.14.1 COMPANY SNAPSHOT
19.14.2 REVENUE ANALYSIS
19.14.3 PRODUCT PORTFOLIO
19.14.4 RECENT DEVELOPMENTS
19.15 MODULIGHT CORPORATION
19.15.1 COMPANY SNAPSHOT
19.15.2 REVENUE ANALYSIS
19.15.3 PRODUCT PORTFOLIO
19.15.4 RECENT DEVELOPMENT
19.16 ONCOLUX INC (FORMERLY LUMEDA INC.)
19.16.1 COMPANY SNAPSHOT
19.16.2 PRODUCT PORTFOLIO
19.16.3 RECENT DEVELOPMENT
19.17 SUN PHARMACEUTICAL INDUSTRIES LTD
19.17.1 COMPANY SNAPSHOT
19.17.2 REVENUE ANALYSIS
19.17.3 PRODUCT PORTFOLIO
19.17.4 RECENT DEVELOPMENT
19.18 THERALASE TECHNOLOGIES INC.
19.18.1 COMPANY SNAPSHOT
19.18.2 REVENUE ANALYSIS
19.18.3 PRODUCT PORTFOLIO
19.18.4 RECENT DEVELOPMENT
20 QUESTIONNAIRE
21 RELATED REPORTS
List of Table
TABLE 1 NORTH AMERICA CANCER PHOTODYNAMIC THERAPY MARKET, BY PRODUCT TYPE, 2018-2032 (USD THOUSAND)
TABLE 2 NORTH AMERICA PHOTOSENSITIZER DRUGS IN CANCER PHOTODYNAMIC THERAPY MARKET, BY REGION, 2019-2028 (USD THOUSAND)
TABLE 3 NORTH AMERICA PHOTOSENSITIZER DRUGS IN CANCER PHOTODYNAMIC THERAPY MARKET, BY CLASS, 2018-2032 (USD THOUSAND)
TABLE 4 NORTH AMERICA PHOTOSENSITIZER DRUGS IN CANCER PHOTODYNAMIC THERAPY MARKET, BY FORMULATION, 2018-2032 (USD THOUSAND)
TABLE 5 NORTH AMERICA PHOTODYNAMIC THERAPY DEVICES IN CANCER PHOTODYNAMIC THERAPY MARKET, BY REGION, 2018-2032 (USD THOUSAND)
TABLE 6 NORTH AMERICA PHOTODYNAMIC THERAPY DEVICES IN CANCER PHOTODYNAMIC THERAPY MARKET, BY TYPE, 2018-2032 (USD THOUSAND)
TABLE 7 NORTH AMERICA LIGHT DELIVERY SYSTEMS IN CANCER PHOTODYNAMIC THERAPY MARKET, BY TYPE, 2018-2032 (USD THOUSAND)
TABLE 8 NORTH AMERICA ACCESSORIES & CONSUMABLES IN CANCER PHOTODYNAMIC THERAPY MARKET, BY TYPE, 2018-2032 (USD THOUSAND)
TABLE 9 NORTH AMERICA CANCER PHOTODYNAMIC THERAPY MARKET, BY CANCER INDICATION, 2018-2032 (USD THOUSAND)
TABLE 10 NORTH AMERICA SKIN & CUTANEOUS ONCOLOGY IN CANCER PHOTODYNAMIC THERAPY MARKET, BY REGION, 2018-2032 (USD THOUSAND)
TABLE 11 NORTH AMERICA SKIN & CUTANEOUS ONCOLOGY IN CANCER PHOTODYNAMIC THERAPY MARKET, BY PRODUCT TYPE, 2018-2032 (USD THOUSAND)
TABLE 12 NORTH AMERICA SKIN & CUTANEOUS ONCOLOGY IN CANCER PHOTODYNAMIC THERAPY MARKET, BY PATIENT DEMOGRAPHICS, 2018-2032 (USD THOUSAND)
TABLE 13 NORTH AMERICA HEAD & NECK IN CANCER PHOTODYNAMIC THERAPY MARKET, BY REGION, 2018-2032 (USD THOUSAND)
TABLE 14 NORTH AMERICA HEAD & NECK IN CANCER PHOTODYNAMIC THERAPY MARKET, BY PRODUCT TYPE, 2018-2032 (USD THOUSAND)
TABLE 15 NORTH AMERICA HEAD & NECK IN CANCER PHOTODYNAMIC THERAPY MARKET, BY PATIENT DEMOGRAPHICS, 2018-2032 (USD THOUSAND)
TABLE 16 NORTH AMERICA ESOPHAGAL IN CANCER PHOTODYNAMIC THERAPY MARKET, BY REGION, 2018-2032 (USD THOUSAND)
TABLE 17 NORTH AMERICA ESOPHAGAL IN CANCER PHOTODYNAMIC THERAPY MARKET, BY PRODUCT TYPE, 2018-2032 (USD THOUSAND)
TABLE 18 NORTH AMERICA ESOPHAGAL IN CANCER PHOTODYNAMIC THERAPY MARKET, BY PATIENT DEMOGRAPHICS, 2018-2032 (USD THOUSAND)
TABLE 19 NORTH AMERICA LUNG IN CANCER PHOTODYNAMIC THERAPY MARKET, BY REGION, 2018-2032 (USD THOUSAND)
TABLE 20 NORTH AMERICA LUNG IN CANCER PHOTODYNAMIC THERAPY MARKET, BY PRODUCT TYPE, 2018-2032 (USD THOUSAND)
TABLE 21 NORTH AMERICA LUNG IN CANCER PHOTODYNAMIC THERAPY MARKET, BY PATIENT DEMOGRAPHICS, 2018-2032 (USD THOUSAND)
TABLE 22 NORTH AMERICA BLADDER IN CANCER PHOTODYNAMIC THERAPY MARKET, BY REGION, 2018-2032 (USD THOUSAND)
TABLE 23 NORTH AMERICA BLADDER IN CANCER PHOTODYNAMIC THERAPY MARKET, BY PRODUCT TYPE, 2018-2032 (USD THOUSAND)
TABLE 24 NORTH AMERICA BLADDER IN CANCER PHOTODYNAMIC THERAPY MARKET, BY PATIENT DEMOGRAPHICS, 2018-2032 (USD THOUSAND)
TABLE 25 NORTH AMERICA CERVICAL IN CANCER PHOTODYNAMIC THERAPY MARKET, BY REGION, 2018-2032 (USD THOUSAND)
TABLE 26 NORTH AMERICA CERVICAL IN CANCER PHOTODYNAMIC THERAPY MARKET, BY PRODUCT TYPE, 2018-2032 (USD THOUSAND)
TABLE 27 NORTH AMERICA CERVICAL IN CANCER PHOTODYNAMIC THERAPY MARKET, BY PATIENT DEMOGRAPHICS, 2018-2032 (USD THOUSAND)
TABLE 28 NORTH AMERICA PROSTATE IN CANCER PHOTODYNAMIC THERAPY MARKET, BY REGION, 2018-2032 (USD THOUSAND)
TABLE 29 NORTH AMERICA PROSTATE IN CANCER PHOTODYNAMIC THERAPY MARKET, BY PRODUCT TYPE, 2018-2032 (USD THOUSAND)
TABLE 30 NORTH AMERICA PROSTATE IN CANCER PHOTODYNAMIC THERAPY MARKET, BY PATIENT DEMOGRAPHICS, 2018-2032 (USD THOUSAND)
TABLE 31 NORTH AMERICA CANCER PHOTODYNAMIC THERAPY MARKET, BY THERAPY MODALITY, 2018-2032 (USD THOUSAND)
TABLE 32 NORTH AMERICA STANDALONE THERAPY IN CANCER PHOTODYNAMIC THERAPY MARKET, BY REGION, 2018-2032 (USD THOUSAND)
TABLE 33 NORTH AMERICA ADJUNCTIVE THERAPY IN CANCER PHOTODYNAMIC THERAPY MARKET, BY REGION, 2018-2032 (USD THOUSAND)
TABLE 34 NORTH AMERICA PALLIATION THERAPY IN CANCER PHOTODYNAMIC THERAPY MARKET, BY REGION, 2018-2032 (USD THOUSAND)
TABLE 35 NORTH AMERICA OTHERS IN CANCER PHOTODYNAMIC THERAPY MARKET, BY REGION, 2018-2032 (USD THOUSAND)
TABLE 36 NORTH AMERICA CANCER PHOTODYNAMIC THERAPY MARKET, BY PROCEDURE TECHNIQUE, 2018-2032 (USD THOUSAND)
TABLE 37 NORTH AMERICA EXTERNAL BEAM IN CANCER PHOTODYNAMIC THERAPY MARKET, BY REGION, 2018-2032 (USD THOUSAND)
TABLE 38 NORTH AMERICA INTRACAVITARY (ENDOSCOPIC) DELIVERY IN CANCER PHOTODYNAMIC THERAPY MARKET, BY REGION, 2018-2032 (USD THOUSAND)
TABLE 39 NORTH AMERICA INTERSTITIAL (INTERNAL) DELIVERY IN CANCER PHOTODYNAMIC THERAPY MARKET, BY REGION, 2018-2032 (USD THOUSAND)
TABLE 40 NORTH AMERICA OTHERS IN CANCER PHOTODYNAMIC THERAPY MARKET, BY REGION, 2018-2032 (USD THOUSAND)
TABLE 41 NORTH AMERICA CANCER PHOTODYNAMIC THERAPY MARKET, BY DISEASE STAGE, 2018-2032 (USD THOUSAND)
TABLE 42 NORTH AMERICA EARLY-STAGE CANCER IN CANCER PHOTODYNAMIC THERAPY MARKET, BY REGION, 2018-2032 (USD THOUSAND)
TABLE 43 NORTH AMERICA LATE-STAGE CANCER IN CANCER PHOTODYNAMIC THERAPY MARKET, BY REGION, 2018-2032 (USD THOUSAND)
TABLE 44 NORTH AMERICA CANCER PHOTODYNAMIC THERAPY MARKET, BY PATIENT DEMOGRAPHICS, 2018-2032 (USD THOUSAND)
TABLE 45 NORTH AMERICA GERIATRIC IN CANCER PHOTODYNAMIC THERAPY MARKET, BY REGION, 2018-2032 (USD THOUSAND)
TABLE 46 NORTH AMERICA ADULTS IN CANCER PHOTODYNAMIC THERAPY MARKET, BY REGION, 2018-2032 (USD THOUSAND)
TABLE 47 NORTH AMERICA PEDIATRIC IN CANCER PHOTODYNAMIC THERAPY MARKET, BY REGION, 2018-2032 (USD THOUSAND)
TABLE 48 NORTH AMERICA CANCER PHOTODYNAMIC THERAPY MARKET, BY END USER, 2018-2032 (USD THOUSAND)
TABLE 49 NORTH AMERICA HOSPITALS IN CANCER PHOTODYNAMIC THERAPY MARKET, BY REGION, 2018-2032 (USD THOUSAND)
TABLE 50 NORTH AMERICA HOSPITALS IN CANCER PHOTODYNAMIC THERAPY MARKET, BY TYPE, 2018-2032 (USD THOUSAND)
TABLE 51 NORTH AMERICA HOSPITALS IN CANCER PHOTODYNAMIC THERAPY MARKET, BY SIZE, 2018-2032 (USD THOUSAND)
TABLE 52 NORTH AMERICA DERMATOLOGY & SKIN-CANCER CLINICS IN CANCER PHOTODYNAMIC THERAPY MARKET, BY REGION, 2018-2032 (USD THOUSAND)
TABLE 53 NORTH AMERICA AMBULATORY SURGICAL CENTERS (ASCS) IN CANCER PHOTODYNAMIC THERAPY MARKET, BY REGION, 2018-2032 (USD THOUSAND)
TABLE 54 NORTH AMERICA ACADEMIC & RESEARCH INSTITUTES IN CANCER PHOTODYNAMIC THERAPY MARKET, BY REGION, 2018-2032 (USD THOUSAND)
TABLE 55 NORTH AMERICA OTHERS IN CANCER PHOTODYNAMIC THERAPY MARKET, BY REGION, 2018-2032 (USD THOUSAND)
TABLE 56 NORTH AMERICA CANCER PHOTODYNAMIC THERAPY MARKET, BY DISTRIBUTION CHANNEL, 2018-2032 (USD THOUSAND)
TABLE 57 NORTH AMERICA DIRECT TENDER IN CANCER PHOTODYNAMIC THERAPY MARKET, BY REGION, 2018-2032 (USD THOUSAND)
TABLE 58 NORTH AMERICA THIRD PARTY DISTRIBUTORS IN CANCER PHOTODYNAMIC THERAPY MARKET, BY REGION, 2018-2032 (USD THOUSAND)
TABLE 59 NORTH AMERICA ONLINE IN CANCER PHOTODYNAMIC THERAPY MARKET, BY REGION, 2018-2032 (USD THOUSAND)
TABLE 60 NORTH AMERICA OTHERS IN CANCER PHOTODYNAMIC THERAPY MARKET, BY REGION, 2018-2032 (USD THOUSAND)
TABLE 61 NORTH AMERICA CANCER PHOTODYNAMIC THERAPY MARKET, BY COUNTRY, 2018-2032 (USD THOUSAND)
TABLE 62 NORTH AMERICA CANCER PHOTODYNAMIC THERAPY MARKET, BY PRODUCT TYPE, 2018-2032 (USD THOUSAND)
TABLE 63 NORTH AMERICA PHOTOSENSITIZER DRUGS IN CANCER PHOTODYNAMIC THERAPY MARKET, BY CLASS, 2018-2032 (USD THOUSAND)
TABLE 64 NORTH AMERICA PHOTOSENSITIZER DRUGS IN CANCER PHOTODYNAMIC THERAPY MARKET, BY FORMULATION, 2018-2032 (USD THOUSAND)
TABLE 65 NORTH AMERICA PHOTODYNAMIC THERAPY DEVICES IN CANCER PHOTODYNAMIC THERAPY MARKET, BY TYPE, 2018-2032 (USD THOUSAND)
TABLE 66 NORTH AMERICA LIGHT DELIVERY SYSTEMS IN CANCER PHOTODYNAMIC THERAPY MARKET, BY TYPE, 2018-2032 (USD THOUSAND)
TABLE 67 NORTH AMERICA ACCESSORIES & CONSUMABLES IN CANCER PHOTODYNAMIC THERAPY MARKET, BY TYPE, 2018-2032 (USD THOUSAND)
TABLE 68 NORTH AMERICA CANCER PHOTODYNAMIC THERAPY MARKET, BY CANCER INDICATION, 2018-2032 (USD THOUSAND)
TABLE 69 NORTH AMERICA SKIN & CUTANEOUS ONCOLOGY IN CANCER PHOTODYNAMIC THERAPY MARKET, BY PRODUCT TYPE, 2018-2032 (USD THOUSAND)
TABLE 70 NORTH AMERICA SKIN & CUTANEOUS ONCOLOGY IN CANCER PHOTODYNAMIC THERAPY MARKET, BY PATIENT DEMOGRAPHICS, 2018-2032 (USD THOUSAND)
TABLE 71 NORTH AMERICA HEAD & NECK IN CANCER PHOTODYNAMIC THERAPY MARKET, BY PRODUCT TYPE, 2018-2032 (USD THOUSAND)
TABLE 72 NORTH AMERICA HEAD & NECK IN CANCER PHOTODYNAMIC THERAPY MARKET, BY PATIENT DEMOGRAPHICS, 2018-2032 (USD THOUSAND)
TABLE 73 NORTH AMERICA ESOPHAGAL IN CANCER PHOTODYNAMIC THERAPY MARKET, BY PRODUCT TYPE, 2018-2032 (USD THOUSAND)
TABLE 74 NORTH AMERICA ESOPHAGAL IN CANCER PHOTODYNAMIC THERAPY MARKET, BY PATIENT DEMOGRAPHICS, 2018-2032 (USD THOUSAND)
TABLE 75 NORTH AMERICA LUNG IN CANCER PHOTODYNAMIC THERAPY MARKET, BY PRODUCT TYPE, 2018-2032 (USD THOUSAND)
TABLE 76 NORTH AMERICA LUNG IN CANCER PHOTODYNAMIC THERAPY MARKET, BY PATIENT DEMOGRAPHICS, 2018-2032 (USD THOUSAND)
TABLE 77 NORTH AMERICA BLADDER IN CANCER PHOTODYNAMIC THERAPY MARKET, BY PRODUCT TYPE, 2018-2032 (USD THOUSAND)
TABLE 78 NORTH AMERICA BLADDER IN CANCER PHOTODYNAMIC THERAPY MARKET, BY PATIENT DEMOGRAPHICS, 2018-2032 (USD THOUSAND)
TABLE 79 NORTH AMERICA CERVICAL IN CANCER PHOTODYNAMIC THERAPY MARKET, BY PRODUCT TYPE, 2018-2032 (USD THOUSAND)
TABLE 80 NORTH AMERICA CERVICAL IN CANCER PHOTODYNAMIC THERAPY MARKET, BY PATIENT DEMOGRAPHICS, 2018-2032 (USD THOUSAND)
TABLE 81 NORTH AMERICA PROSTATE IN CANCER PHOTODYNAMIC THERAPY MARKET, BY PRODUCT TYPE, 2018-2032 (USD THOUSAND)
TABLE 82 NORTH AMERICA PROSTATE IN CANCER PHOTODYNAMIC THERAPY MARKET, BY PATIENT DEMOGRAPHICS, 2018-2032 (USD THOUSAND)
TABLE 83 NORTH AMERICA CANCER PHOTODYNAMIC THERAPY MARKET, BY THERAPY MODALITY, 2018-2032 (USD THOUSAND)
TABLE 84 NORTH AMERICA CANCER PHOTODYNAMIC THERAPY MARKET, BY PROCEDURE TECHNIQUE, 2018-2032 (USD THOUSAND)
TABLE 85 NORTH AMERICA CANCER PHOTODYNAMIC THERAPY MARKET, BY DISEASE STAGE, 2018-2032 (USD THOUSAND)
TABLE 86 NORTH AMERICA CANCER PHOTODYNAMIC THERAPY MARKET, BY PATIENT DEMOGRAPHICS, 2018-2032 (USD THOUSAND)
TABLE 87 NORTH AMERICA CANCER PHOTODYNAMIC THERAPY MARKET, BY END USER, 2018-2032 (USD THOUSAND)
TABLE 88 NORTH AMERICA HOSPITALS IN CANCER PHOTODYNAMIC THERAPY MARKET, BY TYPE, 2018-2032 (USD THOUSAND)
TABLE 89 NORTH AMERICA HOSPITALS IN CANCER PHOTODYNAMIC THERAPY MARKET, BY SIZE, 2018-2032 (USD THOUSAND)
TABLE 90 NORTH AMERICA CANCER PHOTODYNAMIC THERAPY MARKET, BY DISTRIBUTION CHANNEL, 2018-2032 (USD THOUSAND)
TABLE 91 U.S. CANCER PHOTODYNAMIC THERAPY MARKET, BY PRODUCT TYPE, 2018-2032 (USD THOUSAND)
TABLE 92 U.S. PHOTOSENSITIZER DRUGS IN CANCER PHOTODYNAMIC THERAPY MARKET, BY CLASS, 2018-2032 (USD THOUSAND)
TABLE 93 U.S. PHOTOSENSITIZER DRUGS IN CANCER PHOTODYNAMIC THERAPY MARKET, BY FORMULATION, 2018-2032 (USD THOUSAND)
TABLE 94 U.S. PHOTODYNAMIC THERAPY DEVICES IN CANCER PHOTODYNAMIC THERAPY MARKET, BY TYPE, 2018-2032 (USD THOUSAND)
TABLE 95 U.S. LIGHT DELIVERY SYSTEMS IN CANCER PHOTODYNAMIC THERAPY MARKET, BY TYPE, 2018-2032 (USD THOUSAND)
TABLE 96 U.S. ACCESSORIES & CONSUMABLES IN CANCER PHOTODYNAMIC THERAPY MARKET, BY TYPE, 2018-2032 (USD THOUSAND)
TABLE 97 U.S. CANCER PHOTODYNAMIC THERAPY MARKET, BY CANCER INDICATION, 2018-2032 (USD THOUSAND)
TABLE 98 U.S. SKIN & CUTANEOUS ONCOLOGY IN CANCER PHOTODYNAMIC THERAPY MARKET, BY PRODUCT TYPE, 2018-2032 (USD THOUSAND)
TABLE 99 U.S. SKIN & CUTANEOUS ONCOLOGY IN CANCER PHOTODYNAMIC THERAPY MARKET, BY PATIENT DEMOGRAPHICS, 2018-2032 (USD THOUSAND)
TABLE 100 U.S. HEAD & NECK IN CANCER PHOTODYNAMIC THERAPY MARKET, BY PRODUCT TYPE, 2018-2032 (USD THOUSAND)
TABLE 101 U.S. HEAD & NECK IN CANCER PHOTODYNAMIC THERAPY MARKET, BY PATIENT DEMOGRAPHICS, 2018-2032 (USD THOUSAND)
TABLE 102 U.S. ESOPHAGAL IN CANCER PHOTODYNAMIC THERAPY MARKET, BY PRODUCT TYPE, 2018-2032 (USD THOUSAND)
TABLE 103 U.S. ESOPHAGAL IN CANCER PHOTODYNAMIC THERAPY MARKET, BY PATIENT DEMOGRAPHICS, 2018-2032 (USD THOUSAND)
TABLE 104 U.S. LUNG IN CANCER PHOTODYNAMIC THERAPY MARKET, BY PRODUCT TYPE, 2018-2032 (USD THOUSAND)
TABLE 105 U.S. LUNG IN CANCER PHOTODYNAMIC THERAPY MARKET, BY PATIENT DEMOGRAPHICS, 2018-2032 (USD THOUSAND)
TABLE 106 U.S. BLADDER IN CANCER PHOTODYNAMIC THERAPY MARKET, BY PRODUCT TYPE, 2018-2032 (USD THOUSAND)
TABLE 107 U.S. BLADDER IN CANCER PHOTODYNAMIC THERAPY MARKET, BY PATIENT DEMOGRAPHICS, 2018-2032 (USD THOUSAND)
TABLE 108 U.S. CERVICAL IN CANCER PHOTODYNAMIC THERAPY MARKET, BY PRODUCT TYPE, 2018-2032 (USD THOUSAND)
TABLE 109 U.S. CERVICAL IN CANCER PHOTODYNAMIC THERAPY MARKET, BY PATIENT DEMOGRAPHICS, 2018-2032 (USD THOUSAND)
TABLE 110 U.S. PROSTATE IN CANCER PHOTODYNAMIC THERAPY MARKET, BY PRODUCT TYPE, 2018-2032 (USD THOUSAND)
TABLE 111 U.S. PROSTATE IN CANCER PHOTODYNAMIC THERAPY MARKET, BY PATIENT DEMOGRAPHICS, 2018-2032 (USD THOUSAND)
TABLE 112 U.S. CANCER PHOTODYNAMIC THERAPY MARKET, BY THERAPY MODALITY, 2018-2032 (USD THOUSAND)
TABLE 113 U.S. CANCER PHOTODYNAMIC THERAPY MARKET, BY PROCEDURE TECHNIQUE, 2018-2032 (USD THOUSAND)
TABLE 114 U.S. CANCER PHOTODYNAMIC THERAPY MARKET, BY DISEASE STAGE, 2018-2032 (USD THOUSAND)
TABLE 115 U.S. CANCER PHOTODYNAMIC THERAPY MARKET, BY PATIENT DEMOGRAPHICS, 2018-2032 (USD THOUSAND)
TABLE 116 U.S. CANCER PHOTODYNAMIC THERAPY MARKET, BY END USER, 2018-2032 (USD THOUSAND)
TABLE 117 U.S. HOSPITALS IN CANCER PHOTODYNAMIC THERAPY MARKET, BY TYPE, 2018-2032 (USD THOUSAND)
TABLE 118 U.S. HOSPITALS IN CANCER PHOTODYNAMIC THERAPY MARKET, BY SIZE, 2018-2032 (USD THOUSAND)
TABLE 119 U.S. CANCER PHOTODYNAMIC THERAPY MARKET, BY DISTRIBUTION CHANNEL, 2018-2032 (USD THOUSAND)
TABLE 120 CANADA CANCER PHOTODYNAMIC THERAPY MARKET, BY PRODUCT TYPE, 2018-2032 (USD THOUSAND)
TABLE 121 CANADA PHOTOSENSITIZER DRUGS IN CANCER PHOTODYNAMIC THERAPY MARKET, BY CLASS, 2018-2032 (USD THOUSAND)
TABLE 122 CANADA PHOTOSENSITIZER DRUGS IN CANCER PHOTODYNAMIC THERAPY MARKET, BY FORMULATION, 2018-2032 (USD THOUSAND)
TABLE 123 CANADA PHOTODYNAMIC THERAPY DEVICES IN CANCER PHOTODYNAMIC THERAPY MARKET, BY TYPE, 2018-2032 (USD THOUSAND)
TABLE 124 CANADA LIGHT DELIVERY SYSTEMS IN CANCER PHOTODYNAMIC THERAPY MARKET, BY TYPE, 2018-2032 (USD THOUSAND)
TABLE 125 CANADA ACCESSORIES & CONSUMABLES IN CANCER PHOTODYNAMIC THERAPY MARKET, BY TYPE, 2018-2032 (USD THOUSAND)
TABLE 126 CANADA CANCER PHOTODYNAMIC THERAPY MARKET, BY CANCER INDICATION, 2018-2032 (USD THOUSAND)
TABLE 127 CANADA SKIN & CUTANEOUS ONCOLOGY IN CANCER PHOTODYNAMIC THERAPY MARKET, BY PRODUCT TYPE, 2018-2032 (USD THOUSAND)
TABLE 128 CANADA SKIN & CUTANEOUS ONCOLOGY IN CANCER PHOTODYNAMIC THERAPY MARKET, BY PATIENT DEMOGRAPHICS, 2018-2032 (USD THOUSAND)
TABLE 129 CANADA HEAD & NECK IN CANCER PHOTODYNAMIC THERAPY MARKET, BY PRODUCT TYPE, 2018-2032 (USD THOUSAND)
TABLE 130 CANADA HEAD & NECK IN CANCER PHOTODYNAMIC THERAPY MARKET, BY PATIENT DEMOGRAPHICS, 2018-2032 (USD THOUSAND)
TABLE 131 CANADA ESOPHAGAL IN CANCER PHOTODYNAMIC THERAPY MARKET, BY PRODUCT TYPE, 2018-2032 (USD THOUSAND)
TABLE 132 CANADA ESOPHAGAL IN CANCER PHOTODYNAMIC THERAPY MARKET, BY PATIENT DEMOGRAPHICS, 2018-2032 (USD THOUSAND)
TABLE 133 CANADA LUNG IN CANCER PHOTODYNAMIC THERAPY MARKET, BY PRODUCT TYPE, 2018-2032 (USD THOUSAND)
TABLE 134 CANADA LUNG IN CANCER PHOTODYNAMIC THERAPY MARKET, BY PATIENT DEMOGRAPHICS, 2018-2032 (USD THOUSAND)
TABLE 135 CANADA BLADDER IN CANCER PHOTODYNAMIC THERAPY MARKET, BY PRODUCT TYPE, 2018-2032 (USD THOUSAND)
TABLE 136 CANADA BLADDER IN CANCER PHOTODYNAMIC THERAPY MARKET, BY PATIENT DEMOGRAPHICS, 2018-2032 (USD THOUSAND)
TABLE 137 CANADA CERVICAL IN CANCER PHOTODYNAMIC THERAPY MARKET, BY PRODUCT TYPE, 2018-2032 (USD THOUSAND)
TABLE 138 CANADA CERVICAL IN CANCER PHOTODYNAMIC THERAPY MARKET, BY PATIENT DEMOGRAPHICS, 2018-2032 (USD THOUSAND)
TABLE 139 CANADA PROSTATE IN CANCER PHOTODYNAMIC THERAPY MARKET, BY PRODUCT TYPE, 2018-2032 (USD THOUSAND)
TABLE 140 CANADA PROSTATE IN CANCER PHOTODYNAMIC THERAPY MARKET, BY PATIENT DEMOGRAPHICS, 2018-2032 (USD THOUSAND)
TABLE 141 CANADA CANCER PHOTODYNAMIC THERAPY MARKET, BY THERAPY MODALITY, 2018-2032 (USD THOUSAND)
TABLE 142 CANADA CANCER PHOTODYNAMIC THERAPY MARKET, BY PROCEDURE TECHNIQUE, 2018-2032 (USD THOUSAND)
TABLE 143 CANADA CANCER PHOTODYNAMIC THERAPY MARKET, BY DISEASE STAGE, 2018-2032 (USD THOUSAND)
TABLE 144 CANADA CANCER PHOTODYNAMIC THERAPY MARKET, BY PATIENT DEMOGRAPHICS, 2018-2032 (USD THOUSAND)
TABLE 145 CANADA CANCER PHOTODYNAMIC THERAPY MARKET, BY END USER, 2018-2032 (USD THOUSAND)
TABLE 146 CANADA HOSPITALS IN CANCER PHOTODYNAMIC THERAPY MARKET, BY TYPE, 2018-2032 (USD THOUSAND)
TABLE 147 CANADA HOSPITALS IN CANCER PHOTODYNAMIC THERAPY MARKET, BY SIZE, 2018-2032 (USD THOUSAND)
TABLE 148 CANADA CANCER PHOTODYNAMIC THERAPY MARKET, BY DISTRIBUTION CHANNEL, 2018-2032 (USD THOUSAND)
TABLE 149 MEXICO CANCER PHOTODYNAMIC THERAPY MARKET, BY PRODUCT TYPE, 2018-2032 (USD THOUSAND)
TABLE 150 MEXICO PHOTOSENSITIZER DRUGS IN CANCER PHOTODYNAMIC THERAPY MARKET, BY CLASS, 2018-2032 (USD THOUSAND)
TABLE 151 MEXICO PHOTOSENSITIZER DRUGS IN CANCER PHOTODYNAMIC THERAPY MARKET, BY FORMULATION, 2018-2032 (USD THOUSAND)
TABLE 152 MEXICO PHOTODYNAMIC THERAPY DEVICES IN CANCER PHOTODYNAMIC THERAPY MARKET, BY TYPE, 2018-2032 (USD THOUSAND)
TABLE 153 MEXICO LIGHT DELIVERY SYSTEMS IN CANCER PHOTODYNAMIC THERAPY MARKET, BY TYPE, 2018-2032 (USD THOUSAND)
TABLE 154 MEXICO ACCESSORIES & CONSUMABLES IN CANCER PHOTODYNAMIC THERAPY MARKET, BY TYPE, 2018-2032 (USD THOUSAND)
TABLE 155 MEXICO CANCER PHOTODYNAMIC THERAPY MARKET, BY CANCER INDICATION, 2018-2032 (USD THOUSAND)
TABLE 156 MEXICO SKIN & CUTANEOUS ONCOLOGY IN CANCER PHOTODYNAMIC THERAPY MARKET, BY PRODUCT TYPE, 2018-2032 (USD THOUSAND)
TABLE 157 MEXICO SKIN & CUTANEOUS ONCOLOGY IN CANCER PHOTODYNAMIC THERAPY MARKET, BY PATIENT DEMOGRAPHICS, 2018-2032 (USD THOUSAND)
TABLE 158 MEXICO HEAD & NECK IN CANCER PHOTODYNAMIC THERAPY MARKET, BY PRODUCT TYPE, 2018-2032 (USD THOUSAND)
TABLE 159 MEXICO HEAD & NECK IN CANCER PHOTODYNAMIC THERAPY MARKET, BY PATIENT DEMOGRAPHICS, 2018-2032 (USD THOUSAND)
TABLE 160 MEXICO ESOPHAGAL IN CANCER PHOTODYNAMIC THERAPY MARKET, BY PRODUCT TYPE, 2018-2032 (USD THOUSAND)
TABLE 161 MEXICO ESOPHAGAL IN CANCER PHOTODYNAMIC THERAPY MARKET, BY PATIENT DEMOGRAPHICS, 2018-2032 (USD THOUSAND)
TABLE 162 MEXICO LUNG IN CANCER PHOTODYNAMIC THERAPY MARKET, BY PRODUCT TYPE, 2018-2032 (USD THOUSAND)
TABLE 163 MEXICO LUNG IN CANCER PHOTODYNAMIC THERAPY MARKET, BY PATIENT DEMOGRAPHICS, 2018-2032 (USD THOUSAND)
TABLE 164 MEXICO BLADDER IN CANCER PHOTODYNAMIC THERAPY MARKET, BY PRODUCT TYPE, 2018-2032 (USD THOUSAND)
TABLE 165 MEXICO BLADDER IN CANCER PHOTODYNAMIC THERAPY MARKET, BY PATIENT DEMOGRAPHICS, 2018-2032 (USD THOUSAND)
TABLE 166 MEXICO CERVICAL IN CANCER PHOTODYNAMIC THERAPY MARKET, BY PRODUCT TYPE, 2018-2032 (USD THOUSAND)
TABLE 167 MEXICO CERVICAL IN CANCER PHOTODYNAMIC THERAPY MARKET, BY PATIENT DEMOGRAPHICS, 2018-2032 (USD THOUSAND)
TABLE 168 MEXICO PROSTATE IN CANCER PHOTODYNAMIC THERAPY MARKET, BY PRODUCT TYPE, 2018-2032 (USD THOUSAND)
TABLE 169 MEXICO PROSTATE IN CANCER PHOTODYNAMIC THERAPY MARKET, BY PATIENT DEMOGRAPHICS, 2018-2032 (USD THOUSAND)
TABLE 170 MEXICO CANCER PHOTODYNAMIC THERAPY MARKET, BY THERAPY MODALITY, 2018-2032 (USD THOUSAND)
TABLE 171 MEXICO CANCER PHOTODYNAMIC THERAPY MARKET, BY PROCEDURE TECHNIQUE, 2018-2032 (USD THOUSAND)
TABLE 172 MEXICO CANCER PHOTODYNAMIC THERAPY MARKET, BY DISEASE STAGE, 2018-2032 (USD THOUSAND)
TABLE 173 MEXICO CANCER PHOTODYNAMIC THERAPY MARKET, BY PATIENT DEMOGRAPHICS, 2018-2032 (USD THOUSAND)
TABLE 174 MEXICO CANCER PHOTODYNAMIC THERAPY MARKET, BY END USER, 2018-2032 (USD THOUSAND)
TABLE 175 MEXICO HOSPITALS IN CANCER PHOTODYNAMIC THERAPY MARKET, BY TYPE, 2018-2032 (USD THOUSAND)
TABLE 176 MEXICO HOSPITALS IN CANCER PHOTODYNAMIC THERAPY MARKET, BY SIZE, 2018-2032 (USD THOUSAND)
TABLE 177 MEXICO CANCER PHOTODYNAMIC THERAPY MARKET, BY DISTRIBUTION CHANNEL, 2018-2032 (USD THOUSAND)
List of Figure
FIGURE 1 NORTH AMERICA CANCER PHOTODYNAMIC THERAPY MARKET: SEGMENTATION
FIGURE 2 NORTH AMERICA CANCER PHOTODYNAMIC THERAPY MARKET: DATA TRIANGULATION
FIGURE 3 NORTH AMERICA CANCER PHOTODYNAMIC THERAPY MARKET: DROC ANALYSIS
FIGURE 4 NORTH AMERICA CANCER PHOTODYNAMIC THERAPY MARKET: NORTH AMERICA VS REGIONAL ANALYSIS
FIGURE 5 NORTH AMERICA CANCER PHOTODYNAMIC THERAPY MARKET: COMPANY RESEARCH ANALYSIS
FIGURE 6 NORTH AMERICA CANCER PHOTODYNAMIC THERAPY MARKET: INTERVIEW DEMOGRAPHICS
FIGURE 7 NORTH AMERICA CANCER PHOTODYNAMIC THERAPY MARKET: DBMR MARKET POSITION GRID
FIGURE 8 NORTH AMERICA CANCER PHOTODYNAMIC THERAPY MARKET: MARKET END USER COVERAGE GRID
FIGURE 9 NORTH AMERICA CANCER PHOTODYNAMIC THERAPY MARKET: SEGMENTATION
FIGURE 10 EXECUTIVE SUMMARY
FIGURE 11 STRATEGIC DECISIONS
FIGURE 12 TWO SEGMENTS COMPRISE THE NORTH AMERICA CANCER PHOTODYNAMIC THERAPY MARKET, BY PRODUCT TYPE (2024)
FIGURE 13 INCREASING PREVALENCE OF CANCER ACROSS GLOBE EXPECTED TO DRIVE THE NORTH AMERICA CANCER PHOTODYNAMIC THERAPY MARKET IN THE FORECAST PERIOD OF 2025 TO 2032
FIGURE 14 PHOTOSENSITIZER DRUGS SEGMENT IS EXPECTED TO ACCOUNT FOR THE LARGEST SHARE OF THE NORTH AMERICA CANCER PHOTODYNAMIC THERAPY MARKET IN 2025 & 2032
FIGURE 15 NORTH AMERICA CANCER PHOTODYNAMIC THERAPY MARKET-MARKET OVERVIEW
FIGURE 16 NORTH AMERICA CANCER PHOTODYNAMIC THERAPY MARKET, BY PRODUCT TYPE, 2024
FIGURE 17 NORTH AMERICA CANCER PHOTODYNAMIC THERAPY MARKET, BY PRODUCT TYPE, 2024
FIGURE 18 NORTH AMERICA CANCER PHOTODYNAMIC THERAPY MARKET, BY PRODUCT TYPE, 2018-2032
FIGURE 19 NORTH AMERICA CANCER PHOTODYNAMIC THERAPY MARKET, BY PRODUCT TYPE, 2018-2032
FIGURE 20 NORTH AMERICA CANCER PHOTODYNAMIC THERAPY MARKET, BY CANCER INDICATION, 2024
FIGURE 21 NORTH AMERICA CANCER PHOTODYNAMIC THERAPY MARKET, BY CANCER INDICATION, 2024
FIGURE 22 NORTH AMERICA CANCER PHOTODYNAMIC THERAPY MARKET, BY CANCER INDICATION, 2018-2032
FIGURE 23 NORTH AMERICA CANCER PHOTODYNAMIC THERAPY MARKET, BY CANCER INDICATION, 2018-2032
FIGURE 24 NORTH AMERICA CANCER PHOTODYNAMIC THERAPY MARKET, BY THERAPY MODALITY, 2024
FIGURE 25 NORTH AMERICA CANCER PHOTODYNAMIC THERAPY MARKET, BY THERAPY MODALITY, 2024
FIGURE 26 NORTH AMERICA CANCER PHOTODYNAMIC THERAPY MARKET, BY THERAPY MODALITY, 2018-2032
FIGURE 27 NORTH AMERICA CANCER PHOTODYNAMIC THERAPY MARKET, BY THERAPY MODALITY, 2018-2032
FIGURE 28 NORTH AMERICA CANCER PHOTODYNAMIC THERAPY MARKET, BY PROCEDURE TECHNIQUE, 2024
FIGURE 29 NORTH AMERICA CANCER PHOTODYNAMIC THERAPY MARKET, BY PROCEDURE TECHNIQUE, 2024
FIGURE 30 NORTH AMERICA CANCER PHOTODYNAMIC THERAPY MARKET, BY PROCEDURE TECHNIQUE, 2018-2032
FIGURE 31 NORTH AMERICA CANCER PHOTODYNAMIC THERAPY MARKET, BY PROCEDURE TECHNIQUE, 2018-2032
FIGURE 32 NORTH AMERICA CANCER PHOTODYNAMIC THERAPY MARKET, BY DISEASE STAGE, 2024
FIGURE 33 NORTH AMERICA CANCER PHOTODYNAMIC THERAPY MARKET, BY DISEASE STAGE, 2024
FIGURE 34 NORTH AMERICA CANCER PHOTODYNAMIC THERAPY MARKET, BY DISEASE STAGE, 2018-2032
FIGURE 35 NORTH AMERICA CANCER PHOTODYNAMIC THERAPY MARKET, BY DISEASE STAGE, 2018-2032
FIGURE 36 NORTH AMERICA CANCER PHOTODYNAMIC THERAPY MARKET, BY PATIENT DEMOGRAPHICS, 2024
FIGURE 37 NORTH AMERICA CANCER PHOTODYNAMIC THERAPY MARKET, BY PATIENT DEMOGRAPHICS, 2018-2032
FIGURE 38 NORTH AMERICA CANCER PHOTODYNAMIC THERAPY MARKET, BY PATIENT DEMOGRAPHICS, 2018-2032
FIGURE 39 NORTH AMERICA CANCER PHOTODYNAMIC THERAPY MARKET, BY PATIENT DEMOGRAPHICS, 2018-2032
FIGURE 40 NORTH AMERICA CANCER PHOTODYNAMIC THERAPY MARKET, BY END USER, 2024
FIGURE 41 NORTH AMERICA CANCER PHOTODYNAMIC THERAPY MARKET, BY END USER, 2024
FIGURE 42 NORTH AMERICA CANCER PHOTODYNAMIC THERAPY MARKET, BY END USER, 2018-2032
FIGURE 43 NORTH AMERICA CANCER PHOTODYNAMIC THERAPY MARKET, BY END USER, 2018-2032
FIGURE 44 NORTH AMERICA CANCER PHOTODYNAMIC THERAPY MARKET, BY DISTRIBUTION CHANNEL, 2024
FIGURE 45 NORTH AMERICA CANCER PHOTODYNAMIC THERAPY MARKET, BY DISTRIBUTION CHANNEL, 2024
FIGURE 46 NORTH AMERICA CANCER PHOTODYNAMIC THERAPY MARKET, BY DISTRIBUTION CHANNEL, 2018-2032
FIGURE 47 NORTH AMERICA CANCER PHOTODYNAMIC THERAPY MARKET, BY DISTRIBUTION CHANNEL, 2018-2032
FIGURE 48 NORTH AMERICA CANCER PHOTODYNAMIC THERAPY MARKET: SNAPSHOT (2024)
FIGURE 49 NORTH AMERICA CANCER PHOTODYNAMIC THERAPY MARKET: COMPANY SHARE 2024 (%)
Data collection and base year analysis are done using data collection modules with large sample sizes. The stage includes obtaining market information or related data through various sources and strategies. It includes examining and planning all the data acquired from the past in advance. It likewise envelops the examination of information inconsistencies seen across different information sources. The market data is analysed and estimated using market statistical and coherent models. Also, market share analysis and key trend analysis are the major success factors in the market report. To know more, please request an analyst call or drop down your inquiry.
The key research methodology used by DBMR research team is data triangulation which involves data mining, analysis of the impact of data variables on the market and primary (industry expert) validation. Data models include Vendor Positioning Grid, Market Time Line Analysis, Market Overview and Guide, Company Positioning Grid, Patent Analysis, Pricing Analysis, Company Market Share Analysis, Standards of Measurement, Global versus Regional and Vendor Share Analysis. To know more about the research methodology, drop in an inquiry to speak to our industry experts.
Data Bridge Market Research is a leader in advanced formative research. We take pride in servicing our existing and new customers with data and analysis that match and suits their goal. The report can be customized to include price trend analysis of target brands understanding the market for additional countries (ask for the list of countries), clinical trial results data, literature review, refurbished market and product base analysis. Market analysis of target competitors can be analyzed from technology-based analysis to market portfolio strategies. We can add as many competitors that you require data about in the format and data style you are looking for. Our team of analysts can also provide you data in crude raw excel files pivot tables (Fact book) or can assist you in creating presentations from the data sets available in the report.


