
North America Car T Cell Therapy Treatment Market
Market Size in USD Billion
 USD
1.99 Billion
USD
16.13 Billion
2024
2032
USD
1.99 Billion
USD
16.13 Billion
2024
2032
| 2025 - 2032 | |
| USD 1.99 Billion | |
| USD 16.13 Billion | |
| % | |
|
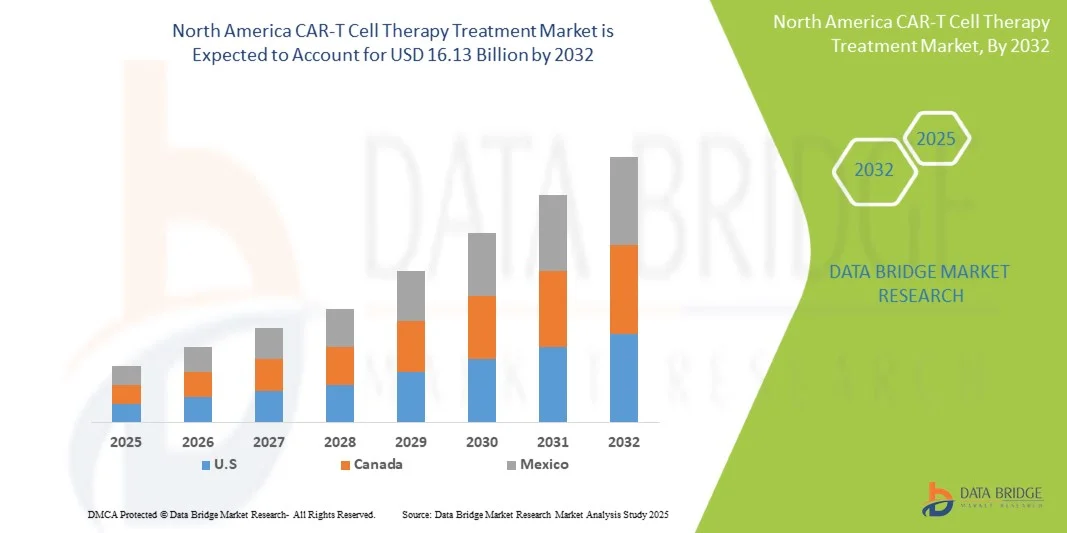
North America CAR-T Cell Therapy Treatment Market Size
- The North America CAR-T Cell Therapy Treatment Market size was valued at USD 1.99 billion in 2024 and is expected to reach USD 16.13 billion by 2032, at a CAGR of 29.90% during the forecast period
- The market growth is largely fueled by the increasing prevalence of hematologic malignancies and other cancers, coupled with the rapid advancements in cellular immunotherapy technologies, leading to broader adoption of CAR-T cell therapies in clinical practice
- Furthermore, rising patient demand for personalized, targeted, and effective treatment options is driving the uptake of CAR-T Cell Therapy solutions, thereby significantly boosting the industry's growth
North America CAR-T Cell Therapy Treatment Market Analysis
- CAR-T Cell Therapy, offering personalized and targeted cellular immunotherapy for cancer treatment, is increasingly becoming a vital component of modern oncology care in both hospitals and specialized clinics due to its high efficacy and potential for long-term remission
- The escalating demand for CAR-T Cell Therapy is primarily fueled by rising cancer prevalence, advances in immunotherapy research, and increasing patient preference for innovative, precision-based treatment solutions
- The U.S. dominated the North America CAR-T Cell Therapy Treatment Market with the largest revenue share of 42.3% in 2024, driven by robust investments in advanced cancer therapies, strong support from the U.S. Food and Drug Administration (FDA) for accelerated approvals, and the presence of leading biopharmaceutical companies pioneering CAR-T innovations. The country’s extensive clinical trial network and expanding patient access programs have further strengthened its leadership position in the market
- Canada is expected to be the fastest-growing country in the North America CAR-T Cell Therapy Treatment Market during the forecast period, fueled by increasing adoption of personalized oncology treatments, growing investments in biotechnology research, and favorable government initiatives supporting cell and gene therapy development. The rising number of specialized treatment centers and expanding partnerships between hospitals and research institutes are further propelling the growth of the CAR-T cell therapy sector in Canada.
- The Hematological Malignancies segment dominated with 69.7% revenue share in 2024, owing to early approvals, high prevalence, and strong clinical outcomes. Hospitals and specialty clinics provide centralized therapy and monitoring
Report Scope and North America CAR-T Cell Therapy Treatment Market Segmentation
|
Attributes |
CAR-T Cell Therapy Treatment Key Market Insights |
|
Segments Covered |
|
|
Countries Covered |
North America
|
|
Key Market Players |
|
|
Market Opportunities |
|
|
Value Added Data Infosets |
In addition to the insights on market scenarios such as market value, growth rate, segmentation, geographical coverage, and major players, the market reports curated by the Data Bridge Market Research also include in-depth expert analysis, patient epidemiology, pipeline analysis, pricing analysis, and regulatory framework. |
North America CAR-T Cell Therapy Treatment Market Trends
“Enhanced Convenience Through Advanced Therapy Platforms”
- A significant and accelerating trend in the North America CAR-T Cell Therapy Treatment Market is the deepening integration of advanced therapy platforms with digital health solutions and AI-assisted monitoring systems. These technologies are enhancing clinical decision-making, patient monitoring, and personalized treatment planning for CAR-T therapies
- For instance, hospital-based CAR-T platforms are increasingly equipped with AI-driven patient tracking, enabling clinicians to monitor cytokine release, immune response, and therapy-related adverse events in real time. Similarly, automated therapy management systems can optimize dosing schedules and cell infusion protocols
- AI integration in CAR-T therapy enables features such as predicting patient response, optimizing manufacturing timelines for autologous and allogeneic CAR-T cells, and providing early alerts for potential toxicities. This data-driven approach enhances treatment safety and efficacy
- The seamless integration of CAR-T treatment platforms with hospital electronic medical records (EMR) facilitates centralized management of therapy workflows, patient history, and follow-up schedules. Through a unified interface, clinicians can coordinate pre-treatment conditioning, infusion, and post-infusion care efficiently
- This trend towards more intelligent, data-driven, and interconnected CAR-T platforms is fundamentally reshaping expectations for oncology treatment outcomes. Consequently, companies such as Novartis, Gilead, and Bristol Myers Squibb are developing platforms with AI-enabled monitoring, real-time analytics, and therapy optimization features
- The demand for CAR-T therapies with enhanced platform integration is growing rapidly across hospitals and specialty oncology centers, as patients and healthcare providers increasingly prioritize safety, efficacy, and treatment personalization
North America CAR-T Cell Therapy Treatment Market Dynamics
Driver
“Growing Need Due to Rising Cancer Prevalence and Advanced Therapy Adoption
- The increasing prevalence of hematologic malignancies and solid tumors, coupled with rising adoption of advanced immunotherapies, is a significant driver for the heightened demand for CAR-T cell therapies
- For instance, in 2024, multiple CAR-T products received expanded indications for diffuse large B-cell lymphoma, multiple myeloma, and acute lymphoblastic leukemia, enabling broader clinical adoption. Such regulatory approvals are expected to drive market growth during the forecast period
- As healthcare providers seek more effective and durable treatment options, CAR-T therapies offer personalized, targeted approaches that can produce long-term remission in refractory or relapsed cancer patients
- Furthermore, increasing investments in CAR-T manufacturing infrastructure, expansion of clinical trial programs, and improved supply chain logistics are making these therapies more accessible to patients worldwide
- The combination of patient awareness programs, expanded reimbursement coverage, and specialized treatment centers capable of delivering CAR-T therapy is further propelling market adoption. Advanced therapy platforms that support scalable production and personalized treatment planning are key growth enablers
Restraint/Challenge
“Concerns Regarding Safety, Complex Manufacturing, and High Therapy Costs”
- Concerns surrounding severe adverse events such as cytokine release syndrome (CRS) and neurotoxicity pose significant challenges to broader market penetration. Continuous monitoring and management are critical to mitigate therapy-related risks
- The complex and time-intensive manufacturing process of autologous CAR-T cells, which involves personalized cell collection, genetic modification, and reinfusion, can limit treatment scalability and accessibility
- Addressing these challenges through standardized protocols, improved safety management, and automation in manufacturing is crucial for increasing patient access and clinical adoption
- The high cost of CAR-T therapy, often exceeding several hundred thousand dollars per treatment, remains a barrier for patients in emerging markets or those without comprehensive insurance coverage. Cost-containment strategies and reimbursement expansions are required to enhance affordability
- In addition, regulatory complexities for therapy approval, quality control, and post-marketing surveillance can slow market growth. Harmonization of guidelines across countries is essential to streamline global adoption
- Overcoming these challenges through technological innovation, enhanced safety protocols, and patient support programs will be vital for sustained growth in the North America CAR-T Cell Therapy Treatment Market
North America CAR-T Cell Therapy Treatment Market Scope
The market is segmented on the basis of product, structure, targeted antigens, brand, therapeutic application, end user, and distribution channel.
• By Product
On the basis of product, the North America CAR-T Cell Therapy Treatment Market is segmented into Autologous CAR-T Cells and Allogeneic CAR-T Cells. The Autologous CAR-T Cells segment dominated the market with the largest revenue share of 62.5% in 2024, due to its personalized approach, which minimizes graft-versus-host disease risks and maximizes therapeutic efficacy. Hospitals and specialty clinics widely use autologous CAR-T therapy for hematologic malignancies, offering optimized patient outcomes. Regulatory approvals in key markets such as the U.S., Germany, and China support consistent adoption. High clinical evidence, long-term patient response data, and established manufacturing protocols strengthen its market position. Reimbursement support, patient awareness, and advanced cell processing technologies also drive growth. Continuous R&D, clinical trial expansions, and physician education programs enhance its clinical adoption. Availability of combination therapies with autologous CAR-T further consolidates market dominance.
The Allogeneic CAR-T Cells segment is projected to grow at the fastest CAGR of 14.2% from 2025 to 2032, fueled by off-the-shelf therapies that allow immediate administration. These products reduce manufacturing time and cost, improving patient accessibility. Advances in gene editing and universal donor cell technologies enhance safety and scalability. Clinical trials targeting hematologic and solid tumors are accelerating development. Strategic collaborations between biotech firms and CMOs are expanding production capacity. The off-the-shelf approach addresses unmet medical needs and broadens treatment coverage. Investment in safety and efficacy improvements drives market adoption. Regulatory progress in multiple regions encourages faster approvals. Partnerships with hospitals and specialty centers enhance distribution and awareness. The increasing patient pool in emerging markets also supports rapid growth.
• By Structure
On the basis of structure, the market is segmented into First Generation, Second Generation, Third Generation, and Fourth Generation CAR-T Cells. The Second Generation CAR-T Cells segment dominated with a 55.8% revenue share in 2024, thanks to co-stimulatory domains that improve T-cell persistence and cytotoxic activity. Most commercially approved CAR-T products belong to this generation. Hospitals and specialty clinics adopt these therapies widely due to proven efficacy and safety. Strong clinical trial evidence, regulatory approvals, and reimbursement coverage reinforce its position. Advanced manufacturing standards ensure high-quality delivery. The segment benefits from optimized combination therapy options. Continuous innovation in gene modification and T-cell expansion supports clinical adoption. Patient outcomes and long-term survival data consolidate market dominance. Global awareness campaigns and medical education programs enhance physician adoption. Partnerships with research institutions further strengthen market leadership.
The Third Generation CAR-T Cells segment is expected to grow at the fastest CAGR of 12.5% from 2025 to 2032, driven by multi-co-stimulatory designs enhancing antitumor activity. Their potential application in both hematologic and solid tumors is fueling research interest. Early clinical data shows promising results. Biotech collaborations and academic partnerships are accelerating development. Third-generation CAR-T therapies offer improved persistence, reduced relapse risk, and enhanced safety profiles. Funding for immunotherapy research supports segment expansion. Hospitals and specialty clinics are gradually adopting these advanced products. Regulatory guidance is becoming more supportive. Patient and physician awareness of new CAR-T innovations drives demand. Increased focus on personalized medicine fuels rapid uptake. Market penetration in emerging regions is expanding.
• By Targeted Antigens
On the basis of targeted antigens, the market is segmented into Antigens on Solid Tumors, Antigens on Hematologic Malignancies, and Others. The Hematologic Malignancies segment dominated with 67.3% revenue share in 2024, as CAR-T therapies were first approved and widely adopted for B-cell malignancies like DLBCL, ALL, and multiple myeloma. Strong clinical outcomes, hospital adoption, and regulatory support drive dominance. Reimbursement coverage ensures patient access. Extensive clinical trial data validates efficacy and safety. Specialized treatment centers ensure optimal therapy management. Physician education and awareness contribute to adoption. Hospitals and specialty clinics are the main administration sites. Long-term survival data strengthens market confidence. Patient demand is increasing. Global treatment guidelines recommend CAR-T for eligible patients. Continuous R&D supports expansion.
The Solid Tumors segment is projected to grow at the fastest CAGR of 13.8% from 2025 to 2032, fueled by clinical trials targeting HER2, EGFR, mesothelin, and other solid tumor antigens. Advances in tumor microenvironment modulation improve response rates. Immune checkpoint combinations are under investigation. Investment in research and development is increasing globally. Hospitals and specialty clinics are expanding trial participation. Novel CAR-T constructs show promising safety and efficacy. Collaboration between biotech firms and academic institutions accelerates growth. Patient demand for innovative therapies is rising. Regulatory flexibility in oncology encourages trial expansion. Awareness programs for clinicians and patients are promoting adoption. Technological innovations in gene editing enhance solid tumor targeting. Market penetration in emerging regions supports rapid growth.
• By Brand
On the basis of brand, the market is segmented into Yescarta, Kymriah, Tecartus, and Others. The Yescarta segment dominated with 38.4% revenue share in 2024, due to early approval for DLBCL and widespread hospital adoption. Its strong safety profile, robust clinical efficacy, and structured patient support programs reinforce dominance. Reimbursement coverage, physician education, and patient awareness boost adoption. Hospitals and specialty clinics implement standardized protocols. Manufacturing capabilities ensure reliable product supply. Ongoing post-marketing studies enhance confidence. Global partnerships with medical centers increase reach. Patient outcomes are favorable. Continuous innovation and combination therapies sustain market leadership.
The Tecartus segment is expected to grow at the fastest CAGR of 15.1% from 2025 to 2032, supported by its approval for mantle cell lymphoma and relapsed/refractory B-cell malignancies. Clinical trials and expanded access programs accelerate adoption. Specialty clinics and hospitals are increasingly implementing Tecartus therapy. Biotech partnerships enhance distribution. Positive early clinical results increase confidence. Investment in manufacturing scalability supports demand. Regulatory incentives enable faster approvals. Outreach and awareness programs improve physician familiarity. Patient preference for novel therapies grows. Global adoption is expanding. Ongoing R&D enhances therapeutic potential.
• By Therapeutic Application
On the basis of therapeutic application, the market is segmented into Hematological Malignancies, Pancreatic Cancer, Breast Cancer, Lung Cancer, Gastric Cancer, Multiple Myeloma, Chronic Lymphocytic Leukemia, Mantle Cell Lymphoma, Follicular Lymphoma, Diffuse Large B-Cell Lymphoma, Acute Lymphoblastic Leukemia, and Others. The Hematological Malignancies segment dominated with 69.7% revenue share in 2024, owing to early approvals, high prevalence, and strong clinical outcomes. Hospitals and specialty clinics provide centralized therapy and monitoring. Reimbursement coverage and guideline endorsements support adoption. Multidisciplinary teams ensure safety. Long-term patient data reinforces efficacy. Clinical trial backing ensures regulatory compliance. Physicians prioritize CAR-T for eligible patients. Access to specialized facilities supports dominance. Patient awareness is high. Continued R&D strengthens pipeline. Collaboration with academic centers ensures growth.
The Pancreatic Cancer segment is projected to grow at the fastest CAGR of 12.9% from 2025 to 2032, due to innovative CAR-T constructs targeting KRAS, mesothelin, and other antigens. Clinical trials show early promise. Combination therapies enhance efficacy. Hospitals and specialty clinics expand trial capacity. Biotech investments drive development. Regulatory flexibility encourages faster approvals. Physician awareness programs increase adoption. Patient interest in novel therapies is rising. Academic collaborations boost research. Manufacturing scalability improves access. Targeted therapy precision supports growth. Market penetration in emerging regions fuels rapid uptake.
• By End User
On the basis of end user, the market is segmented into Hospitals, Specialty Clinics, and Others. The Hospitals segment dominated with 58.6% revenue share in 2024, due to centralized CAR-T therapy administration, multidisciplinary teams, advanced infrastructure, and supportive patient monitoring. Hospitals manage infusion, adverse events, and post-therapy care. Regulatory compliance and reimbursement coverage ensure adoption. Multisite facilities provide consistent care. Clinical evidence and long-term patient outcomes strengthen dominance. Integration with supportive care enhances safety. Standardized treatment protocols improve efficacy. Physician familiarity encourages preference. Patient trust is higher in hospital settings. Partnerships with biotech firms enhance access.
The Specialty Clinics segment is projected to grow at the fastest CAGR of 11.3% from 2025 to 2032, driven by dedicated outpatient oncology centers delivering personalized care. Shorter waiting times, focused attention, and precision therapy increase patient preference. Expansion of trial-based treatments supports adoption. Physician awareness and specialized staff improve outcomes. Academic collaborations accelerate knowledge sharing. Innovative therapies are more accessible. Clinics provide flexible scheduling and ongoing monitoring. Patient-centric care models attract new adopters. Awareness campaigns boost demand. Infrastructure improvements enhance capacity. Emerging markets adoption is increasing.
• By Distribution Channel
On the basis of distribution channel, the market is segmented into Hospital Pharmacies and Others. The Hospital Pharmacies segment held the largest market share of 52.1% in 2024, due to controlled dispensing of high-cost CAR-T therapies, storage facilities, regulatory compliance, and trained staff. Bulk procurement, government programs, and integrated supply chains support dominance. Quality assurance protocols ensure safety. Hospitals provide timely access to patients. Reimbursement coverage facilitates affordability. Clinical support teams manage therapy and adverse events. Adoption is supported by standardized hospital procedures. Regulatory guidance reinforces compliance. Centralized distribution improves efficiency. Patient outcomes are better in hospital settings.
The Others segment is projected to grow at the fastest CAGR of 10.7% from 2025 to 2032, including specialty distributors and emerging logistics solutions. This channel improves access in regions lacking hospital infrastructure. E-commerce and telehealth integration support delivery. Faster distribution and flexible supply chains enhance adoption. Collaboration with biotech companies ensures product reliability. Regulatory guidance facilitates expansion. Awareness programs increase physician confidence. Remote and underserved areas benefit. Specialty logistics ensure safe handling. Market penetration in developing regions accelerates. Technology-enabled tracking enhances trust. Flexible access supports rapid growth.
North America CAR-T Cell Therapy Treatment Market Regional Analysis
- North America dominated the North America CAR-T Cell Therapy Treatment Market with the largest revenue share of 41.7% in 2024
- Driven by the growing prevalence of cancer, expanding access to advanced cellular therapies, and strong governmental as well as private sector investments in research and innovation
- The region’s mature healthcare infrastructure and increasing focus on personalized and precision medicine have accelerated the adoption of CAR-T cell therapies across leading oncology centers
U.S. North America CAR-T Cell Therapy Treatment Market Insight
The U.S. North America CAR-T Cell Therapy Treatment Market dominated the North America CAR-T Cell Therapy Treatment Market with the largest revenue share of 42.3% in 2024, driven by robust investments in advanced cancer therapies, strong support from the U.S. Food and Drug Administration (FDA) for accelerated approvals, and the presence of leading biopharmaceutical companies pioneering CAR-T innovations. The country’s extensive clinical trial network, continuous development of next-generation CAR constructs, and expansion of patient access programs have further reinforced its leading position in the global CAR-T cell therapy market.
Canada North America CAR-T Cell Therapy Treatment Market Insight
Canada North America CAR-T Cell Therapy Treatment Market is expected to be the fastest-growing country in the North America CAR-T Cell Therapy Treatment Market during the forecast period, propelled by increasing adoption of personalized oncology treatments, rising government funding for biotechnology research, and favorable regulatory initiatives supporting the advancement of cell and gene therapy. The establishment of specialized CAR-T treatment centers, along with growing collaborations between hospitals, research institutions, and pharmaceutical firms, is further accelerating market growth across the country.
North America CAR-T Cell Therapy Treatment Market Share
The CAR-T Cell Therapy Treatment industry is primarily led by well-established companies, including:
- Gilead Sciences, Inc. (U.S.)
- Bristol Myers Squibb (U.S.)
- Novartis AG (Switzerland)
- Johnson & Johnson and its affiliates (U.S.)
- Legend Biotech Corporation (U.S.)
- Bluebird Bio, Inc. (U.S.)
- Kite Pharma (U.S.)
- Caribou Biosciences, Inc. (U.S.)
- Precision BioSciences, Inc. (U.S.)
- Autolus Therapeutics plc (U.K.)
Latest Developments in North America CAR-T Cell Therapy Treatment Market
- In March 2021, the U.S. Food and Drug Administration (FDA) approved idecabtagene vicleucel (brand name Abecma) for adult patients with relapsed or refractory multiple myeloma after four or more prior lines of therapy. This marked the first-ever FDA-approved CAR-T cell therapy for multiple myeloma, representing a major milestone in personalized oncology and expanding treatment options for heavily pretreated patients
- In February 2022, the FDA approved ciltacabtagene autoleucel (brand name CARVYKTI®) for adult patients with relapsed or refractory multiple myeloma after four or more prior lines of therapy. Developed by Janssen and Legend Biotech, CARVYKTI demonstrated high overall response rates in clinical trials, reinforcing the growing importance of CAR-T cell therapies in treating hematologic malignancies
- In November 2023, the U.S. Food and Drug Administration announced it was investigating a potential risk of T-cell malignancies associated with BCMA- or CD19-directed autologous CAR-T cell therapies. This action reflected increased regulatory vigilance around long-term safety monitoring of CAR-T products and prompted safety reviews across all approved CAR-T therapies in the United States
- In April 2024, the FDA approved expanded use of both Abecma and CARVYKTI therapies, allowing them to be administered earlier in the treatment process for patients with relapsed or refractory multiple myeloma. This decision significantly broadened patient eligibility and underscored the agency’s confidence in the safety and efficacy profiles of these CAR-T therapies. Source: Reuters
SKU-

- Interactive Data Analysis Dashboard
- Company Analysis Dashboard for high growth potential opportunities
- Research Analyst Access for customization & queries
- Competitor Analysis with Interactive dashboard
- Latest News, Updates & Trend analysis
- Harness the Power of Benchmark Analysis for Comprehensive Competitor Tracking
Data collection and base year analysis are done using data collection modules with large sample sizes. The stage includes obtaining market information or related data through various sources and strategies. It includes examining and planning all the data acquired from the past in advance. It likewise envelops the examination of information inconsistencies seen across different information sources. The market data is analysed and estimated using market statistical and coherent models. Also, market share analysis and key trend analysis are the major success factors in the market report. To know more, please request an analyst call or drop down your inquiry.
The key research methodology used by DBMR research team is data triangulation which involves data mining, analysis of the impact of data variables on the market and primary (industry expert) validation. Data models include Vendor Positioning Grid, Market Time Line Analysis, Market Overview and Guide, Company Positioning Grid, Patent Analysis, Pricing Analysis, Company Market Share Analysis, Standards of Measurement, Global versus Regional and Vendor Share Analysis. To know more about the research methodology, drop in an inquiry to speak to our industry experts.
Data Bridge Market Research is a leader in advanced formative research. We take pride in servicing our existing and new customers with data and analysis that match and suits their goal. The report can be customized to include price trend analysis of target brands understanding the market for additional countries (ask for the list of countries), clinical trial results data, literature review, refurbished market and product base analysis. Market analysis of target competitors can be analyzed from technology-based analysis to market portfolio strategies. We can add as many competitors that you require data about in the format and data style you are looking for. Our team of analysts can also provide you data in crude raw excel files pivot tables (Fact book) or can assist you in creating presentations from the data sets available in the report.


