
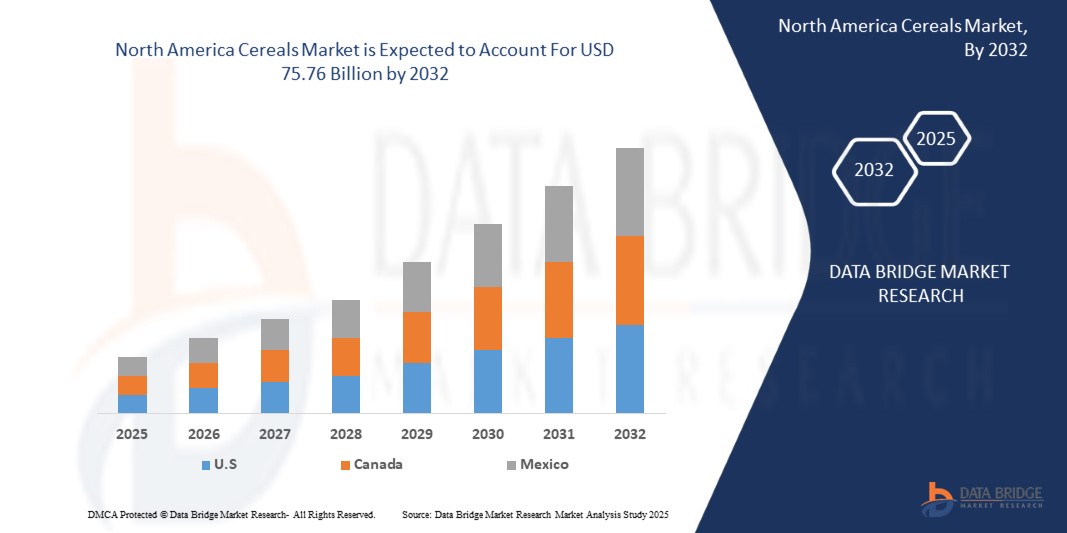
North America Cereals Market
Market Size in USD Billion
 USD
38.96 Billion
USD
75.76 Billion
2024
2032
USD
38.96 Billion
USD
75.76 Billion
2024
2032
| 2025 - 2032 | |
| USD 38.96 Billion | |
| USD 75.76 Billion | |
| % | |
|
Cereals Market Size
- The North America cereals market size was valued at USD 38.96 billion in 2024 and is expected to reach USD 75.76 billion by 2032, at a CAGR of 8.8% during the forecast period
- The market growth is driven by factors such as rising demand for convenient and nutritious breakfast options, growing health consciousness among consumers, innovation in cereal formulations, and expanding availability through online retail channels
- Furthermore, evolving consumer preferences for nutritious and functional foods, alongside expanding urbanization and growing online retail penetration, are accelerating the adoption of cereal products, thereby significantly boosting the industry's growth
Cereals Market Analysis
- The Cereal market represents a key segment within the North America food and agriculture industry, comprising ready-to-eat and hot cereal products. These products are widely consumed as convenient and nutritious breakfast options that suit modern, busy lifestyles. The market includes a diverse range of offerings made from wheat, oats, corn, rice, and barley, tailored to various consumer needs including health-conscious, organic, and gluten-free preferences
- Cereal manufacturers are increasingly innovating with high-protein, fortified, and plant-based variants to align with North America health trends and dietary shifts. These developments are expanding the cereal market's reach into functional food categories, especially in developed regions where consumers prioritize clean labels and nutritional value. The growing trend of meal replacement and on-the-go snacking further supports market growth
- U.S. dominated the cereal market in 2024 and is anticipated to be the fastest-growing country in the market, due to strong consumption patterns, brand loyalty, and the presence of established industry players like Kellogg’s, General Mills, and Post Holdings. The region also benefits from a mature retail infrastructure and high consumer awareness regarding health and wellness
- The wheat segment is expected to dominate the Cereal Market with the largest share in 2025, owing to its convenience, shelf stability, and widespread availability. This segment plays a crucial role in shaping consumer breakfast habits and offers value through fortified, flavor-rich, and diet-specific options that cater to diverse nutritional requirements
Report Scope and Cereals Market Segmentation
|
Attributes |
Cereals Market Key Market Insights |
|
Segments Covered |
|
|
Countries Covered |
North America
|
|
Key Market Players |
|
|
Market Opportunities |
|
|
Value Added Data Infosets |
In addition to the insights on market scenarios such as market value, growth rate, segmentation, geographical coverage, and major players, the market reports curated by the Data Bridge Market Research also include in-depth expert analysis, geographically represented company-wise production and capacity, network layouts of distributors and partners, detailed and updated price trend analysis and deficit analysis of supply chain and demand. |
Cereals Market Trends
“Innovation in Functional Cereals and Personalized Nutrition”
- The North America cereal market is undergoing a pivotal shift with the growing demand for functional cereals and personalized nutrition tailored to consumer health goals and dietary preferences
- This trend is driving manufacturers to reformulate traditional cereals by incorporating ingredients with specific health benefits such as high fiber, immunity support, heart health, and improved digestion
- For instance, leading cereal brands are introducing products enriched with superfoods (chia seeds, flaxseeds), probiotics, prebiotics, and adaptogens like ashwagandha and maca to appeal to wellness-focused consumers
- This shift reflects the rising awareness around preventive health and the preference for clean-label, nutrient-dense foods, positioning functional cereals as essential components of modern diets
Cereals Market Dynamics
Driver
Increasing Demand for Convenient and Nutritious Food Options
- Urban lifestyles are becoming increasingly hectic, prompting a surge in demand for quick, nutritious, and easy-to-prepare breakfast solutions
- Cereal products effectively meet this need due to their convenience, long shelf life, diverse nutritional profiles, and wide availability across both modern and traditional retail channels.
- Ready-to-eat and instant cereal options allow consumers to save time while ensuring a balanced intake of essential nutrients like fiber, vitamins, and minerals
- This growing preference for convenient and wholesome food choices is driving sustained demand for cereals across various demographic groups, especially working professionals, students, and health-conscious families
- In April 2024, as per a report by FoodNavigator, Kellogg’s partnered with a leading nutritional science firm to leverage consumer health data and AI tools for the development of personalized cereal blends. By analyzing millions of data points related to dietary habits, preferences, and health conditions, Kellogg’s introduced a line of customized cereals tailored to support gut health, heart wellness, and energy levels. This move reflects the rising demand for data-driven, functional cereal solutions designed for personalized nutrition
- Such innovations underscore how brands are embracing digital transformation and health analytics to drive product innovation and enhance consumer engagement, ultimately fueling sustained market growth across North America cereal categories.
Restraint/Challenge
Health Concerns Over Sugar Content in Breakfast Cereals
- The substantial cost of sourcing premium raw materials and developing functional, organic, or personalized cereals poses significant challenges, especially for small and medium-sized manufacturers (SMEs)
- These costs include specialized ingredient procurement (e.g., superfoods, probiotics), advanced processing technologies, compliance with clean-label or health certification standards, and marketing for niche health segments. Many smaller cereal producers lack the financial resources or R&D capabilities to compete with established North America brands, leading to slower innovation and limited market reach
- In October 2023, a report by AgriBusiness Review highlighted that the cost of launching functional or organic cereal product lines extends far beyond raw ingredient sourcing. It includes investment in specialized machinery, R&D for nutritional enhancement, packaging innovation, certification (like organic or gluten-free), and consumer education. These cumulative expenses are often unmanageable for small brands aiming to enter health-focused cereal segments
- Limited financial capacity and technological infrastructure force many small and medium-sized cereal producers to delay or forgo such product developments, restricting their ability to compete in premium and functional categories. This financial hurdle significantly slows market diversification and innovation across the cereal industry
Cereals Market Scope
The market is segmented into thirteen notable segments based on product type, product form, processing level, consumption format, product category, nature, category, functional benefits, shelf life, packaging, packaging size, price range, distribution channel
- By Product Type
On the basis of product type, the Cereal Market is segmented into wheat, rice, maize (corn), barley, oats, rye, sorghum, millet, quinoa, buckwheat, triticale, fonio, teff, amaranth, kamut, and others. Wheat and maize are expected to dominate the market share in 2025 and is anticipated to be the fastest-growing segment in the market due to their North America availability, affordability, and extensive use in both food and feed industries. The rising demand for ancient grains like quinoa and amaranth is expected to fuel growth in the specialty and health cereal segments during the forecast period.
- By Product Form
On the basis of product form, the Cereal Market is segmented into whole grains, flour, flaked grains, rolled grains, puffed grains, ground meal, cracked grains, starch, bran, germ, and others. Whole grains are expected to dominate the market share in 2025 and is anticipated to be the fastest-growing segment in the market, driven by growing awareness around fiber-rich diets and clean-label preferences. Flour and bran are expected to show steady growth due to their use in bakery and health foods.
- By Processing Level
On the basis of processing level, the Cereal Market is segmented into fortified, dehusked, polished, pre-cooked, blended, instant, sprouted, roasted, extruded, partially cooked, micronized, raw, fully cooked, steamed, seasoned, sweetened, coated, and others. Fortified are expected to dominate the market share in 2025 and is anticipated to be the fastest-growing segment in the market due to their added nutritional benefits, while instant and pre-cooked formats are driving demand among urban populations for time-saving meal solutions.
- By Consumption Format
On the basis of consumption format, the Cereal Market is segmented into spoon-eaten with milk/yogurt, on-the-go bars, porridge, dry snack, snack packs, ready-to-cook, ready-to-heat, mix-in ingredient, beverage-infused, and others. Spoon-eaten are expected to dominate the market share in 2025 and is anticipated to be the fastest-growing segment in the market due to their conventional use, while ready-to-cook and snack packs are projected to witness rapid growth due to their portability and convenience.
- By Product Category
On the basis of product category, the Cereal Market is segmented into bakery ingredients (flour/grain blends), breakfast cereals, feedstock/animal feed, cereal snacks, instant cereal mixes, infant cereals, cereal-based meal kits, brewing/distilling inputs, and others. Breakfast are expected to dominate the market share in 2025 and is anticipated to be the fastest-growing segment in the market owing to their widespread consumption, while cereal snacks and infant cereals are anticipated to grow rapidly due to changing dietary patterns and health-focused parenting.
- By Nature
On the basis of nature, the Cereal Market is segmented into conventional and organic. Conventional cereals dominate in volume due to affordability and established supply chains.
Organic cereals are projected to exhibit the fastest growth during 2025–2032, driven by increasing consumer demand for pesticide-free and clean-label products.
- By Category
On the basis of category, the Cereal Market is segmented into GMO-based and non-GMO certified. The non-GMO certified segment are expected to dominate the market share in 2025 and is anticipated to be the fastest-growing segment in the market grow rapidly due to rising consumer awareness and preference for naturally sourced grains, especially in North America and Europe.
- By Functional Benefits
On the basis of functional benefits, the Cereal Market is segmented into vitamin-fortified, high-fiber, low/no sugar, high-protein, gluten-free, heart-healthy, probiotic/prebiotic enhanced, cholesterol-lowering, low glycemic index, omega-3 enriched, low fat, allergen-free, high-iron, low/no salt, paleo-friendly, keto-friendly, vegan-certified, and others. High-fiber and heart-healthy are expected to dominate the market share in 2025 and is anticipated to be the fastest-growing segment in the market due to increased focus on preventative health and weight management.
- By Shelf Life
On the basis of shelf life, the Cereal Market is segmented into long-term (ambient shelf-stable), medium-term, and short-term (perishable). Long-term shelf-stable are expected to dominate the market share in 2025 and is anticipated to be the fastest-growing segment in the market due to their durability and logistical advantages, especially in retail and export markets.
- By Packaging
On the basis of packaging, the Cereal Market is segmented into box, pouch, bag, sachet/stick pack, sack (bulk), jar, Tetra Pack/aseptic carton, canister, drum, eco-packaging, and others. Boxes and pouches are expected to dominate the market share in 2025 and is anticipated to be the fastest-growing segment in the market due to sustainability initiatives and rising demand for convenient, sustainable, and cost-effective packaging solutions. Consumer preference for resealable, lightweight, and eco-friendly formats supports growth, especially in food, personal care, and e-commerce sectors focused on freshness and reduced waste.
- By Packaging Size
On the basis of packaging size, the Cereal Market is segmented into small packs (51g–250g), medium packs (251g–500g), large packs (501g–1kg), single-serve packs (below 50g), extra-large packs (1.1kg–2.5kg), and bulk packs (above 2.5kg). Small and medium packs are expected to dominate the market share in 2025 and is anticipated to be the fastest-growing segment in the market due to their affordability and suitability for single households, while bulk packs are common in B2B and institutional sales.
- By Price Range
On the basis of price range, the Cereal Market is segmented into economy (up to USD 2.49), mid-range (USD 2.50–6.99), and premium (USD 7.00 and above). The mid-range segment are expected to dominate the market share in 2025 and is anticipated to be the fastest-growing segment in the market due to its balance of affordability and quality, while premium cereals are gaining traction in urban markets with rising disposable incomes.
- By Distribution Channel
On the basis of distribution channel, the Cereal Market is segmented into B2B and B2C. B2C are expected to dominate the market share in 2025 and is anticipated to be the fastest-growing segment in the market sales through supermarkets, convenience stores, and online platforms, while the B2B segment is driven by food service, institutional supply, and industrial use.
Cereals Market Regional Analysis
- North America dominated the cereal market with the largest revenue share 30.11% in 2024, driven by high consumption of ready-to-eat cereals, strong brand presence, and widespread availability across modern retail formats.
- The region benefits from a mature food processing industry, rising demand for organic and fortified cereal products, and continued innovation by key players like Kellogg’s, General Mills, and Post Holdings. In addition, increasing consumer preference for convenient, health-focused breakfast options further solidifies North America's market leadership.
U.S. Cereal Market Insight
The U.S. Cereal Market captured the largest revenue share of over 79.66% within North America in 2025, driven by high per capita cereal consumption, brand loyalty, and a well-established retail network. Major players such as General Mills, Kellogg’s, Post Holdings, and Quaker (PepsiCo) dominate the market with a wide range of ready-to-eat and functional cereal offerings. The demand for organic, high-fiber, and protein-enriched cereals continues to grow, reflecting evolving health and wellness trends.
Canada Cereal Market Insight
The U.S. Cereal Market captured the largest revenue share of over 79.66% within North America in 2025, driven increasing consumer demand for nutritious, convenient breakfast options, including high-protein, gluten-free, and organic varieties. Health-conscious trends, diverse multicultural preferences, and innovation in ready-to-eat and hot cereal segments drive sustained market growth.
Cereals Market Share
The cereals market is primarily led by well-established companies, including:
- General Mills Inc. (U.S.)
- WK Kellogg Co (U.S.)
- PepsiCo (U.S.)
- Post Holdings, Inc. (U.S.)
- The Quaker Oats Company (U.S.)
- The Hain Celestial Group (U.S.)
- B&G Foods, Inc. (U.S.)
- Barbara's Bakery (U.S.)
- Nature's Path (Canada)
- Kashi LLC (U.S.)
- Bob’s Red Mill Natural Foods (U.S.)
- Seven Sundays (U.S.)
- The Silver Palate (U.S.)
Latest Developments in North America Cereals Market
- In March 2025, General Mills launched a new line of high-protein breakfast cereals under its "Nature Valley" brand, targeting health-conscious consumers and fitness enthusiasts. The product includes variants fortified with whey protein, fiber, and zero added sugar, aligning with rising demand for functional foods
- In January 2025, Kellogg’s announced its strategic expansion into Southeast Asia with a new manufacturing facility in Vietnam to meet growing regional demand for convenient breakfast solutions. The plant will produce a variety of cereals tailored to local taste preferences, including low-sugar and plant-based options
- In October 2024, Nestlé partnered with Danone and a health-tech startup to co-develop a personalized nutrition platform. The platform uses consumer dietary data to recommend cereal products rich in specific nutrients such as omega-3, fiber, and iron, ushering in a new era of precision nutrition in the breakfast category
- In April 2025, Post Holdings unveiled sustainable packaging for its "Honey Bunches of Oats" cereal line. The new recyclable and biodegradable packs support the company’s commitment to reduce plastic use by 50% by 2030 and cater to eco-conscious consumers
- In February 2025, Marico’s “Saffola” brand introduced millet-based cereals under its “Healthy Crunch” line in India. The launch aligns with the International Year of Millets initiative and addresses the rising popularity of ancient grains in modern breakfast formulations
SKU-

- Interactive Data Analysis Dashboard
- Company Analysis Dashboard for high growth potential opportunities
- Research Analyst Access for customization & queries
- Competitor Analysis with Interactive dashboard
- Latest News, Updates & Trend analysis
- Harness the Power of Benchmark Analysis for Comprehensive Competitor Tracking
Table of Content
1 INTRODUCTION
1.1 OBJECTIVES OF THE STUDY
1.2 MARKET DEFINITION
1.3 OVERVIEW
1.4 LIMITATIONS
1.5 MARKETS COVERED
2 MARKET SEGMENTATION
2.1 MARKETS COVERED
2.2 GEOGRAPHICAL SCOPE
2.3 YEARS CONSIDERED FOR THE STUDY
2.4 CURRENCY AND PRICING
2.5 DBMR TRIPOD DATA VALIDATION MODEL
2.6 MULTIVARIATE MODELING
2.7 PRIMARY INTERVIEWS WITH KEY OPINION LEADERS
2.8 DBMR MARKET POSITION GRID
2.9 DBMR VENDOR SHARE ANALYSIS
2.1 SECONDARY SOURCES
2.11 ASSUMPTIONS
3 EXECUTIVE SUMMARY
4 PREMIUM INSIGHTS
4.1 PORTERS FIVE FORCES:-
4.1.1 INTENSITY OF COMPETITIVE RIVALRY (HIGH)
4.1.2 BARGAINING POWER OF BUYERS/CONSUMERS (HIGH)
4.1.3 THREAT OF NEW ENTRANTS (LOW TO MODERATE)
4.1.4 THREAT OF SUBSTITUTE PRODUCTS (MODERATE TO HIGH)
4.1.5 BARGAINING POWER OF SUPPLIERS (MODERATE)
4.2 BRAND OUTLOOK
4.2.1 COMPARATIVE BRAND ANALYSIS
4.2.2 PRODUCT AND BRAND OVERVIEW
4.3 GROWTH STRATEGIES ADOPTED BY KEY MARKET PLAYERS:
4.4 FACTORS INFLUENCING PURCHASING DECISION OF END-USERS
4.5 IMPACT OF ECONOMIC SLOWDOWN ON MARKET
4.5.1 IMPACT ON PRICE
4.5.2 IMPACT ON SUPPLY CHAIN
4.5.3 IMPACT ON SHIPMENT
4.5.4 IMPACT ON COMPANY’S STRATEGIC DECISIONS
4.6 REGULATORY FRAMEWORK AND GUIDELINES
4.7 VALUE CHAIN
4.7.1 NORTH AMERICA CEREALS MARKET VALUE CHAIN
4.7.2 PRODUCTION:
4.7.3 PROCESSING:
4.7.4 MARKETING/DISTRIBUTION:
4.7.5 BUYERS:
4.8 SUPPLY CHAIN ANALYSIS
4.9 COST ANALYSIS BREAKDOWN
4.1 PROFIT MARGINS SCENARIO
4.11 INNOVATION TRACKER AND STRATEGIC ANALYSIS
4.11.1 MAJOR DEALS AND STRATEGIC ALLIANCES ANALYSIS
4.11.1.1 JOINT VENTURES
4.11.1.2 MERGERS AND ACQUISITIONS
4.11.1.3 LICENSING AND PARTNERSHIP
4.11.1.4 TECHNOLOGY COLLABORATIONS
4.11.1.5 STRATEGIC DIVESTMENTS
4.12 PRICING ANALYSIS
4.13 PATENT ANALYSIS
4.13.1 PATENT QUALITY AND STRENGTH
4.13.2 PATENT FAMILIES
4.13.3 NUMBER OF INTERNATIONAL PATENT FAMILIES BY PUBLICATION YEAR
4.13.4 LICENSING AND COLLABORATIONS
4.13.5 COMPANY PATENT LANDSCAPE
4.13.6 REGION PATENT LANDSCAPE
4.14 IP STRATEGY AND MANAGEMENT
4.14.1 PATENT ANALYSIS
4.14.2 PROFIT MARGINS SCENARIO
4.15 IMPACT OF ECONOMIC SLOWDOWN ON THE NORTH AMERICA CEREALS MARKET
4.15.1 IMPACT ON PRICES
4.15.2 IMPACT ON SUPPLY CHAIN
4.15.3 IMPACT ON SHIPMENT
4.15.4 IMPACT ON DEMAND
4.15.5 IMPACT ON STRATEGIC DECISIONS
4.16 SUPPLY CHAIN ANALYSIS
4.16.1 OVERVIEW
4.16.2 TYPES OF LOGISTICS COSTS INVOLVED
4.16.3 FACTORS INFLUENCING EACH COST TYPE
4.16.4 STRATEGIES TO MINIMIZE LOGISTIC COSTS
4.16.5 IMPORTANCE OF LOGISTICS SERVICE PROVIDERS
4.17 INDUSTRY ECOSYSTEM ANALYSIS
4.17.1 PROMINENT COMPANIES
4.17.2 SMALL & MEDIUM SIZE COMPANIES
4.17.3 END USERS
4.18 PRODUCTION CONSUMPTION ANALYSIS
4.19 RAW MATERIAL SOURCING ANALYSIS (NORTH AMERICA CEREALS MARKET)
4.2 OVERVIEW OF TECHNOLOGICAL INNOVATIONS
4.20.1 OVERVIEW:
4.21 TARIFFS & IMPACT ON THE MARKET
4.21.1 CURRENT TARIFF RATE (S) IN TOP-5 COUNTRY MARKETS
4.21.2 OUTLOOK: LOCAL PRODUCTION V/S IMPORT RELIANCE
4.21.3 VENDOR SELECTION CRITERIA DYNAMICS
4.21.4 IMPACT ON SUPPLY CHAIN
4.21.4.1 RAW MATERIAL PROCUREMENT
4.21.4.2 MANUFACTURING AND PRODUCTION
4.21.4.3 LOGISTICS AND DISTRIBUTION
4.21.4.4 PRICE PITCHING AND POSITION OF MARKET
4.21.5 INDUSTRY PARTICIPANTS: PROACTIVE MOVES
4.21.5.1 SUPPLY CHAIN OPTIMIZATION
4.21.5.2 JOINT VENTURE ESTABLISHMENTS
4.21.6 IMPACT ON PRICES
4.21.7 REGULATORY INCLINATION
4.21.7.1 GEOPOLITICAL SITUATION
4.21.7.2 TRADE PARTNERSHIPS BETWEEN THE COUNTRIES
4.21.8 FREE TRADE AGREEMENTS
4.21.9 ALLIANCES ESTABLISHMENTS
4.21.10 STATUS ACCREDITATION (INCLUDING MFTN)
4.21.11 DOMESTIC COURSE OF CORRECTION
4.21.12 INCENTIVE SCHEMES TO BOOST PRODUCTION OUTPUTS
4.21.13 ESTABLISHMENT OF SPECIAL ECONOMIC ZONES/INDUSTRIAL PARKS
5 MARKET OVERVIEW
5.1 DRIVERS
5.1.1 RISING DEMAND FOR NUTRITIONAL AND FUNCTIONAL FOODS
5.1.2 URBANIZATION AND CHANGING LIFESTYLES BOOSTING READY-TO-EAT CEREALS
5.1.3 SURGE OF PLANT‑BASED AND FUNCTIONAL INGREDIENTS DRIVEN BY HEALTH & ENVIRONMENTAL CONCERNS
5.2 RESTRAINTS
5.2.1 FLUCTUATING RAW MATERIAL PRICES AND CLIMATE RISKS
5.2.2 GROWING CRITICISM OVER ADDED SUGAR AND PROCESSING
5.3 OPPORTUNITIES
5.3.1 CONSUMERS ARE INCREASINGLY CHOOSING HIGH-FIBER, LOW-SUGAR, AND ORGANIC CEREALS
5.3.2 THE RISING SHIFT TOWARD PLANT-BASED DIETARY PATTERNS INFLUENCING CONSUMER PREFERENCES.
5.3.3 ONLINE GROCERY ENABLING CEREAL BRANDS TO SELL DIRECTLY, GATHER CONSUMER DATA, AND OFFER SUBSCRIPTIONS
5.4 CHALLENGES
5.4.1 SIGNIFICANT HURDLES FOR SUPPLY CHAINS DUE TO LOGISTICS DISRUPTIONS, COMPLEX REGULATIONS, AND INEFFICIENT DISTRIBUTION NETWORKS
5.4.2 INCREASED COMPETITION FROM ALTERNATIVES LIKE GRANOLA, PROTEIN BARS, SMOOTHIES, YOGURT, AND ETHNIC BREAKFASTS
6 NORTH AMERICA CEREALS MARKET, BY CEREAL TYPE
6.1 OVERVIEW
6.2 WHEAT
6.2.1 WHEAT, BY TYPE
6.3 RICE
6.3.1 RICE, BY TYPE
6.4 MAIZE(CORN)
6.4.1 MAIZE(CORN), BY TYPE
6.5 BARLEY
6.5.1 BARLEY, BY TYPE
6.6 OATS
6.6.1 OATS, BY TYPE
6.7 RYE
6.7.1 RYE, BY TYPE
6.8 SORGHUM
6.8.1 SORGHUM, BY TYPE
6.9 MILLET
6.9.1 MILLET, BY TYPE
6.1 QUINOA
6.10.1 QUINOA, BY TYPE
6.11 BUCKWHEAT
6.12 TRITICALE
6.13 FONIO
6.14 TEFF
6.15 AMARANTH
6.16 KAMUT
6.17 OTHERS
7 NORTH AMERICA CEREALS MARKET, PRODUCT FORM
7.1 OVERVIEW
7.2 WHOLE GRAINS
7.3 FLOUR
7.4 FLAKED GRAINS
7.5 ROLLED GRAINS
7.6 PUFFED GRAINS
7.7 GROUND MEAL
7.8 CRACKED GRAINS
7.9 STARCH
7.1 BRAN
7.11 GERM
7.12 OTHERS
8 NORTH AMERICA CEREALS MARKET, BY PROCESSING LEVEL
8.1 OVERVIEW
8.2 FORTIFIED
8.3 DEHUSKED
8.4 POLISHED
8.5 PRE-COOKED
8.6 BLENDED
8.7 INSTANT
8.8 SPROUTED
8.9 ROASTED
8.1 EXTRUDED
8.11 PARTIALLY COOKED
8.12 MICRONIZED
8.13 RAW
8.14 FULLY COOKED
8.15 STEAMED
8.16 SEASONED
8.17 SWEETENED
8.18 COATED
8.19 OTHERS
9 NORTH AMERICA CEREALS MARKET, BY CONSUMPTION FORMAT
9.1 OVERVIEW
9.2 SPOON-EATEN WITH MILK/YOGURT
9.3 ON-THE-GO BARS
9.4 PORRIDGE
9.5 DRY SNACK
9.6 SNACK PACKS
9.7 READY-TO-COOK
9.8 READY-TO-HEAT
9.9 MIX-IN INGREDIENT
9.1 BEVERAGE-INFUSED
9.11 OTHERS
10 NORTH AMERICA CEREALS MARKET, BY PRODUCT CATEGORY
10.1 OVERVIEW
10.2 BAKERY INGREDIENTS (FLOUR/GRAIN BLENDS)
10.3 BREAKFAST CEREALS
10.3.1 BREAKFAST CEREALS, BY TYPE
10.3.1.1 Ready-To-Eat (RTE), By Type
10.3.1.2 Hot Cereals, By Type
10.4 FEEDSTOCK/ANIMAL FEED
10.5 CEREAL SNACKS
10.5.1 CEREAL SNACKS, BY TYPE
10.6 INSTANT CEREAL MIXES
10.7 INFANT CEREALS
10.7.1 INFANT CEREALS, BY TYPE
10.8 CEREAL-BASED MEAL KITS
10.9 BREWING/DISTILLING INPUTS
10.1 OTHERS
11 NORTH AMERICA CEREALS MARKET, BY NATURE
11.1 OVERVIEW
11.2 CONVENTIONAL
11.3 ORGANIC
12 NORTH AMERICA CEREALS MARKET, BY CATEGORY
12.1 OVERVIEW
12.2 GMO-BASED
12.3 NON-GMO CERTIFIED
13 NORTH AMERICA CEREALS MARKET, BY FUNCTIONAL BENEFITS
13.1 OVERVIEW
13.2 VITAMIN-FORTIFIED
13.3 HIGH-FIBER
13.4 LOW/NO SUGAR
13.5 HIGH-PROTEIN
13.6 GLUTEN-FREE
13.7 HEART-HEALTHY
13.8 PROBIOTIC/PREBIOTIC ENHANCED
13.9 CHOLESTEROL-LOWERING
13.1 LOW GLYCEMIC INDEX
13.11 OMEGA-3 ENRICHED
13.12 LOW FAT
13.13 ALLERGEN-FREE
13.14 HIGH-IRON
13.15 LOW/NO SALT
13.16 PALEO-FRIENDLY
13.17 KETO-FRIENDLY
13.18 VEGAN-CERTIFIED
13.19 OTHERS
14 NORTH AMERICA CEREALS MARKET, BY SHELF LIFE
14.1 OVERVIEW
14.2 LONG-TERM (AMBIENT SHELF-STABLE)
14.3 MEDIUM-TERM
14.4 SHORT-TERM (PERISHABLE)
15 NORTH AMERICA CEREALS MARKET, BY PACKAGING
15.1 OVERVIEW
15.2 BOX
15.2.1 BOX, BY TYPE
15.3 POUCH
15.3.1 POUCH, BY TYPE
15.4 BAG
15.4.1 BAG, BY TYPE
15.5 SACHET/STICK PACK
15.6 SACK (BULK)
15.7 JAR
15.7.1 JAR, BY TYPE
15.8 TETRA PACK / ASEPTIC CARTON
15.9 CANISTER
15.1 DRUM
15.11 ECO-PACKAGING
15.11.1 ECO-PACKAGING, BY TYPE
15.12 OTHERS
16 NORTH AMERICA CEREALS MARKET, BY PACKAGING SIZE
16.1 OVERVIEW
16.2 SMALL PACKS (51G–250G)
16.3 MEDIUM PACKS (251G–500G)
16.4 LARGE PACKS (501G–1KG)
16.5 SINGLE SERVE PACKS (BELOW 50G)
16.6 EXTRA LARGE PACKS (1.1KG–2.5KG)
16.7 BULK PACKS (ABOVE 2.5KG)
17 NORTH AMERICA CEREALS MARKET, BY PRICE RANGE
17.1 OVERVIEW
17.2 ECONOMY (UPTO USD 2.49)
17.3 MID-RANGE (USD 2.50-6.99)
17.4 PREMIUM (USD 7.00 AND ABOVE)
18 NORTH AMERICA CEREALS MARKET, BY DISTRIBUTION CHANNEL
18.1 OVERVIEW
18.2 B2B
18.3 B2C
18.3.1 B2C, BY TYPE
18.3.2 ONLINE, BY TYPE
18.3.3 OFFLINE, BY TYPE
19 NORTH AMERICA CEREALS MARKET, BY REGION
19.1 NORTH AMERICA
19.1.1 U.S.
19.1.2 CANADA
19.1.3 MEXICO
20 NORTH AMERICA CEREALS MARKET
20.1 COMPANY SHARE ANALYSIS: GLOBAL
21 SWOT ANALYSIS
22 COMPANY PROFILES
22.1 NESTLÉ
22.1.1 COMPANY SNAPSHOT
22.1.2 REVENUE ANALYSIS
22.1.3 COMPANY SHARE ANALYSIS
22.1.4 BRAND PORTFOLIO
22.1.5 RECENT DEVELOPMENT
22.2 ASSOCIATED BRITISH FOODS PLC
22.2.1 COMPANY SNAPSHOT
22.2.2 REVENUE ANALYSIS
22.2.3 COMPANY SHARE ANALYSIS
22.2.4 BUSINESS PORTFOLIO
22.2.5 RECENT NEWS
22.3 GENERAL MILLS INC.
22.3.1 COMPANY SNAPSHOT
22.3.2 REVENUE ANALYSIS
22.3.3 COMPANY SHARE ANALYSIS
22.3.4 BRAND PORTFOLIO
22.3.5 RECENT DEVELOPMENT
22.4 POST HOLDINGS, INC.
22.4.1 COMPANY SNAPSHOT
22.4.2 REVENUE ANALYSIS
22.4.3 COMPANY SHARE ANALYSIS
22.4.4 BRAND PORTFOLIO
22.4.5 RECENT DEVELOPMENT
22.5 WK KELLOGG CO
22.5.1 COMPANY SNAPSHOT
22.5.2 REVENUE ANALYSIS
22.5.3 COMPANY SHARE ANALYSIS
22.5.4 BRAND PORTFOLIO
22.5.5 RECENT DEVELOPMENT
22.6 BAGRRY'S
22.6.1 COMPANY SNAPSHOT
22.6.2 PRODUCT PORTFOLIO
22.6.3 RECENT DEVELOPMENTS/NEWS
22.7 B&G FOODS, INC.
22.7.1 COMPANY SNAPSHOT
22.7.2 REVENUE ANALYSIS
22.7.3 PRODUCT PORTFOLIO
22.7.4 RECENT DEVELOPMENT
22.8 BARBARA'S BAKERY
22.8.1 COMPANY SNAPSHOT
22.8.2 PRODUCT PORTFOLIO
22.8.3 RECENT DEVELOPMENT
22.9 BIO-FAMILIA EN
22.9.1 COMPANY SNAPSHOT
22.9.2 PRODUCT PORTFOLIO
22.9.3 RECENT DEVELOPMENTS/NEWS
22.1 BOB’S RED MILL NATURAL FOODS
22.10.1 COMPANY SNAPSHOT
22.10.2 PRODUCT PORTFOLIO
22.10.3 RECENT DEVELOPMENTS/NEWS
22.11 CÉRÉAL BIO
22.11.1 COMPANY SNAPSHOT
22.11.2 PRODUCT PORTFOLIO
22.11.3 RECENT DEVELOPMENT
22.12 CLEXTRAL
22.12.1 COMPANY SNAPSHOT
22.12.2 PRODUCT PORTFOLIO
22.12.3 RECENT DEVELOPMENT
22.13 DR. OETKER
22.13.1 COMPANY SNAPSHOT
22.13.2 REVENUE ANALYSIS
22.13.3 PRODUCT PORTFOLIO
22.13.4 RECENT DEVELOPMENTS/NEWS
22.14 HERO GROUP
22.14.1 COMPANY SNAPSHOT
22.14.2 REVENUE ANALYSIS
22.14.3 PRODUCT PORTFOLIO
22.14.4 RECENT DEVELOPMENTS/NEWS
22.15 KASHI LLC
22.15.1 COMPANY SNAPSHOT
22.15.2 PRODUCT PORTFOLIO
22.15.3 RECENT DEVELOPMENT
22.16 KWALITY
22.16.1 COMPANY SNAPSHOT
22.16.2 PRODUCT PORTFOLIO
22.16.3 RECENT DEVELOPMENT
22.17 LIMAGRAIN - INGRÉDIENTS
22.17.1 COMPANY SNAPSHOT
22.17.2 PRODUCT PORTFOLIO
22.17.3 RECENT DEVELOPMENT
22.18 MARICO
22.18.1 COMPANY SNAPSHOT
22.18.2 REVENUE ANALYSIS
22.18.3 BRAND PORTFOLIO
22.18.4 RECENT DEVELOPMENTS/NEWS
22.19 MULDER BREAKFAST CEREALS
22.19.1 COMPANY SNAPSHOT
22.19.2 PRODUCT PORTFOLIO
22.19.3 RECENT DEVELOPMENT
22.2 NATURE'S PATH
22.20.1 COMPANY SNAPSHOT
22.20.2 PRODUCT PORTFOLIO
22.20.3 RECENT DEVELOPMENT
22.21 PEPSICO
22.21.1 COMPANY SNAPSHOT
22.21.2 REVENUE ANALYSIS
22.21.3 PRODUCT PORTFOLIO
22.21.4 RECENT DEVELOPMENT
22.22 RUDE HEALTH
22.22.1 COMPANY SNAPSHOT
22.22.2 PRODUCT PORTFOLIO
22.22.3 RECENT DEVELOPMENTS/NEWS
22.23 SANITARIUM
22.23.1 COMPANY SNAPSHOT
22.23.2 PRODUCT PORTFOLIO
22.23.3 RECENT DEVELOPMENT
22.24 SEITENBACHER
22.24.1 COMPANY SNAPSHOT
22.24.2 PRODUCT PORTFOLIO
22.24.3 RECENT DEVELOPMENTS/NEWS
22.25 SEVEN SUNDAYS
22.25.1 COMPANY SNAPSHOT
22.25.2 PRODUCT PORTFOLIO
22.25.3 RECENT DEVELOPMENTS/NEWS
22.26 SURREAL UK
22.26.1 COMPANY SNAPSHOT
22.26.2 PRODUCT PORTFOLIO
22.26.3 RECENT DEVELOPMENTS/NEWS
22.27 THE HAIN CELESTIAL GROUP, INC.
22.27.1 COMPANY SNAPSHOT
22.27.2 REVENUE ANALYSIS
22.27.3 BRAND PORTFOLIO
22.27.4 RECENT DEVELOPMENTS/NEWS
22.28 THE QUAKER OATS COMPANY
22.28.1 COMPANY SNAPSHOT
22.28.2 PRODUCT PORTFOLIO
22.28.3 RECENT DEVELOPMENTS/NEWS
22.29 THE SILVER PALATE
22.29.1 COMPANY SNAPSHOT
22.29.2 PRODUCT PORTFOLIO
22.29.3 RECENT DEVELOPMENT
22.3 WEETABIX
22.30.1 COMPANY SNAPSHOT
22.30.2 PRODUCT PORTFOLIO
22.30.3 RECENT DEVELOPMENTS/NEWS
23 QUESTIONNAIRE
24 RELATED REPORTS
List of Table
TABLE 1 SUMMARY OF COMPETITIVE POSITIONING:
TABLE 2 COMPARATIVE BRAND ANALYSIS
TABLE 3 EXPORT
TABLE 4 IMPORT
TABLE 5 COST FOR KEY EQUIPMENT AND THE OVERALL CEREALS PROCESSING PLANTS
TABLE 6 PROFIT MARGIN SCENARIOS
TABLE 7 CONSUMER BUYING BEHAVIOUR
TABLE 8 PRODUCTION
TABLE 9 CONSUMPTION
TABLE 10 CONSUMER BUYING BEHAVIOUR
TABLE 11 CEREAL IMPORT TARIFF RATES IN TOP 5 MARKETS (2024)
TABLE 12 LOCAL PRODUCTION V/S IMPORT RELIANCE
TABLE 13 REGULATORY INCLINATION
TABLE 14 TRADE PARTNERSHIPS BETWEEN THE COUNTRIES
TABLE 15 ALLIANCES ESTABLISHMENTS
TABLE 16 ESTABLISHMENT OF SPECIAL ECONOMIC ZONES (SEZS) AND INDUSTRIAL PARKS
TABLE 17 NORTH AMERICA CEREALS MARKET, BY CEREAL TYPE, 2018-2032 (USD THOUSAND)
TABLE 18 NORTH AMERICA CEREALS MARKET, BY CEREAL TYPE, 2018-2032 (THOUSAND TONS)
TABLE 19 NORTH AMERICA WHEAT IN CEREALS MARKET, BY REGION, 2018-2032 (USD THOUSAND)
TABLE 20 NORTH AMERICA WHEAT IN CEREALS MARKET, BY TYPE, 2018-2032 (USD THOUSAND)
TABLE 21 NORTH AMERICA RICE IN CEREALS MARKET, BY REGION, 2018-2032 (USD THOUSAND)
TABLE 22 NORTH AMERICA RICE IN CEREALS MARKET, BY TYPE, 2018-2032 (USD THOUSAND)
TABLE 23 NORTH AMERICA MAIZE(CORN) IN CEREALS MARKET, BY REGION, 2018-2032 (USD THOUSAND)
TABLE 24 NORTH AMERICA MAIZE(CORN) IN CEREALS MARKET, BY TYPE, 2018-2032 (USD THOUSAND)
TABLE 25 NORTH AMERICA BARLEY IN CEREALS MARKET, BY REGION, 2018-2032 (USD THOUSAND)
TABLE 26 NORTH AMERICA BARLEY IN CEREALS MARKET, BY TYPE, 2018-2032 (USD THOUSAND)
TABLE 27 NORTH AMERICA OATS IN CEREALS MARKET, BY REGION, 2018-2032 (USD THOUSAND)
TABLE 28 NORTH AMERICA OATS IN CEREALS MARKET, BY TYPE, 2018-2032 (USD THOUSAND)
TABLE 29 NORTH AMERICA RYE IN CEREALS MARKET, BY REGION, 2018-2032 (USD THOUSAND)
TABLE 30 NORTH AMERICA RYE IN CEREALS MARKET, BY TYPE, 2018-2032 (USD THOUSAND)
TABLE 31 NORTH AMERICA SORGHUM IN CEREALS MARKET, BY REGION, 2018-2032 (USD THOUSAND)
TABLE 32 NORTH AMERICA SORGHUM IN CEREALS MARKET, BY TYPE, 2018-2032 (USD THOUSAND)
TABLE 33 NORTH AMERICA MILLET IN CEREALS MARKET, BY REGION, 2018-2032 (USD THOUSAND)
TABLE 34 NORTH AMERICA MILLET IN CEREALS MARKET, BY TYPE, 2018-2032 (USD THOUSAND)
TABLE 35 NORTH AMERICA QUINOA IN CEREALS MARKET, BY REGION, 2018-2032 (USD THOUSAND)
TABLE 36 NORTH AMERICA QUINOA IN CEREALS MARKET, BY TYPE, 2018-2032 (USD THOUSAND)
TABLE 37 NORTH AMERICA BUCKWHEAT IN CEREALS MARKET, BY REGION, 2018-2032 (USD THOUSAND)
TABLE 38 NORTH AMERICA TRITICALE IN CEREALS MARKET, BY REGION, 2018-2032 (USD THOUSAND)
TABLE 39 NORTH AMERICA FONIO IN CEREALS MARKET, BY REGION, 2018-2032 (USD THOUSAND)
TABLE 40 NORTH AMERICA TEFF IN CEREALS MARKET, BY REGION, 2018-2032 (USD THOUSAND)
TABLE 41 NORTH AMERICA AMARANTH IN CEREALS MARKET, BY REGION, 2018-2032 (USD THOUSAND)
TABLE 42 NORTH AMERICA OTHERS IN CEREALS MARKET, BY REGION, 2018-2032 (USD THOUSAND)
TABLE 43 NORTH AMERICA OTHERS IN CEREALS MARKET, BY REGION, 2018-2032 (USD THOUSAND)
TABLE 44 NORTH AMERICA CEREALS MARKET, BY PRODUCT FORM, 2018-2032 (USD THOUSAND)
TABLE 45 NORTH AMERICA WHOLE GRAINS IN CEREALS MARKET, BY REGION, 2018-2032 (USD THOUSAND)
TABLE 46 NORTH AMERICA FLOUR IN CEREALS MARKET, BY REGION, 2018-2032 (USD THOUSAND)
TABLE 47 NORTH AMERICA FLAKED GRAINS IN CEREALS MARKET, BY REGION, 2018-2032 (USD THOUSAND)
TABLE 48 NORTH AMERICA ROLLED GRAINS IN CEREALS MARKET, BY REGION, 2018-2032 (USD THOUSAND)
TABLE 49 NORTH AMERICA PUFFED GRAINS IN CEREALS MARKET, BY REGION, 2018-2032 (USD THOUSAND)
TABLE 50 NORTH AMERICA GROUND MEAL IN CEREALS MARKET, BY REGION, 2018-2032 (USD THOUSAND)
TABLE 51 NORTH AMERICA CRACKED GRAINS IN CEREALS MARKET, BY REGION, 2018-2032 (USD THOUSAND)
TABLE 52 NORTH AMERICA STARCH IN CEREALS MARKET, BY REGION, 2018-2032 (USD THOUSAND)
TABLE 53 NORTH AMERICA BRAN IN CEREALS MARKET, BY REGION, 2018-2032 (USD THOUSAND)
TABLE 54 NORTH AMERICA GERM IN CEREALS MARKET, BY REGION, 2018-2032 (USD THOUSAND)
TABLE 55 NORTH AMERICA OTHERS IN CEREALS MARKET, BY REGION, 2018-2032 (USD THOUSAND)
TABLE 56 NORTH AMERICA CEREALS MARKET, BY PROCESSING LEVEL, 2018-2032 (USD THOUSAND)
TABLE 57 NORTH AMERICA FORTIFIEDIN CEREALS MARKET, BY REGION, 2018-2032 (USD THOUSAND)
TABLE 58 NORTH AMERICA DEHUSKED IN CEREALS MARKET, BY REGION, 2018-2032 (USD THOUSAND)
TABLE 59 NORTH AMERICA POLISHED IN CEREALS MARKET, BY REGION, 2018-2032 (USD THOUSAND)
TABLE 60 NORTH AMERICA PRE-COOKED IN CEREALS MARKET, BY REGION, 2018-2032 (USD THOUSAND)
TABLE 61 NORTH AMERICA BLENDED IN CEREALS MARKET, BY REGION, 2018-2032 (USD THOUSAND)
TABLE 62 NORTH AMERICA INSTANT IN CEREALS MARKET, BY REGION, 2018-2032 (USD THOUSAND)
TABLE 63 NORTH AMERICA SPROUTED IN CEREALS MARKET, BY REGION, 2018-2032 (USD THOUSAND)
TABLE 64 NORTH AMERICA ROASTED IN CEREALS MARKET, BY REGION, 2018-2032 (USD THOUSAND)
TABLE 65 NORTH AMERICA EXTRUDED IN CEREALS MARKET, BY REGION, 2018-2032 (USD THOUSAND)
TABLE 66 NORTH AMERICA PARTIALLY COOKED IN CEREALS MARKET, BY REGION, 2018-2032 (USD THOUSAND)
TABLE 67 NORTH AMERICA MICRONIZED IN CEREALS MARKET, BY REGION, 2018-2032 (USD THOUSAND)
TABLE 68 NORTH AMERICA RAW IN CEREALS MARKET, BY REGION, 2018-2032 (USD THOUSAND)
TABLE 69 NORTH AMERICA FULLY COOKED IN CEREALS MARKET, BY REGION, 2018-2032 (USD THOUSAND)
TABLE 70 NORTH AMERICA STEAMED IN CEREALS MARKET, BY REGION, 2018-2032 (USD THOUSAND)
TABLE 71 NORTH AMERICA SEASONED IN CEREALS MARKET, BY REGION, 2018-2032 (USD THOUSAND)
TABLE 72 NORTH AMERICA SWEETENED IN CEREALS MARKET, BY REGION, 2018-2032 (USD THOUSAND)
TABLE 73 NORTH AMERICA COATED IN CEREALS MARKET, BY REGION, 2018-2032 (USD THOUSAND)
TABLE 74 NORTH AMERICA OTHERS IN CEREALS MARKET, BY REGION, 2018-2032 (USD THOUSAND)
TABLE 75 NORTH AMERICA CEREALS MARKET, BY CONSUMPTION FORMAT, 2018-2032 (USD THOUSAND)
TABLE 76 NORTH AMERICA SPOON-EATEN WITH MILK/YOGURT IN CEREALS MARKET, BY REGION, 2018-2032 (USD THOUSAND)
TABLE 77 NORTH AMERICA ON-THE-GO BARS IN CEREALS MARKET, BY REGION, 2018-2032 (USD THOUSAND)
TABLE 78 NORTH AMERICA PORRIDGE IN CEREALS MARKET, BY REGION, 2018-2032 (USD THOUSAND)
TABLE 79 NORTH AMERICA DRY SNACK IN CEREALS MARKET, BY REGION, 2018-2032 (USD THOUSAND)
TABLE 80 NORTH AMERICA SNACK PACKS IN CEREALS MARKET, BY REGION, 2018-2032 (USD THOUSAND)
TABLE 81 NORTH AMERICA READY-TO-COOK IN CEREALS MARKET, BY REGION, 2018-2032 (USD THOUSAND)
TABLE 82 NORTH AMERICA READY-TO-HEAT IN CEREALS MARKET, BY REGION, 2018-2032 (USD THOUSAND)
TABLE 83 NORTH AMERICA MIX-IN INGREDIENT IN CEREALS MARKET, BY REGION, 2018-2032 (USD THOUSAND)
TABLE 84 NORTH AMERICA BEVERAGE-INFUSED IN CEREALS MARKET, BY REGION, 2018-2032 (USD THOUSAND)
TABLE 85 NORTH AMERICA OTHERS IN CEREALS MARKET, BY REGION, 2018-2032 (USD THOUSAND)
TABLE 86 NORTH AMERICA CEREALS MARKET, BY PRODUCT CATEGORY, 2018-2032 (USD THOUSAND)
TABLE 87 NORTH AMERICA BAKERY INGREDIENTS (FLOUR/GRAIN BLENDS) IN CEREALS MARKET, BY REGION, 2018-2032 (USD THOUSAND)
TABLE 88 NORTH AMERICA BREAKFAST CEREALS IN CEREALS MARKET, BY REGION, 2018-2032 (USD THOUSAND)
TABLE 89 NORTH AMERICA BREAKFAST CEREALS IN CEREALS MARKET, BY TYPE, 2018-2032 (USD THOUSAND)
TABLE 90 NORTH AMERICA READY-TO-EAT (RTE) IN CEREALS MARKET, BY TYPE, 2018-2032 (USD THOUSAND)
TABLE 91 NORTH AMERICA HOT CEREALS IN CEREALS MARKET, BY TYPE, 2018-2032 (USD THOUSAND)
TABLE 92 NORTH AMERICA FEEDSTOCK/ANIMAL FEED CEREALS MARKET, BY REGION, 2018-2032 (USD THOUSAND)
TABLE 93 NORTH AMERICA CEREAL SNACKS IN CEREALS MARKET, BY REGION, 2018-2032 (USD THOUSAND)
TABLE 94 NORTH AMERICA CEREAL SNACKS IN CEREALS MARKET, BY TYPE, 2018-2032 (USD THOUSAND)
TABLE 95 NORTH AMERICA INSTANT CEREAL MIXES IN CEREALS MARKET, BY REGION, 2018-2032 (USD THOUSAND)
TABLE 96 NORTH AMERICA INFANT CEREALS IN CEREALS MARKET, BY REGION, 2018-2032 (USD THOUSAND)
TABLE 97 NORTH AMERICA INFANT CEREALS IN CEREALS MARKET, BY TYPE, 2018-2032 (USD THOUSAND)
TABLE 98 NORTH AMERICA CEREAL-BASED MEAL KITS IN CEREALS MARKET, BY REGION, 2018-2032 (USD THOUSAND)
TABLE 99 NORTH AMERICA BREWING/DISTILLING INPUTS IN CEREALS MARKET, BY REGION, 2018-2032 (USD THOUSAND)
TABLE 100 NORTH AMERICA OTHERS IN CEREALS MARKET, BY REGION, 2018-2032 (USD THOUSAND)
TABLE 101 NORTH AMERICA CEREALS MARKET, BY NATURE, 2018-2032 (USD THOUSAND)
TABLE 102 NORTH AMERICA CONVENTIONAL IN CEREALS MARKET, BY REGION, 2018-2032 (USD THOUSAND)
TABLE 103 NORTH AMERICA ORGANIC IN CEREALS MARKET, BY REGION, 2018-2032 (USD THOUSAND)
TABLE 104 NORTH AMERICA CEREALS MARKET, BY CATEGORY, 2018-2032 (USD THOUSAND)
TABLE 105 NORTH AMERICA GMO-BASED IN CEREALS MARKET, BY REGION, 2018-2032 (USD THOUSAND)
TABLE 106 NORTH AMERICA NON-GMO CERTIFIED IN CEREALS MARKET, BY REGION, 2018-2032 (USD THOUSAND)
TABLE 107 NORTH AMERICA CEREALS MARKET, BY FUNCTIONAL BENEFITS, 2018-2032 (USD THOUSAND)
TABLE 108 NORTH AMERICA VITAMIN-FORTIFIED IN CEREALS MARKET, BY REGION, 2018-2032 (USD THOUSAND)
TABLE 109 NORTH AMERICA HIGH-FIBER IN CEREALS MARKET, BY REGION, 2018-2032 (USD THOUSAND)
TABLE 110 NORTH AMERICA LOW/NO SUGAR IN CEREALS MARKET, BY REGION, 2018-2032 (USD THOUSAND)
TABLE 111 NORTH AMERICA HIGH-PROTEIN IN CEREALS MARKET, BY REGION, 2018-2032 (USD THOUSAND)
TABLE 112 NORTH AMERICA GLUTEN-FREE IN CEREALS MARKET, BY REGION, 2018-2032 (USD THOUSAND)
TABLE 113 NORTH AMERICA HEART-HEALTHY IN CEREALS MARKET, BY REGION, 2018-2032 (USD THOUSAND)
TABLE 114 NORTH AMERICA PROBIOTIC/PREBIOTIC ENHANCED IN CEREALS MARKET, BY REGION, 2018-2032 (USD THOUSAND)
TABLE 115 NORTH AMERICA CHOLESTEROL-LOWERING IN CEREALS MARKET, BY REGION, 2018-2032 (USD THOUSAND)
TABLE 116 NORTH AMERICA LOW GLYCEMIC INDEX IN CEREALS MARKET, BY REGION, 2018-2032 (USD THOUSAND)
TABLE 117 NORTH AMERICA OMEGA-3 ENRICHED IN CEREALS MARKET, BY REGION, 2018-2032 (USD THOUSAND)
TABLE 118 NORTH AMERICA LOW FAT IN CEREALS MARKET, BY REGION, 2018-2032 (USD THOUSAND)
TABLE 119 NORTH AMERICA ALLERGEN-FREE IN CEREALS MARKET, BY REGION, 2018-2032 (USD THOUSAND)
TABLE 120 NORTH AMERICA HIGH-IRON IN CEREALS MARKET, BY REGION, 2018-2032 (USD THOUSAND)
TABLE 121 NORTH AMERICA LOW/NO SALT IN CEREALS MARKET, BY REGION, 2018-2032 (USD THOUSAND)
TABLE 122 NORTH AMERICA PALEO-FRIENDLY IN CEREALS MARKET, BY REGION, 2018-2032 (USD THOUSAND)
TABLE 123 NORTH AMERICA KETO-FRIENDLY IN CEREALS MARKET, BY REGION, 2018-2032 (USD THOUSAND)
TABLE 124 NORTH AMERICA VEGAN-CERTIFIED IN CEREALS MARKET, BY REGION, 2018-2032 (USD THOUSAND)
TABLE 125 NORTH AMERICA OTHERS IN CEREALS MARKET, BY REGION, 2018-2032 (USD THOUSAND)
TABLE 126 NORTH AMERICA CEREALS MARKET, BY SHELF LIFE, 2018-2032 (USD THOUSAND)
TABLE 127 NORTH AMERICA LONG-TERM (AMBIENT SHELF-STABLE) IN CEREALS MARKET, BY REGION, 2018-2032 (USD THOUSAND)
TABLE 128 NORTH AMERICA MEDIUM-TERM IN CEREALS MARKET, BY REGION, 2018-2032 (USD THOUSAND)
TABLE 129 NORTH AMERICA SHORT-TERM (PERISHABLE) IN CEREALS MARKET, BY REGION, 2018-2032 (USD THOUSAND)
TABLE 130 NORTH AMERICA CEREALS MARKET, BY PACKAGING, 2018-2032 (USD THOUSAND)
TABLE 131 NORTH AMERICA BOX IN CEREALS MARKET, BY REGION, 2018-2032 (USD THOUSAND)
TABLE 132 NORTH AMERICA BOX IN CEREAL MARKET, BY TYPE, 2018-2032 (USD THOUSAND)
TABLE 133 NORTH AMERICA POUCH IN CEREALS MARKET, BY REGION, 2018-2032 (USD THOUSAND)
TABLE 134 NORTH AMERICA POUCH IN CEREAL MARKET, BY TYPE, 2018-2032 (USD THOUSAND)
TABLE 135 NORTH AMERICA BAG IN CEREALS MARKET, BY REGION, 2018-2032 (USD THOUSAND)
TABLE 136 NORTH AMERICA BAG IN CEREAL MARKET, BY TYPE, 2018-2032 (USD THOUSAND)
TABLE 137 NORTH AMERICA SACHET/STICK PACK IN CEREALS MARKET, BY REGION, 2018-2032 (USD THOUSAND)
TABLE 138 NORTH AMERICA SACK (BULK) IN CEREALS MARKET, BY REGION, 2018-2032 (USD THOUSAND)
TABLE 139 NORTH AMERICA JAR IN CEREALS MARKET, BY REGION, 2018-2032 (USD THOUSAND)
TABLE 140 NORTH AMERICA JAR IN CEREAL MARKET, BY TYPE, 2018-2032 (USD THOUSAND)
TABLE 141 NORTH AMERICA TETRA PACK / ASEPTIC CARTON IN CEREALS MARKET, BY REGION, 2018-2032 (USD THOUSAND)
TABLE 142 NORTH AMERICA CANISTER IN CEREALS MARKET, BY REGION, 2018-2032 (USD THOUSAND)
TABLE 143 NORTH AMERICA DRUM IN CEREALS MARKET, BY REGION, 2018-2032 (USD THOUSAND)
TABLE 144 NORTH AMERICA ECO-PACKAGING IN CEREALS MARKET, BY REGION, 2018-2032 (USD THOUSAND)
TABLE 145 NORTH AMERICA ECO-PACKAGING IN CEREAL MARKET, BY TYPE, 2018-2032 (USD THOUSAND)
TABLE 146 NORTH AMERICA ECO-PACKAGING IN CEREALS MARKET, BY REGION, 2018-2032 (USD THOUSAND)
TABLE 147 NORTH AMERICA CEREALS MARKET, BY PACKAGING-SIZE, 2018-2032 (USD THOUSAND)
TABLE 148 NORTH AMERICA SMALL PACKS (51G–250G) IN CEREALS MARKET, BY REGION, 2018-2032 (USD THOUSAND)
TABLE 149 NORTH AMERICA MEDIUM PACKS (251G–500G) IN CEREALS MARKET, BY REGION, 2018-2032 (USD THOUSAND)
TABLE 150 NORTH AMERICA LARGE PACKS (501G–1KG) IN CEREALS MARKET, BY REGION, 2018-2032 (USD THOUSAND)
TABLE 151 NORTH AMERICA SINGLE SERVE PACKS (BELOW 50G) IN CEREALS MARKET, BY REGION, 2018-2032 (USD THOUSAND)
TABLE 152 NORTH AMERICA EXTRA LARGE PACKS (1.1KG–2.5KG) IN CEREALS MARKET, BY REGION, 2018-2032 (USD THOUSAND)
TABLE 153 NORTH AMERICA BULK PACKS (ABOVE 2.5KG) IN CEREALS MARKET, BY REGION, 2018-2032 (USD THOUSAND)
TABLE 154 NORTH AMERICA CEREALS MARKET, BY PRICE RANGE, 2018-2032 (USD THOUSAND)
TABLE 155 NORTH AMERICA ECONOMY (UPTO USD 2.49) IN CEREALS MARKET, BY REGION, 2018-2032 (USD THOUSAND)
TABLE 156 NORTH AMERICA MID-RANGE (USD 2.50-6.99) IN CEREALS MARKET, BY REGION, 2018-2032 (USD THOUSAND)
TABLE 157 NORTH AMERICA PREMIUM (USD 7.00 AND ABOVE) IN CEREALS MARKET, BY REGION, 2018-2032 (USD THOUSAND)
TABLE 158 NORTH AMERICA CEREALS MARKET, BY DISTRIBUTION CHANNEL, 2018-2032 (USD THOUSAND)
TABLE 159 NORTH AMERICA B2B IN CEREALS MARKET, BY REGION, 2018-2032 (USD THOUSAND)
TABLE 160 NORTH AMERICA B2C IN CEREALS MARKET, BY REGION, 2018-2032 (USD THOUSAND)
TABLE 161 NORTH AMERICA B2C IN CEREAL MARKET, BY TYPE, 2018-2032 (USD THOUSAND)
TABLE 162 NORTH AMERICA ONLINE IN CEREAL MARKET, BY TYPE, 2018-2032 (USD THOUSAND)
TABLE 163 NORTH AMERICA OFFLINE IN CEREAL MARKET, BY TYPE, 2018-2032 (USD THOUSAND)
TABLE 164 NORTH AMERICA CEREALS MARKET, BY COUNTRY, 2018-2032 (USD THOUSAND)
TABLE 165 NORTH AMERICA CEREALS MARKET, BY CEREAL TYPE, 2018-2032 (USD THOUSAND)
TABLE 166 NORTH AMERICA CEREALS MARKET, BY CEREAL TYPE, 2018-2032 (THOUSAND TONS)
TABLE 167 NORTH AMERICA WHEAT IN CEREALS MARKET, BY TYPE, 2018-2032 (USD THOUSAND)
TABLE 168 NORTH AMERICA RICE IN CEREALS MARKET, BY TYPE, 2018-2032 (USD THOUSAND)
TABLE 169 NORTH AMERICA MAIZE(CORN) IN CEREALS MARKET, BY TYPE, 2018-2032 (USD THOUSAND)
TABLE 170 NORTH AMERICA BARLEY IN CEREALS MARKET, BY TYPE, 2018-2032 (USD THOUSAND)
TABLE 171 NORTH AMERICA OATS IN CEREALS MARKET, BY TYPE, 2018-2032 (USD THOUSAND)
TABLE 172 NORTH AMERICA RYE IN CEREALS MARKET, BY TYPE, 2018-2032 (USD THOUSAND)
TABLE 173 NORTH AMERICA SORGHUM IN CEREALS MARKET, BY TYPE, 2018-2032 (USD THOUSAND)
TABLE 174 NORTH AMERICA MILLET IN CEREALS MARKET, BY TYPE, 2018-2032 (USD THOUSAND)
TABLE 175 NORTH AMERICA QUINOA IN CEREALS MARKET, BY TYPE, 2018-2032 (USD THOUSAND)
TABLE 176 NORTH AMERICA CEREALS MARKET, BY PRODUCT FORM, 2018-2032 (USD THOUSAND)
TABLE 177 NORTH AMERICA CEREALS MARKET, BY PROCESSING LEVEL, 2018-2032 (USD THOUSAND)
TABLE 178 NORTH AMERICA CEREALS MARKET, BY CONSUMPTION FORMAT, 2018-2032 (USD THOUSAND)
TABLE 179 NORTH AMERICA CEREALS MARKET, BY PRODUCT CATEGORY, 2018-2032 (USD THOUSAND)
TABLE 180 NORTH AMERICA BREAKFAST CEREALS IN CEREALS MARKET, BY TYPE, 2018-2032 (USD THOUSAND)
TABLE 181 NORTH AMERICA READY-TO-EAT (RTE) IN CEREALS MARKET, BY TYPE, 2018-2032 (USD THOUSAND)
TABLE 182 NORTH AMERICA HOT CEREALS IN CEREALS MARKET, BY TYPE, 2018-2032 (USD THOUSAND)
TABLE 183 NORTH AMERICA CEREAL SNACKS IN CEREALS MARKET, BY TYPE, 2018-2032 (USD THOUSAND)
TABLE 184 NORTH AMERICA INFANT CEREALS IN CEREALS MARKET, BY TYPE, 2018-2032 (USD THOUSAND)
TABLE 185 NORTH AMERICA CEREALS MARKET, BY NATURE, 2018-2032 (USD THOUSAND)
TABLE 186 NORTH AMERICA CEREALS MARKET, BY CATEGORY, 2018-2032 (USD THOUSAND)
TABLE 187 NORTH AMERICA CEREALS MARKET, BY FUNCTIONAL BENEFITS, 2018-2032 (USD THOUSAND)
TABLE 188 NORTH AMERICA CEREALS MARKET, BY SHELF LIFE, 2018-2032 (USD THOUSAND)
TABLE 189 NORTH AMERICA CEREALS MARKET, BY PACKAGING, 2018-2032 (USD THOUSAND)
TABLE 190 NORTH AMERICA BOX IN CEREALS MARKET, BY TYPE, 2018-2032 (USD THOUSAND)
TABLE 191 NORTH AMERICA POUCH IN CEREALS MARKET, BY TYPE, 2018-2032 (USD THOUSAND)
TABLE 192 NORTH AMERICA BAG IN CEREALS MARKET, BY TYPE, 2018-2032 (USD THOUSAND)
TABLE 193 NORTH AMERICA JAR IN CEREALS MARKET, BY TYPE, 2018-2032 (USD THOUSAND)
TABLE 194 NORTH AMERICA ECO-PACKAGING IN CEREALS MARKET, BY TYPE, 2018-2032 (USD THOUSAND)
TABLE 195 NORTH AMERICA CEREALS MARKET, BY PACKAGING SIZE, 2018-2032 (USD THOUSAND)
TABLE 196 NORTH AMERICA CEREALS MARKET, BY PRICE RANGE, 2018-2032 (USD THOUSAND)
TABLE 197 NORTH AMERICA CEREALS MARKET, BY DISTRIBUTION CHANNEL, 2018-2032 (USD THOUSAND)
TABLE 198 NORTH AMERICA B2C IN CEREALS MARKET, BY TYPE, 2018-2032 (USD THOUSAND)
TABLE 199 NORTH AMERICA ONLINE IN CEREALS MARKET, BY TYPE, 2018-2032 (USD THOUSAND)
TABLE 200 NORTH AMERICA OFFLINE IN CEREALS MARKET, BY TYPE, 2018-2032 (USD THOUSAND)
TABLE 201 U.S. CEREALS MARKET, BY CEREAL TYPE, 2018-2032 (USD THOUSAND)
TABLE 202 U.S. CEREALS MARKET, BY CEREAL TYPE, 2018-2032 (THOUSAND TONS)
TABLE 203 U.S. WHEAT IN CEREALS MARKET, BY TYPE, 2018-2032 (USD THOUSAND)
TABLE 204 U.S. RICE IN CEREALS MARKET, BY TYPE, 2018-2032 (USD THOUSAND)
TABLE 205 U.S. MAIZE(CORN) IN CEREALS MARKET, BY TYPE, 2018-2032 (USD THOUSAND)
TABLE 206 U.S. BARLEY IN CEREALS MARKET, BY TYPE, 2018-2032 (USD THOUSAND)
TABLE 207 U.S. OATS IN CEREALS MARKET, BY TYPE, 2018-2032 (USD THOUSAND)
TABLE 208 U.S. RYE IN CEREALS MARKET, BY TYPE, 2018-2032 (USD THOUSAND)
TABLE 209 U.S. SORGHUM IN CEREALS MARKET, BY TYPE, 2018-2032 (USD THOUSAND)
TABLE 210 U.S. MILLET IN CEREALS MARKET, BY TYPE, 2018-2032 (USD THOUSAND)
TABLE 211 U.S. QUINOA IN CEREALS MARKET, BY TYPE, 2018-2032 (USD THOUSAND)
TABLE 212 U.S. CEREALS MARKET, BY PRODUCT FORM, 2018-2032 (USD THOUSAND)
TABLE 213 U.S. CEREALS MARKET, BY PROCESSING LEVEL, 2018-2032 (USD THOUSAND)
TABLE 214 U.S. CEREALS MARKET, BY CONSUMPTION FORMAT, 2018-2032 (USD THOUSAND)
TABLE 215 U.S. CEREALS MARKET, BY PRODUCT CATEGORY, 2018-2032 (USD THOUSAND)
TABLE 216 U.S. BREAKFAST CEREALS IN CEREALS MARKET, BY TYPE, 2018-2032 (USD THOUSAND)
TABLE 217 U.S. READY-TO-EAT (RTE) IN CEREALS MARKET, BY TYPE, 2018-2032 (USD THOUSAND)
TABLE 218 U.S. HOT CEREALS IN CEREALS MARKET, BY TYPE, 2018-2032 (USD THOUSAND)
TABLE 219 U.S. CEREAL SNACKS IN CEREALS MARKET, BY TYPE, 2018-2032 (USD THOUSAND)
TABLE 220 U.S. INFANT CEREALS IN CEREALS MARKET, BY TYPE, 2018-2032 (USD THOUSAND)
TABLE 221 U.S. CEREALS MARKET, BY NATURE, 2018-2032 (USD THOUSAND)
TABLE 222 U.S. CEREALS MARKET, BY CATEGORY, 2018-2032 (USD THOUSAND)
TABLE 223 U.S. CEREALS MARKET, BY FUNCTIONAL BENEFITS, 2018-2032 (USD THOUSAND)
TABLE 224 U.S. CEREALS MARKET, BY SHELF LIFE, 2018-2032 (USD THOUSAND)
TABLE 225 U.S. CEREALS MARKET, BY PACKAGING, 2018-2032 (USD THOUSAND)
TABLE 226 U.S. BOX IN CEREALS MARKET, BY TYPE, 2018-2032 (USD THOUSAND)
TABLE 227 U.S. POUCH IN CEREALS MARKET, BY TYPE, 2018-2032 (USD THOUSAND)
TABLE 228 U.S. BAG IN CEREALS MARKET, BY TYPE, 2018-2032 (USD THOUSAND)
TABLE 229 U.S. JAR IN CEREALS MARKET, BY TYPE, 2018-2032 (USD THOUSAND)
TABLE 230 U.S. ECO-PACKAGING IN CEREALS MARKET, BY TYPE, 2018-2032 (USD THOUSAND)
TABLE 231 U.S. CEREALS MARKET, BY PACKAGING SIZE, 2018-2032 (USD THOUSAND)
TABLE 232 U.S. CEREALS MARKET, BY PRICE RANGE, 2018-2032 (USD THOUSAND)
TABLE 233 U.S. CEREALS MARKET, BY DISTRIBUTION CHANNEL, 2018-2032 (USD THOUSAND)
TABLE 234 U.S. B2C IN CEREALS MARKET, BY TYPE, 2018-2032 (USD THOUSAND)
TABLE 235 U.S. ONLINE IN CEREALS MARKET, BY TYPE, 2018-2032 (USD THOUSAND)
TABLE 236 U.S. OFFLINE IN CEREALS MARKET, BY TYPE, 2018-2032 (USD THOUSAND)
TABLE 237 CANADA CEREALS MARKET, BY CEREAL TYPE, 2018-2032 (USD THOUSAND)
TABLE 238 CANADA CEREALS MARKET, BY CEREAL TYPE, 2018-2032 (THOUSAND TONS)
TABLE 239 CANADA WHEAT IN CEREALS MARKET, BY TYPE, 2018-2032 (USD THOUSAND)
TABLE 240 CANADA RICE IN CEREALS MARKET, BY TYPE, 2018-2032 (USD THOUSAND)
TABLE 241 CANADA MAIZE(CORN) IN CEREALS MARKET, BY TYPE, 2018-2032 (USD THOUSAND)
TABLE 242 CANADA BARLEY IN CEREALS MARKET, BY TYPE, 2018-2032 (USD THOUSAND)
TABLE 243 CANADA OATS IN CEREALS MARKET, BY TYPE, 2018-2032 (USD THOUSAND)
TABLE 244 CANADA RYE IN CEREALS MARKET, BY TYPE, 2018-2032 (USD THOUSAND)
TABLE 245 CANADA SORGHUM IN CEREALS MARKET, BY TYPE, 2018-2032 (USD THOUSAND)
TABLE 246 CANADA MILLET IN CEREALS MARKET, BY TYPE, 2018-2032 (USD THOUSAND)
TABLE 247 CANADA QUINOA IN CEREALS MARKET, BY TYPE, 2018-2032 (USD THOUSAND)
TABLE 248 CANADA CEREALS MARKET, BY PRODUCT FORM, 2018-2032 (USD THOUSAND)
TABLE 249 CANADA CEREALS MARKET, BY PROCESSING LEVEL, 2018-2032 (USD THOUSAND)
TABLE 250 CANADA CEREALS MARKET, BY CONSUMPTION FORMAT, 2018-2032 (USD THOUSAND)
TABLE 251 CANADA CEREALS MARKET, BY PRODUCT CATEGORY, 2018-2032 (USD THOUSAND)
TABLE 252 CANADA BREAKFAST CEREALS IN CEREALS MARKET, BY TYPE, 2018-2032 (USD THOUSAND)
TABLE 253 CANADA READY-TO-EAT (RTE) IN CEREALS MARKET, BY TYPE, 2018-2032 (USD THOUSAND)
TABLE 254 CANADA HOT CEREALS IN CEREALS MARKET, BY TYPE, 2018-2032 (USD THOUSAND)
TABLE 255 CANADA CEREAL SNACKS IN CEREALS MARKET, BY TYPE, 2018-2032 (USD THOUSAND)
TABLE 256 CANADA INFANT CEREALS IN CEREALS MARKET, BY TYPE, 2018-2032 (USD THOUSAND)
TABLE 257 CANADA CEREALS MARKET, BY NATURE, 2018-2032 (USD THOUSAND)
TABLE 258 CANADA CEREALS MARKET, BY CATEGORY, 2018-2032 (USD THOUSAND)
TABLE 259 CANADA CEREALS MARKET, BY FUNCTIONAL BENEFITS, 2018-2032 (USD THOUSAND)
TABLE 260 CANADA CEREALS MARKET, BY SHELF LIFE, 2018-2032 (USD THOUSAND)
TABLE 261 CANADA CEREALS MARKET, BY PACKAGING, 2018-2032 (USD THOUSAND)
TABLE 262 CANADA BOX IN CEREALS MARKET, BY TYPE, 2018-2032 (USD THOUSAND)
TABLE 263 CANADA POUCH IN CEREALS MARKET, BY TYPE, 2018-2032 (USD THOUSAND)
TABLE 264 CANADA BAG IN CEREALS MARKET, BY TYPE, 2018-2032 (USD THOUSAND)
TABLE 265 CANADA JAR IN CEREALS MARKET, BY TYPE, 2018-2032 (USD THOUSAND)
TABLE 266 CANADA ECO-PACKAGING IN CEREALS MARKET, BY TYPE, 2018-2032 (USD THOUSAND)
TABLE 267 CANADA CEREALS MARKET, BY PACKAGING SIZE, 2018-2032 (USD THOUSAND)
TABLE 268 CANADA CEREALS MARKET, BY PRICE RANGE, 2018-2032 (USD THOUSAND)
TABLE 269 CANADA CEREALS MARKET, BY DISTRIBUTION CHANNEL, 2018-2032 (USD THOUSAND)
TABLE 270 CANADA B2C IN CEREALS MARKET, BY TYPE, 2018-2032 (USD THOUSAND)
TABLE 271 CANADA ONLINE IN CEREALS MARKET, BY TYPE, 2018-2032 (USD THOUSAND)
TABLE 272 CANADA OFFLINE IN CEREALS MARKET, BY TYPE, 2018-2032 (USD THOUSAND)
TABLE 273 MEXICO CEREALS MARKET, BY CEREAL TYPE, 2018-2032 (USD THOUSAND)
TABLE 274 MEXICO CEREALS MARKET, BY CEREAL TYPE, 2018-2032 (THOUSAND TONS)
TABLE 275 MEXICO WHEAT IN CEREALS MARKET, BY TYPE, 2018-2032 (USD THOUSAND)
TABLE 276 MEXICO RICE IN CEREALS MARKET, BY TYPE, 2018-2032 (USD THOUSAND)
TABLE 277 MEXICO MAIZE(CORN) IN CEREALS MARKET, BY TYPE, 2018-2032 (USD THOUSAND)
TABLE 278 MEXICO BARLEY IN CEREALS MARKET, BY TYPE, 2018-2032 (USD THOUSAND)
TABLE 279 MEXICO OATS IN CEREALS MARKET, BY TYPE, 2018-2032 (USD THOUSAND)
TABLE 280 MEXICO RYE IN CEREALS MARKET, BY TYPE, 2018-2032 (USD THOUSAND)
TABLE 281 MEXICO SORGHUM IN CEREALS MARKET, BY TYPE, 2018-2032 (USD THOUSAND)
TABLE 282 MEXICO MILLET IN CEREALS MARKET, BY TYPE, 2018-2032 (USD THOUSAND)
TABLE 283 MEXICO QUINOA IN CEREALS MARKET, BY TYPE, 2018-2032 (USD THOUSAND)
TABLE 284 MEXICO CEREALS MARKET, BY PRODUCT FORM, 2018-2032 (USD THOUSAND)
TABLE 285 MEXICO CEREALS MARKET, BY PROCESSING LEVEL, 2018-2032 (USD THOUSAND)
TABLE 286 MEXICO CEREALS MARKET, BY CONSUMPTION FORMAT, 2018-2032 (USD THOUSAND)
TABLE 287 MEXICO CEREALS MARKET, BY PRODUCT CATEGORY, 2018-2032 (USD THOUSAND)
TABLE 288 MEXICO BREAKFAST CEREALS IN CEREALS MARKET, BY TYPE, 2018-2032 (USD THOUSAND)
TABLE 289 MEXICO READY-TO-EAT (RTE) IN CEREALS MARKET, BY TYPE, 2018-2032 (USD THOUSAND)
TABLE 290 MEXICO HOT CEREALS IN CEREALS MARKET, BY TYPE, 2018-2032 (USD THOUSAND)
TABLE 291 MEXICO CEREAL SNACKS IN CEREALS MARKET, BY TYPE, 2018-2032 (USD THOUSAND)
TABLE 292 MEXICO INFANT CEREALS IN CEREALS MARKET, BY TYPE, 2018-2032 (USD THOUSAND)
TABLE 293 MEXICO CEREALS MARKET, BY NATURE, 2018-2032 (USD THOUSAND)
TABLE 294 MEXICO CEREALS MARKET, BY CATEGORY, 2018-2032 (USD THOUSAND)
TABLE 295 MEXICO CEREALS MARKET, BY FUNCTIONAL BENEFITS, 2018-2032 (USD THOUSAND)
TABLE 296 MEXICO CEREALS MARKET, BY SHELF LIFE, 2018-2032 (USD THOUSAND)
TABLE 297 MEXICO CEREALS MARKET, BY PACKAGING, 2018-2032 (USD THOUSAND)
TABLE 298 MEXICO BOX IN CEREALS MARKET, BY TYPE, 2018-2032 (USD THOUSAND)
TABLE 299 MEXICO POUCH IN CEREALS MARKET, BY TYPE, 2018-2032 (USD THOUSAND)
TABLE 300 MEXICO BAG IN CEREALS MARKET, BY TYPE, 2018-2032 (USD THOUSAND)
TABLE 301 MEXICO JAR IN CEREALS MARKET, BY TYPE, 2018-2032 (USD THOUSAND)
TABLE 302 MEXICO ECO-PACKAGING IN CEREALS MARKET, BY TYPE, 2018-2032 (USD THOUSAND)
TABLE 303 MEXICO CEREALS MARKET, BY PACKAGING SIZE, 2018-2032 (USD THOUSAND)
TABLE 304 MEXICO CEREALS MARKET, BY PRICE RANGE, 2018-2032 (USD THOUSAND)
TABLE 305 MEXICO CEREALS MARKET, BY DISTRIBUTION CHANNEL, 2018-2032 (USD THOUSAND)
TABLE 306 MEXICO B2C IN CEREALS MARKET, BY TYPE, 2018-2032 (USD THOUSAND)
TABLE 307 MEXICO ONLINE IN CEREALS MARKET, BY TYPE, 2018-2032 (USD THOUSAND)
TABLE 308 MEXICO OFFLINE IN CEREALS MARKET, BY TYPE, 2018-2032 (USD THOUSAND)
List of Figure
FIGURE 1 NORTH AMERICA CEREALS MARKET
FIGURE 2 NORTH AMERICA CEREALS MARKET: DATA TRIANGULATION
FIGURE 3 NORTH AMERICA CEREALS MARKET: DROC ANALYSIS
FIGURE 4 NORTH AMERICA CEREALS MARKET: NORTH AMERICA VS REGIONAL MARKET ANALYSIS
FIGURE 5 NORTH AMERICA CEREALS MARKET: COMPANY RESEARCH ANALYSIS
FIGURE 6 NORTH AMERICA CEREALS MARKET: MULTIVARIATE MODELLING
FIGURE 7 CEREAL TYPE TIME LINE CURVE
FIGURE 8 NORTH AMERICA CEREALS MARKET: INTERVIEW DEMOGRAPHICS
FIGURE 9 NORTH AMERICA CEREALS MARKET: DBMR MARKET POSITION GRID
FIGURE 10 NORTH AMERICA CEREALS MARKET: VENDOR SHARE ANALYSIS
FIGURE 11 NORTH AMERICA CEREALS MARKET: SEGMENTATION
FIGURE 12 NORTH AMERICA CEREALS MARKET: STRATEGIC DECISIONS
FIGURE 13 NORTH AMERICA CEREALS MARKET: EXECUTIVE SUMMARY
FIGURE 14 SIXTEEN SEGMENTS COMPRISE THE NORTH AMERICA CEREALS MARKET: BY CEREAL TYPE
FIGURE 15 RISING DEMAND FOR NUTRITIONAL AND FUNCTIONAL FOODS IS EXPECTED TO DRIVE THE NORTH AMERICA CEREALS MARKET IN THE FORECAST PERIOD
FIGURE 16 WHEAT SEGMENT IS EXPECTED TO ACCOUNT FOR THE LARGEST SHARE OF THE NORTH AMERICA CEREALS MARKET IN 2025 AND 2032
FIGURE 17 PRODUCT AND BRAND OVERVIEW
FIGURE 18 PRODUCTION CAPACITY OUTLOOK
FIGURE 19 VALUE CHAIN ANALYSIS
FIGURE 20 FIGURE: CEREALS MARKET SUPPLY CHAIN ANALYSIS
FIGURE 21 COMPANY EVALUATION QUADRANT
FIGURE 22 TOTAL NUMBER OF DEALS
FIGURE 23 DEALS BY TYPE
FIGURE 24 DEALS BY SEGMENT
FIGURE 25 CEREAL MARKET PRICE TREND ANALYSIS
FIGURE 26 PATENT FAMILIES
FIGURE 27 PATENT FAMILIES
FIGURE 28 % OF TOTAL COST TRANSPORT
FIGURE 29 IMPORTANCE SCORE (1-10)
FIGURE 30 ESTIMATED SHARE (%)
FIGURE 31 DRIVERS, RESTRAINTS, OPPORTUNITIES AND CHALLENGES OF NORTH AMERICA CEREALS MARKET
FIGURE 32 NORTH AMERICA CEREALS MARKET: BY CEREAL TYPE, 2024
FIGURE 33 NORTH AMERICA CEREALS MARKET: PRODUCT FORM, 2024
FIGURE 34 NORTH AMERICA CEREALS MARKET: BY PROCESSING LEVEL, 2024
FIGURE 35 NORTH AMERICA CEREALS MARKET: BY CONSUMPTION FORMAT, 2024
FIGURE 36 NORTH AMERICA CEREALS MARKET: BY PRODUCT CATEGORY, 2024
FIGURE 37 NORTH AMERICA CEREALS MARKET: BY NATURE, 2024
FIGURE 38 NORTH AMERICA CEREALS MARKET: BY CATEGORY, 2024
FIGURE 39 NORTH AMERICA CEREALS MARKET: BY FUNCTIONAL BENEFITS, 2024
FIGURE 40 NORTH AMERICA CEREALS MARKET: BY SHELF LIFE, 2024
FIGURE 41 NORTH AMERICA CEREALS MARKET: BY PACKAGING, 2024
FIGURE 42 NORTH AMERICA CEREALS MARKET: BY PACKAGING-SIZE, 2024
FIGURE 43 NORTH AMERICA CEREALS MARKET: BY PRICE RANGE, 2024
FIGURE 44 NORTH AMERICA CEREALS MARKET: BY DISTRIBUTION CHANNEL, 2024
FIGURE 45 NORTH AMERICA CEREALS MARKET: SNAPSHOT(2024)
FIGURE 46 NORTH AMERICA CEREALS MARKET: COMPANY SHARE 2024 (%)
North America Cereals Market, Supply Chain Analysis and Ecosystem Framework
To support market growth and help clients navigate the impact of geopolitical shifts, DBMR has integrated in-depth supply chain analysis into its North America Cereals Market research reports. This addition empowers clients to respond effectively to global changes affecting their industries. The supply chain analysis section includes detailed insights such as North America Cereals Market consumption and production by country, price trend analysis, the impact of tariffs and geopolitical developments, and import and export trends by country and HSN code. It also highlights major suppliers with data on production capacity and company profiles, as well as key importers and exporters. In addition to research, DBMR offers specialized supply chain consulting services backed by over a decade of experience, providing solutions like supplier discovery, supplier risk assessment, price trend analysis, impact evaluation of inflation and trade route changes, and comprehensive market trend analysis.
Data collection and base year analysis are done using data collection modules with large sample sizes. The stage includes obtaining market information or related data through various sources and strategies. It includes examining and planning all the data acquired from the past in advance. It likewise envelops the examination of information inconsistencies seen across different information sources. The market data is analysed and estimated using market statistical and coherent models. Also, market share analysis and key trend analysis are the major success factors in the market report. To know more, please request an analyst call or drop down your inquiry.
The key research methodology used by DBMR research team is data triangulation which involves data mining, analysis of the impact of data variables on the market and primary (industry expert) validation. Data models include Vendor Positioning Grid, Market Time Line Analysis, Market Overview and Guide, Company Positioning Grid, Patent Analysis, Pricing Analysis, Company Market Share Analysis, Standards of Measurement, Global versus Regional and Vendor Share Analysis. To know more about the research methodology, drop in an inquiry to speak to our industry experts.
Data Bridge Market Research is a leader in advanced formative research. We take pride in servicing our existing and new customers with data and analysis that match and suits their goal. The report can be customized to include price trend analysis of target brands understanding the market for additional countries (ask for the list of countries), clinical trial results data, literature review, refurbished market and product base analysis. Market analysis of target competitors can be analyzed from technology-based analysis to market portfolio strategies. We can add as many competitors that you require data about in the format and data style you are looking for. Our team of analysts can also provide you data in crude raw excel files pivot tables (Fact book) or can assist you in creating presentations from the data sets available in the report.


