
North America Cheese Spread Market
Market Size in USD Million
 USD
918.07 Million
USD
1,433.75 Million
2025
2033
USD
918.07 Million
USD
1,433.75 Million
2025
2033
| 2026 - 2033 | |
| USD 918.07 Million | |
| USD 1,433.75 Million | |
| % | |
|
North America Cheese Spread Market Size
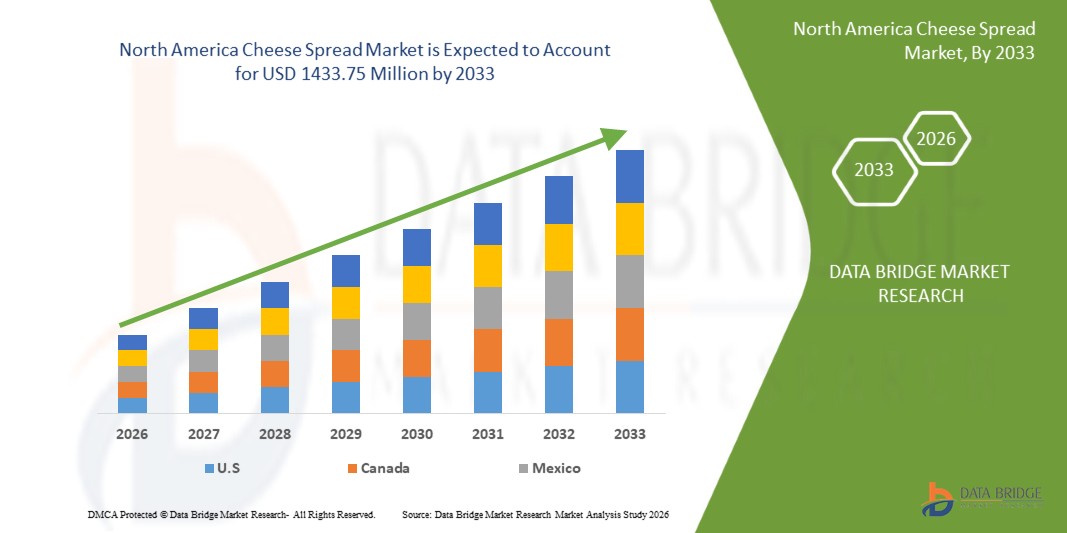
- The North America Cheese Spread Market size was valued at USD 918.07 Million in 2025 and is expected to reach USD 1433.75 Million by 2033, at a CAGR of 5.8% during the forecast period
- The rising preference for convenient and ready-to-use food products, combined with the broad culinary applications and versatility of cheese spreads, is driving strong demand across the region. Cheese spreads are increasingly used in snacks, bakery items, quick meals, and foodservice applications, making them an attractive option for both consumers and manufacturers seeking convenience, flavor variety, and ease of use.
- The expansion of organized retail and online sales channels, along with the rapid growth of foodservice and quick-service restaurants, is further strengthening the market reach. Improved product visibility, wider distribution networks, and increased availability across modern trade platforms and digital marketplaces are making cheese spreads more accessible to a broader consumer base.
North America Cheese Spread Market Analysis
- The rapid expansion of modern retail networks, supermarkets, and e-commerce platforms across Europe is driving higher accessibility and visibility of cheese spreads, enabling consumers to explore a wider variety of products, including premium, organic, and flavored options.
- At the same time, changing lifestyles, increasing urbanization, and growing preference for convenient, ready-to-use foods are boosting demand for versatile cheese spreads suitable for breakfast, snacks, and quick meals.
- U.S. is the dominant country in the Europe North America Cheese Spread Market market, accounting for over 79.44% market share in 2026, driven by its high per capita cheese consumption, strong presence of established dairy brands, well-developed distribution channels, and growing interest in premium, functional, and plant-based cheese spread variants.
- U.S. is the fastest-growing country in the region, with a CAGR of 5.8%, supported by increasing consumer demand for fresh, artisanal, and gourmet cheese spreads, strong culinary culture, Mediterranean diet influence, and rising adoption of premium and locally sourced products in both retail and foodservice channels.
- Processed cheese spreads is dominating with a market share of 46.85% in 2026. This segment is driven by consumer preference for convenience, ready-to-use functionality, long shelf life, and versatility across meals, snacks, sandwiches, and bakery applications. Strong adoption in households and foodservice sectors further reinforces its leading position.
Report Scope and North America Cheese Spread Market Segmentation
|
Attributes |
North America Cheese Spread Key Market Insights |
|
Segments Covered |
|
|
Countries Covered |
|
|
Key Market Players |
|
|
Market Opportunities |
|
|
Value Added Data Infosets |
In addition to the insights on market scenarios such as market value, growth rate, segmentation, geographical coverage, and major players, the market reports curated by the Data Bridge Market Research also include in-depth expert analysis, pricing analysis, brand share analysis, consumer survey, demography analysis, supply chain analysis, value chain analysis, raw material/consumables overview, vendor selection criteria, PESTLE Analysis, Porter Analysis, and regulatory framework. |
North America Cheese Spread Market Trends
“Rising preference for convenient and ready-to-use foods”
- Changing lifestyles, urbanization, and dual-income households are driving demand for convenient, ready-to-use foods. Cheese spreads fit this trend as they require minimal preparation and are versatile across meals, from sandwiches and breakfast to dips for gatherings.
- Global and regional studies highlight this shift: a January 2026 poll in the U.K. found 62% of Gen Z have less time to cook, with many turning to ready-to-eat snacks and quick meals. Similarly, United states ready-to-cook meals category grew 58% in 2024, reflecting a broader preference for time-saving foods.
- Consumers worldwide are increasingly incorporating convenience foods into daily routines, particularly younger and urban demographics, emphasizing ease of use and minimal preparation as key motivators.
- Leading brands are aligning with this trend: Kraft markets cheese spreads as ready-to-use for quick meals, while The Laughing Cow offers plant-based variants, showing innovation driven by convenience and dietary preferences.
- Over 55% of daily calories in the U.S. come from ultra-processed foods, with youth consuming nearly 62%, indicating strong consumer demand for ready-to-use, minimal-prep products like cheese spreads.
North America Cheese Spread Market Dynamics
Driver
Broad culinary applications and usage versatility
- Cheese spreads are highly versatile, usable directly as sandwich fillings, breakfast toppings, dips, or sauce ingredients, appealing to both households and foodservice providers by reducing preparation time while serving multiple consumption occasions.
- Products with multi-functional applications tend to see higher adoption, as they provide greater value to consumers and fit seamlessly into varied meal occasions.
- Flavor and format diversity—including plain, flavored, herb-infused, and light/low-fat options—enhances appeal and allows consumers to integrate cheese spreads into snacks, quick meals, or elaborate dishes.
- Brands like The Laughing Cow and Alouette actively promote creative uses, from stuffed jalapeños and zucchini bites to creamy pasta sauces and baked appetizers, encouraging experimentation beyond traditional spreads.
- Foodservice adoption, such as cheese sauces for macaroni, nachos, and dips in quick-service restaurants, highlights their utility in professional kitchens where consistency, versatility, and minimal preparation are critical.
Restraint/Challenge
Volatility in dairy raw material prices
- Dairy raw material price volatility, especially milk, presents a major challenge for cheese spread manufacturers, as milk constitutes the largest share of production costs. Fluctuations caused by seasonal supply changes, climate conditions, feed cost inflation, and supply-chain disruptions increase cost risk and compress profit margins.
- The FAO Dairy Price Index illustrates this unpredictability: in September, it averaged 152.6 points, 1.3% lower than July but 16.2% higher than August 2024, highlighting persistent volatility in international dairy commodity prices, including milk, butter, and cheese.
- European dairy markets also show volatility: in October 2025, cheese and milk powder prices in Europe aligned unusually at ~€3,580 per tonne, signaling margin pressure and instability in core dairy inputs that directly affects cheese spread production costs.
- Overall, raw material price fluctuations increase operational and financial risk, complicate forecasting, and discourage investment in production capacity, acting as a key restraint on regional North America Cheese Spread Market growth.
North America Cheese Spread Market Scope
The North America Cheese Spread Market is segmented into twelve notable segments based on the product type, nature, cheese type, source, flavor, claim, brand category, price, packaging, packaging quantity, end use and distribution channel.
- By product type
On the basis of product type, the North America Cheese Spread Market is segmented into fresh cheese spreads, processed cheese spreads, and curds / soft cheese spreads. In 2026, the processed cheese spreads segment is expected to dominate the market with a 46.85% share, driven by strong consumer preference for convenient, ready-to-use products. Its versatility across meals, snacks, and foodservice applications further reinforces its leading position in the North America region.
The fresh cheese spreads segment is projected to grow the fastest from 2026 to 2033, at a CAGR of 6.1%, driven by increasing consumer demand for natural, minimally processed, and flavorful dairy options that cater to health-conscious and premium-seeking segments.
- By nature
On the basis of nature, the North America Cheese Spread Market is segmented into conventional and organic. In 2026, the conventional segment is expected to dominate the market with a 76.34% share, supported by widespread consumer familiarity, cost-effectiveness, and strong distribution across retail and foodservice channels.
The organic segment is expected to grow the fastest from 2026 to 2033 at a CAGR of 6.1%, driven by rising consumer awareness of health and wellness, increasing preference for natural and chemical-free products, and growing demand for sustainably sourced and clean-label dairy options.
- By cheese type
On the basis of cheese type, the North America Cheese Spread Market is segmented into mozzarella, parmesan, cheddar, ricotta, feta, gouda, cream cheese, blue cheese, and others. In 2026, the cheddar segment is expected to dominate the market with a 27.74% share, driven by its widespread consumer preference, versatile culinary applications, and strong presence in both retail and foodservice channels.
The cheddar segment is expected to grow the fastest from 2026 to 2033 at a CAGR of 6.4%, driven by increasing consumer demand for flavorful, versatile cheeses, rising adoption in ready-to-eat meals and snacks, and expanding usage in foodservice and quick-service restaurant applications.
- By source
On the basis of source, the North America Cheese Spread Market is segmented into animal-based and plant-based types. In 2026, the animal-based segment is expected to dominate the market with an 85.34% share, driven by strong consumer preference for traditional dairy products, wide availability, and established usage in both household and foodservice applications.
The plant-based segment is expected to grow the fastest from 2026 to 2033 at a CAGR of 6.2%, driven by rising consumer interest in vegan and lactose-free alternatives, increasing health consciousness, and growing demand for sustainable and environmentally friendly dairy substitutes.
- By flavor
On the basis of flavor, the North America Cheese Spread Market is segmented into plain and flavored types. In 2026, the plain segment is expected to dominate the market with a 61.42% share, driven by widespread consumer preference for classic flavors, versatility in culinary applications, and strong adoption across both household and foodservice settings.
The flavored segment is expected to grow the fastest from 2026 to 2033 at a CAGR of 6.1%, driven by increasing consumer demand for variety and indulgence, rising interest in innovative and gourmet flavors, and the growing trend of personalized and experiential food choices.
- By claim
On the basis of claim, the North America Cheese Spread Market is segmented into with claims and regular / without claims. In 2026, the regular/without-claims segment is expected to dominate the market with a 77.50% share, driven by strong consumer familiarity, cost-effectiveness, and widespread availability across retail and foodservice channels.
The With claims segment is expected to grow the fastest from 2026 to 2033 at a CAGR of 6.2%, driven by increasing consumer demand for functional and fortified foods, rising health awareness, and growing preference for products offering added nutritional or wellness benefits.
- By brand category
On the basis of brand category, the North America Cheese Spread Market is segmented into branded and private label products. In 2026, the branded segment is expected to dominate the market with a 67.40% share, driven by strong brand recognition, consumer trust, wide distribution networks, and consistent quality assurance across retail and foodservice channels.
The branded segment is expected to grow the fastest from 2026 to 2033 at a CAGR of 5.9%, driven by increasing consumer preference for trusted brands, rising awareness of product quality and safety, and the expansion of organized retail and e-commerce channels.
- By price
On the basis of price, the North America Cheese Spread Market is segmented into up to 5 USD, 5–15 USD, 15–30 USD, and above 30 USD categories. In 2026, the USD 5–15 price segment is expected to dominate the market with a 38.71% share, driven by its balance of affordability and perceived value, appealing to a broad consumer base across households and foodservice channels.
The USD 15–30 price segment is expected to grow the fastest from 2026 to 2033 at a CAGR of 6.3%, driven by increasing demand for premium and specialty cheese spreads, rising disposable incomes, and consumer willingness to pay more for quality, flavor variety, and innovative products.
- By packaging
On the basis of packaging, the North America Cheese Spread Market is segmented into jars / tubs / cups, plastic, glass, pouches / squeeze packs, foil-wrapped, and others. In 2026, the jars/tubs/cups segment is expected to dominate the market with a 35.72% share, driven by convenience, ease of use, portion control, and wide adoption across households and foodservice applications.
The pouches/squeeze packs segment is expected to grow the fastest from 2026 to 2033 at a CAGR of 6.5%, driven by increasing demand for portable, mess-free, and on-the-go packaging formats that offer convenience, portion control, and reduced product wastage.
- By packaging quantity
On the basis of packaging quantity, the North America Cheese Spread Market is segmented into less than 100 g, 100–250 g, 250–500 g, 500–1000 g, and more than 1000 g. In 2026, the 100–250 g segment is expected to dominate the market with a 42.71% share, driven by its optimal balance of affordability, convenience, and suitability for household consumption and everyday use.
The less than 100 g segment is expected to grow the fastest from 2026 to 2033 at a CAGR of 6.2%, driven by rising demand for single-serve and trial-size portions, on-the-go consumption, and growing consumer preference for convenient, portable packaging.
- By end use
On the basis of end use, the North America Cheese Spread Market is segmented into household and commercial. In 2026, the commercial segment is expected to dominate the market with a 60.41% share, driven by strong demand from foodservice outlets, quick-service restaurants, and catering businesses that rely on bulk cheese spread products for consistent quality and ease of use.
The household segment is expected to grow the fastest from 2026 to 2033 at a CAGR of 6.1%, driven by increasing home consumption, rising preference for convenient and ready-to-use cheese spreads, and growing adoption of diverse flavors and formats for everyday meals and snacks.
- By distribution channel
On the basis of distribution channel, the North America Cheese Spread Market is segmented into B2C and B2B channels. In 2026, the B2C segment is expected to dominate the market with a 67.15% share, driven by strong retail penetration, growing e-commerce adoption, and increasing consumer demand for convenient, ready-to-use cheese spread products for home consumption.
The B2B segment is expected to grow the fastest from 2026 to 2033 at a CAGR of 6.1%, driven by rising demand from foodservice providers, quick-service restaurants, and catering businesses seeking bulk, consistent, and easy-to-use cheese spread products for operational efficiency.
North America Cheese Spread Market Country-wise Analysis
- U.S dominated the North America Cheese Spread Market with a 79.4% revenue share in 2025, driven by rising urbanization, increasing disposable incomes, growing Western-style food adoption, and expanding modern retail and e-commerce channels.
- Key drivers of the North America Cheese Spread Market include rising urbanization, increasing disposable incomes, and growing adoption of Western-style foods. Current trends shaping the market are the demand for convenient and ready-to-use products, the introduction of flavored and plant-based cheese spreads, and the expansion of modern retail and e-commerce channels, all of which are enhancing product accessibility and consumer adoption across the region.
China North America Cheese Spread Market Insight
The U.S. North America Cheese Spread Market accounted for a significant 79.4% share within North America in 2025, due to rising urbanization, increasing disposable incomes, growing adoption of Western-style foods, and the expansion of modern retail and e-commerce channels.
Canada North America Cheese Spread Market Insight
The Canada North America Cheese Spread Market is the fastest-growing in North America over the forecast period, driven by increasing urbanization, rising disposable incomes, growing demand for convenient and ready-to-use dairy products, and expanding organized retail and e-commerce channels.
Mexico North America Cheese Spread Market Insight
The Mexico North America Cheese Spread Market is expected to register steady growth over the forecast period due to rising demand for convenient and ready-to-use foods, growing adoption of Western-style diets, and increasing popularity of cheese-based snacks and meal accompaniments.
The Major Market Leaders Operating in the Market Are:
- Lactalis (France)
- Kraft Heinz (U.S.)
- Fonterra Co-Operative Group (New Zealand)
- Arla Foods (Denmark)
- Dairy Farmers Of America (U.S.)
- Savencia Fromage & Dairy (France)
- Saputo Inc. (Canada)
- Bega Cheese Ltd. (Australia)
- Almarai (Saudi Arabia)
- Britannia Industries Ltd. (India)
- Amul (India)
- The Bel Group (France)
- Cabot Creamery (U.S.)
- Parag Milk Foods Pvt Ltd (India)
- Tillamook (U.S.)
- Verka (India)
- Milky Mist Dairy Food Private Limited (India)
- Gokul Dairy (India)
- Franklin Foods (U.S.)
- Milkana Cheese (India)
- Fromagerie Germain (Canada)
- Pine River Pre-Pack Inc (U.S.)
- Crave Brothers (U.S.)
- Merkts Cheese Company (U.S.)
- Adirondack Cheese Company (U.S.)
- Longley Farm (U.K.)
- Scott’s Of Wisconsin (U.S.)
- The Swiss Colony (U.S.)
- Schreiber Dynamix Dairies Ltd. (India)
- Sargento (U.S.)
Latest Developments in North America Cheese Spread Market
- In July 2025, Cabot Creamery, the farmer-owned cooperative renowned for its commitment to quality and award-winning taste, introduced Gouda Cheese Snack Bars to its convenience line. This latest launch of “Cabot Gouda snack sized bars” offers the same rich, creamy texture and sweet, nutty flavor that make it perfect for cooking, entertaining, or everyday snacking. Alongside the new snack bars, Cabot Gouda remains available in 8 oz bars and cracker cuts, providing consumers with versatile and convenient options. This launch helps the company expand its product portfolio, reach new consumers, and strengthen its position in the snacking and convenience market.
- In August 2025, Crave Brothers Farmstead Cheese proudly announced it earned five top-three finishes at the 2025 World Dairy Expo Championship Dairy Product Contest, including 1st place for Mascarpone, 2nd place for Fresh Mozzarella Medallions, Farmers Rope String Cheese, and Chocolate Mascarpone, and 3rd place for Oaxaca Knot. These honors reinforce the family-owned company’s reputation for producing award-winning, high-quality artisanal cheeses and are expected to strengthen its market presence and brand recognition.
- In August 2025, Dairy Farmers of America (DFA) acquired W&W Dairy, a US manufacturer of Hispanic cheeses, including its business, licensed brands, and Monroe, Wisconsin, manufacturing facility. The facility produces queso fresco, cotija, queso blanco, and quesadilla, and its addition will create operational synergies with DFA’s Houston plant, enhancing production capacity and market reach for the La Vaquita brand. This strategic move positions DFA to capitalize on the rapidly growing Hispanic cheese market, strengthen its cheese capabilities, and deliver greater value to its farmer-owners.
- In March 2023, Franklin Foods expanded its portfolio with SimplyV, a plant-based cream cheese made from an almond base and free from dairy, soy, palm oil, lactose, and gluten. Available in 8-oz bars and cups with flavors like original, strawberry, and onion & chive, SimplyV is designed for cooking, baking, and spreading, supporting plant-based diets while maintaining the creamy taste and quality Franklin Foods is known for.
SKU-

- Interactive Data Analysis Dashboard
- Company Analysis Dashboard for high growth potential opportunities
- Research Analyst Access for customization & queries
- Competitor Analysis with Interactive dashboard
- Latest News, Updates & Trend analysis
- Harness the Power of Benchmark Analysis for Comprehensive Competitor Tracking
Table of Content
1 INTRODUCTION
1.1 OBJECTIVES OF THE STUDY
1.2 MARKET DEFINITION
1.3 OVERVIEW OF NORTH AMERICA CHEESE SPREAD MARKET
1.4 LIMITATIONS
1.5 MARKETS COVERED
2 MARKET SEGMENTATION
2.1 MARKETS COVERED
2.2 GEOGRAPHICAL SCOPE
2.3 YEARS CONSIDERED FOR THE STUDY
2.4 CURRENCY AND PRICING
2.5 DBMR TRIPOD DATA VALIDATION MODEL
2.6 MULTIVARIATE MODELING
2.7 PRIMARY INTERVIEWS WITH KEY OPINION LEADERS
2.8 DBMR MARKET POSITION GRID
2.9 MARKET END USER COVERAGE GRID
2.1 VENDOR SHARE ANALYSIS
2.11 SECONDARY SOURCES
2.12 ASSUMPTIONS
3 EXECUTIVE SUMMARY
4 PREMIUM INSIGHTS
4.1 PORTER’S FIVE FORCES
4.2 INNOVATION TRACKER AND STRATEGIC ANALYSIS
4.2.1 MAJOR DEALS AND STRATEGIC ALLIANCES ANALYSIS
4.2.1.1 JOINT VENTURES
4.2.1.2 MERGERS AND ACQUISITIONS
4.2.1.3 LICENSING AND PARTNERSHIP
4.2.1.4 TECHNOLOGY COLLABORATIONS
4.2.1.5 STRATEGIC DIVESTMENTS
4.2.2 NUMBER OF PRODUCTS IN DEVELOPMENT
4.2.3 STAGE OF DEVELOPMENT
4.2.4 TIMELINES AND MILESTONES
4.2.5 INNOVATION STRATEGIES AND METHODOLOGIES
4.2.6 RISK ASSESSMENT AND MITIGATION
4.2.7 FUTURE OUTLOOK
4.3 RAW MATERIAL COVERAGE – NORTH AMERICA CHEESE SPREAD MARKET
4.3.1 MILK AND DAIRY INGREDIENTS (LIQUID MILK, CREAM, WHEY)
4.3.2 DAIRY CULTURES, ENZYMES, AND ADDITIVES
4.3.3 PACKAGING-RELATED INPUTS AND SUPPLY CONSTRAINTS
4.3.4 REAL-WORLD SUPPLY SHOCKS IMPACTING RAW MATERIALS
4.3.5 REGIONAL RAW MATERIAL SUPPLY DYNAMICS
4.3.6 STRATEGIC DIVERSIFICATION OF RAW MATERIAL SUPPLY
4.3.7 QUALITY, COMPLIANCE, AND TRACEABILITY
4.4 TECHNOLOGICAL ADVANCEMENTS
4.4.1 PRODUCT INNOVATION AND FUNCTIONAL CHEESE SPREAD TECHNOLOGIES
4.4.2 ADVANCEMENTS IN DAIRY CHEMISTRY AND SPREAD FORMULATIONS
4.4.3 DIGITALIZATION, AUTOMATION, AND SMART MANUFACTURING
4.4.4 SUSTAINABILITY AND ECO-FRIENDLY CHEESE SPREAD INNOVATIONS
4.4.5 PLANT-BASED AND NOVEL INGREDIENT INTEGRATION
4.4.6 CONSUMER EXPERIENCE AND MARKET ACCEPTANCE
4.5 BRAND OUTLOOK
4.5.1 BRAND COMPARATIVE ANALYSIS
4.5.2 CONCLUSION
4.5.3 COMPANY VS BRAND OVERVIEW
4.5.4 CONCLUSION
4.6 CLIMATE CHANGE SCENARIO
4.6.1 ENVIRONMENTAL CONCERNS
4.6.2 INDUSTRY RESPONSE
4.6.3 GOVERNMENT’S ROLE
4.6.4 ANALYST RECOMMENDATION
4.7 CONSUMER BUYING BEHAVIOUR ANALYSIS
4.7.1 URBAN AFFLUENT FAMILIES
4.7.2 URBAN MIDDLE-INCOME FAMILIES
4.7.3 YOUNG PROFESSIONALS & MILLENNIALS\
4.7.4 PRICE-SENSITIVE HOUSEHOLDS
4.7.5 HEALTH-CONSCIOUS CONSUMERS
4.7.6 RURAL & SEMI-URBAN CONSUMERS
4.7.7 CONCLUSION
4.8 COST ANALYSIS BREAKDOWN
4.8.1 INTRODUCTION
4.8.2 MARKET COST STRUCTURE OVERVIEW
4.8.3 RAW MATERIAL AND INGREDIENT COST ANALYSIS
4.8.4 PROCESSING AND PACKAGING COST DYNAMICS
4.8.5 LOGISTICS AND DISTRIBUTION COST ASSESSMENT
4.8.6 REGULATORY AND COMPLIANCE IMPACT ON NET COST
4.8.7 TOTAL COST OF OWNERSHIP (TCO) ANALYSIS
4.8.8 STRATEGIC MARKET IMPLICATIONS
4.8.9 CONCLUSION
4.9 INDUSTRY ECO-SYSTEM ANALYSIS
4.9.1 PROMINENT COMPANIES
4.9.2 SMALL & MEDIUM SIZE COMPANIES
4.9.3 END USERS
4.1 VALUE CHAIN ANALYSIS
4.10.1 OVERVIEW:
4.10.2 RAW MATERIAL SOURCING:
4.10.3 PROCESSING AND MANUFACTURING:
4.10.4 PACKAGING AND LABELING:
4.10.5 DISTRIBUTION AND LOGISTICS:
4.10.6 MARKETING, SALES, AND END CONSUMPTION:
4.10.7 CONCLUSION:
4.11 SUPPLY CHAIN ANALYSIS
4.11.1 OVERVIEW:
4.11.2 RAW MATERIAL SUPPLIERS:
4.11.3 MANUFACTURERS:
4.11.4 DISTRIBUTORS:
4.11.5 END USERS:
4.11.6 CONCLUSION:
4.12 PRODUCTION CONSUMPTION ANALYSIS
4.12.1 DAIRY SUPPLY FUNDAMENTALS SUPPORTING CHEESE SPREAD PRODUCTION
4.12.2 NORTH AMERICA PRODUCTION LANDSCAPE AND KEY MANUFACTURING REGIONS
4.12.3 CONSUMPTION TRENDS AND REGIONAL DEMAND DYNAMICS
4.12.4 OVERALL PRODUCTION–CONSUMPTION BALANCE AND MARKET OUTLOOK
4.13 PROFIT MARGINS SCENARIO
4.13.1 OVERVIEW
4.13.2 KEY MARGIN DRIVERS:
4.13.3 STRATEGIC INSIGHTS FOR MARGIN OPTIMIZATION:
4.14 PRICING ANALYSIS
4.15 VENDOR SELECTION CRITERIA
4.15.1 PRODUCT QUALITY, TASTE PROFILE, AND CONSISTENCY
4.15.2 MANUFACTURING CAPABILITY AND PROCESS TECHNOLOGY
4.15.3 PRODUCT PORTFOLIO BREADTH AND CUSTOMIZATION CAPABILITY
4.15.4 SUPPLY RELIABILITY AND OPERATIONAL SCALABILITY
4.15.5 REGULATORY COMPLIANCE AND FOOD SAFETY STANDARDS
4.15.6 COST COMPETITIVENESS AND TOTAL VALUE PROPOSITION
4.15.7 TECHNICAL SUPPORT AND CUSTOMER SERVICE CAPABILITY
4.15.8 CONCLUSION
5 TARIFFS & IMPACT ON THE MARKET
5.1 CURRENT TARIFF RATES IN TOP-5 COUNTRY MARKETS
5.2 OUTLOOK: LOCAL PRODUCTION VERSUS IMPORT RELIANCE
5.3 VENDOR SELECTION CRITERIA DYNAMICS
5.4 IMPACT ON SUPPLY CHAIN
5.4.1 RAW MATERIAL PROCUREMENT
5.4.2 MANUFACTURING AND PRODUCTION
5.4.3 LOGISTICS AND DISTRIBUTION
5.4.4 PRICE PITCHING AND MARKET POSITION
5.5 INDUSTRY PARTICIPANTS: PROACTIVE MOVES
5.5.1 SUPPLY CHAIN OPTIMISATION
5.5.2 JOINT VENTURE ESTABLISHMENTS
5.6 IMPACT ON PRICES
5.7 REGULATORY INCLINATION
5.7.1 GEOPOLITICAL SITUATION
5.7.2 TRADE PARTNERSHIPS BETWEEN THE COUNTRIES
5.7.2.1 FREE TRADE AGREEMENTS
5.7.2.2 ALLIANCES ESTABLISHMENTS
5.7.3 STATUS ACCREDITATION (INCLUDING MFTN)
5.7.4 DOMESTIC COURSE OF CORRECTION
5.7.4.1 INCENTIVE SCHEMES TO BOOST PRODUCTION OUTPUTS
5.7.4.2 ESTABLISHMENT OF SPECIAL ECONOMIC ZONES/INDUSTRIAL PARKS
6 REGULATION COVERAGE
6.1 PRODUCT CODES / REGULATORY CLASSIFICATION
6.2 CERTIFIED STANDARDS
6.3 SAFETY STANDARDS
6.4 MATERIAL HANDLING & STORAGE
6.5 TRANSPORT & PRECAUTIONS
6.6 HAZARD IDENTIFICATION
7 MARKET OVERVIEW
7.1 DRIVERS
7.1.1 RISING PREFERENCE FOR CONVENIENT AND READY-TO-USE FOODS
7.1.2 BROAD CULINARY APPLICATIONS AND USAGE VERSATILITY
7.1.3 EXPANSION OF ORGANIZED RETAIL AND ONLINE SALES CHANNELS
7.1.4 EXPANSION OF FOODSERVICE AND QUICK-SERVICE RESTAURANTS
7.2 RESTRAINTS
7.2.1 VOLATILITY IN DAIRY RAW MATERIAL PRICES
7.2.2 SUPPLY CHAIN AND COLD-CHAIN LOGISTICS CONSTRAINTS
7.3 OPPORTUNITIES
7.3.1 HIGH GROWTH POTENTIAL IN EMERGING ECONOMIES
7.3.2 INNOVATION AND PREMIUM PRODUCT DEVELOPMENT
7.3.3 GROWING DEMAND FOR SUSTAINABLE AND CLEAN-LABEL PRODUCTS
7.4 CHALLENGES
7.4.1 REGULATORY AND COMPLIANCE CHALLENGES
7.4.2 INTENSIFYING COMPETITION FROM ALTERNATIVE SPREADS
8 NORTH AMERICA CHEESE SPREAD MARKET, BY PRODUCT TYPE
8.1 OVERVIEW
8.2 PROCESSED CHEESE SPREADS
8.3 FRESH CHEESE SPREADS
8.4 CURDS / SOFT CHEESE SPREADS
8.5 NORTH AMERICA PROCESSED CHEESE SPREADS IN CHEESE SPREAD MARKET, BY TYPE, 2018-2033 (USD THOUSAND)
8.5.1 WHIPPED/SOFT PROCESSED CHEESE SPREAD
8.5.2 CREAM CHEESE BLOCKS
8.5.3 SPREADABLE CHEESE PORTIONS
8.6 NORTH AMERICA PROCESSED CHEESE SPREADS IN CHEESE SPREAD MARKET, BY REGION, 2018-2033 (USD THOUSAND)
8.6.1 EUROPE
8.6.2 NORTH AMERICA
8.6.3 ASIA-PACIFIC
8.6.4 MIDDLE EAST & AFRICA
8.6.5 SOUTH AMERICA
8.7 NORTH AMERICA FRESH CHEESE SPREADS IN CHEESE SPREAD MARKET, BY TYPE, 2018-2033 (USD THOUSAND)
8.7.1 PLAIN
8.7.2 FLAVORED
8.8 NORTH AMERICA FRESH CHEESE SPREADS IN CHEESE SPREAD MARKET, BY REGION, 2018-2033 (USD THOUSAND)
8.8.1 EUROPE
8.8.2 NORTH AMERICA
8.8.3 ASIA-PACIFIC
8.8.4 MIDDLE EAST & AFRICA
8.8.5 SOUTH AMERICA
8.9 NORTH AMERICA CURDS / SOFT CHEESE SPREADS IN CHEESE SPREAD MARKET, BY TYPE, 2018-2033 (USD THOUSAND)
8.9.1 COTTAGE CHEESE
8.9.2 QUARK / TVAROH
8.9.3 GOAT / SHEEP SOFT CHEESE
8.1 NORTH AMERICA COTTAGE CHEESE IN CHEESE SPREAD MARKET, BY TYPE, 2018-2033 (USD THOUSAND)
8.10.1 PLAIN
8.10.2 FLAVORED / HERB
8.11 NORTH AMERICA QUARK / TVAROH IN CHEESE SPREAD MARKET, BY TYPE, 2018-2033 (USD THOUSAND)
8.11.1 PLAIN
8.11.2 FLAVORED / HERB
8.12 NORTH AMERICA GOAT / SHEEP SOFT CHEESE IN CHEESE SPREAD MARKET, BY TYPE, 2018-2033 (USD THOUSAND)
8.12.1 PLAIN
8.12.2 FLAVORED / HERB
8.13 NORTH AMERICA CURDS / SOFT CHEESE SPREADS IN CHEESE SPREAD MARKET, BY REGION, 2018-2033 (USD THOUSAND)
8.13.1 EUROPE
8.13.2 NORTH AMERICA
8.13.3 ASIA-PACIFIC
8.13.4 MIDDLE EAST & AFRICA
8.13.5 SOUTH AMERICA
9 NORTH AMERICA CHEESE SPREAD MARKET, BY NATURE
9.1 OVERVIEW
9.2 CONVENTIONAL
9.3 ORGANIC
9.4 NORTH AMERICA CONVENTIONAL IN CHEESE SPREAD MARKET, BY REGION, 2018-2033 (USD THOUSAND)
9.4.1 EUROPE
9.4.2 NORTH AMERICA
9.4.3 ASIA-PACIFIC
9.4.4 MIDDLE EAST & AFRICA
9.4.5 SOUTH AMERICA
9.5 NORTH AMERICA ORGANIC IN CHEESE SPREAD MARKET, BY REGION, 2018-2033 (USD THOUSAND)
9.5.1 EUROPE
9.5.2 NORTH AMERICA
9.5.3 ASIA-PACIFIC
9.5.4 MIDDLE EAST & AFRICA
9.5.5 SOUTH AMERICA
10 NORTH AMERICA CHEESE SPREAD MARKET, BY CHEESE TYPE
10.1 OVERVIEW
10.2 CHEDDAR
10.3 MOZZARELLA
10.4 CREAM CHEESE
10.5 PARMESAN
10.6 GOUDA
10.7 RICOTTA
10.8 FETA
10.9 BLUE CHEESE
10.1 OTHERS
10.11 NORTH AMERICA CHEDDAR IN CHEESE SPREAD MARKET, BY REGION, 2018-2033 (USD THOUSAND)
10.11.1 EUROPE
10.11.2 NORTH AMERICA
10.11.3 ASIA-PACIFIC
10.11.4 MIDDLE EAST & AFRICA
10.11.5 SOUTH AMERICA
10.12 NORTH AMERICA MOZZARELLA IN CHEESE SPREAD MARKET, BY REGION, 2018-2033 (USD THOUSAND)
10.12.1 EUROPE
10.12.2 NORTH AMERICA
10.12.3 ASIA-PACIFIC
10.12.4 MIDDLE EAST & AFRICA
10.12.5 SOUTH AMERICA
10.13 NORTH AMERICA CREAM CHEESE IN CHEESE SPREAD MARKET, BY REGION, 2018-2033 (USD THOUSAND)
10.13.1 EUROPE
10.13.2 NORTH AMERICA
10.13.3 ASIA-PACIFIC
10.13.4 MIDDLE EAST & AFRICA
10.13.5 SOUTH AMERICA
10.14 NORTH AMERICA PARMESAN IN CHEESE SPREAD MARKET, BY REGION, 2018-2033 (USD THOUSAND)
10.14.1 EUROPE
10.14.2 NORTH AMERICA
10.14.3 ASIA-PACIFIC
10.14.4 MIDDLE EAST & AFRICA
10.14.5 SOUTH AMERICA
10.15 NORTH AMERICA GOUDA IN CHEESE SPREAD MARKET, BY REGION, 2018-2033 (USD THOUSAND)
10.15.1 EUROPE
10.15.2 NORTH AMERICA
10.15.3 ASIA-PACIFIC
10.15.4 MIDDLE EAST & AFRICA
10.15.5 SOUTH AMERICA
10.16 NORTH AMERICA RICOTTA IN CHEESE SPREAD MARKET, BY REGION, 2018-2033 (USD THOUSAND)
10.16.1 EUROPE
10.16.2 NORTH AMERICA
10.16.3 ASIA-PACIFIC
10.16.4 MIDDLE EAST & AFRICA
10.16.5 SOUTH AMERICA
10.17 NORTH AMERICA FETA IN CHEESE SPREAD MARKET, BY REGION, 2018-2033 (USD THOUSAND)
10.17.1 EUROPE
10.17.2 NORTH AMERICA
10.17.3 ASIA-PACIFIC
10.17.4 MIDDLE EAST & AFRICA
10.17.5 SOUTH AMERICA
10.18 NORTH AMERICA BLUE CHEESE IN CHEESE SPREAD MARKET, BY REGION, 2018-2033 (USD THOUSAND)
10.18.1 EUROPE
10.18.2 NORTH AMERICA
10.18.3 ASIA-PACIFIC
10.18.4 MIDDLE EAST & AFRICA
10.18.5 SOUTH AMERICA
10.19 NORTH AMERICA OTHERS IN CHEESE SPREAD MARKET, BY REGION, 2018-2033 (USD THOUSAND)
10.19.1 EUROPE
10.19.2 NORTH AMERICA
10.19.3 ASIA-PACIFIC
10.19.4 MIDDLE EAST & AFRICA
10.19.5 SOUTH AMERICA
11 NORTH AMERICA CHEESE SPREAD MARKET, BY SOURCE
11.1 OVERVIEW
11.2 ANIMAL-BASED
11.3 PLANT-BASED
11.4 NORTH AMERICA ANIMAL-BASED IN CHEESE SPREAD MARKET, BY TYPE, 2018-2033 (USD THOUSAND)
11.4.1 COW MILK
11.4.2 GOAT MILK
11.4.3 SHEEP MILK
11.4.4 OTHERS
11.5 NORTH AMERICA ANIMAL-BASED IN CHEESE SPREAD MARKET, BY REGION, 2018-2033 (USD THOUSAND)
11.5.1 EUROPE
11.5.2 NORTH AMERICA
11.5.3 ASIA-PACIFIC
11.5.4 MIDDLE EAST & AFRICA
11.5.5 SOUTH AMERICA
11.6 NORTH AMERICA PLANT-BASED IN CHEESE SPREAD MARKET, BY TYPE, 2018-2033 (USD THOUSAND)
11.6.1 CASHEW MILK
11.6.2 ALMOND MILK
11.6.3 SOY MILK
11.6.4 COCONUT MILK
11.6.5 OTHERS
11.7 NORTH AMERICA PLANT-BASED IN CHEESE SPREAD MARKET, BY REGION, 2018-2033 (USD THOUSAND)
11.7.1 EUROPE
11.7.2 NORTH AMERICA
11.7.3 ASIA-PACIFIC
11.7.4 MIDDLE EAST & AFRICA
11.7.5 SOUTH AMERICA
12 NORTH AMERICA CHEESE SPREAD MARKET, BY FLAVOR
12.1 OVERVIEW
12.2 PLAIN
12.3 FLAVORED
12.4 NORTH AMERICA PLAIN IN CHEESE SPREAD MARKET, BY REGION, 2018-2033 (USD THOUSAND)
12.4.1 EUROPE
12.4.2 NORTH AMERICA
12.4.3 ASIA-PACIFIC
12.4.4 MIDDLE EAST & AFRICA
12.4.5 SOUTH AMERICA
12.5 NORTH AMERICA FLAVORED IN CHEESE SPREAD MARKET, BY TYPE, 2018-2033 (USD THOUSAND)
12.5.1 GARLIC & HERBS
12.5.2 CREAMY
12.5.3 MIX HERB
12.5.4 CHIVE
12.5.5 ONION
12.5.6 TOMATO & BASIL
12.5.7 JALAPENO
12.5.8 BELL PEPPER
12.5.9 HOT PEPPER
12.5.10 EARTHY
12.5.11 TANGY & TART
12.5.12 OTHERS
12.6 NORTH AMERICA FLAVORED IN CHEESE SPREAD MARKET, BY REGION, 2018-2033 (USD THOUSAND)
12.6.1 EUROPE
12.6.2 NORTH AMERICA
12.6.3 ASIA-PACIFIC
12.6.4 MIDDLE EAST & AFRICA
12.6.5 SOUTH AMERICA
13 NORTH AMERICA CHEESE SPREAD MARKET, BY CLAIM
13.1 OVERVIEW
13.2 REGULAR / WITHOUT CLAIMS
13.3 WITH CLAIMS
13.4 NORTH AMERICA REGULAR / WITHOUT CLAIMS IN CHEESE SPREAD MARKET, BY REGION, 2018-2033 (USD THOUSAND)
13.4.1 EUROPE
13.4.2 NORTH AMERICA
13.4.3 ASIA-PACIFIC
13.4.4 MIDDLE EAST & AFRICA
13.4.5 SOUTH AMERICA
13.5 NORTH AMERICA WITH CLAIMS IN CHEESE SPREAD MARKET, BY TYPE, 2018-2033 (USD THOUSAND)
13.5.1 LACTOSE-FREE
13.5.2 ARTIFICIAL PRESERVATIVE-FREE
13.5.3 GLUTEN-FREE
13.5.4 DAIRY-FREE (PLANT-BASED)
13.5.5 NON-GMO
13.6 NORTH AMERICA WITH CLAIMS IN CHEESE SPREAD MARKET, BY REGION, 2018-2033 (USD THOUSAND)
13.6.1 EUROPE
13.6.2 NORTH AMERICA
13.6.3 ASIA-PACIFIC
13.6.4 MIDDLE EAST & AFRICA
13.6.5 SOUTH AMERICA
14 NORTH AMERICA CHEESE SPREAD MARKET, BY BRAND CATEGORY
14.1 OVERVIEW
14.2 BRANDED
14.3 PRIVATE LABEL
14.4 NORTH AMERICA BRANDED IN CHEESE SPREAD MARKET, BY REGION, 2018-2033 (USD THOUSAND)
14.4.1 EUROPE
14.4.2 NORTH AMERICA
14.4.3 ASIA-PACIFIC
14.4.4 MIDDLE EAST & AFRICA
14.4.5 SOUTH AMERICA
14.5 NORTH AMERICA PRIVATE LABEL IN CHEESE SPREAD MARKET, BY REGION, 2018-2033 (USD THOUSAND)
14.5.1 EUROPE
14.5.2 NORTH AMERICA
14.5.3 ASIA-PACIFIC
14.5.4 MIDDLE EAST & AFRICA
14.5.5 SOUTH AMERICA
15 NORTH AMERICA CHEESE SPREAD MARKET, BY PRICE
15.1 OVERVIEW
15.2 5-15 USD
15.3 UP TO 5 USD
15.4 15-30 USD
15.5 ABOVE 30 USD
15.6 NORTH AMERICA 5-15 USD IN CHEESE SPREAD MARKET, BY REGION, 2018-2033 (USD THOUSAND)
15.6.1 EUROPE
15.6.2 NORTH AMERICA
15.6.3 ASIA-PACIFIC
15.6.4 MIDDLE EAST & AFRICA
15.6.5 SOUTH AMERICA
15.7 NORTH AMERICA UP TO 5 USD IN CHEESE SPREAD MARKET, BY REGION, 2018-2033 (USD THOUSAND)
15.7.1 EUROPE
15.7.2 NORTH AMERICA
15.7.3 ASIA-PACIFIC
15.7.4 MIDDLE EAST & AFRICA
15.7.5 SOUTH AMERICA
15.8 NORTH AMERICA 15-30 USD IN CHEESE SPREAD MARKET, BY REGION, 2018-2033 (USD THOUSAND)
15.8.1 EUROPE
15.8.2 NORTH AMERICA
15.8.3 ASIA-PACIFIC
15.8.4 MIDDLE EAST & AFRICA
15.8.5 SOUTH AMERICA
15.9 NORTH AMERICA ABOVE 30 USD IN CHEESE SPREAD MARKET, BY REGION, 2018-2033 (USD THOUSAND)
15.9.1 EUROPE
15.9.2 NORTH AMERICA
15.9.3 ASIA-PACIFIC
15.9.4 MIDDLE EAST & AFRICA
15.9.5 SOUTH AMERICA
16 NORTH AMERICA CHEESE SPREAD MARKET, BY PACKAGING
16.1 OVERVIEW
16.2 JARS / TUBS / CUPS
16.3 PLASTIC
16.4 POUCHES / SQUEEZE PACKS
16.5 GLASS
16.6 FOIL-WRAPPED
16.7 OTHERS
16.8 NORTH AMERICA JARS / TUBS / CUPS IN CHEESE SPREAD MARKET, BY REGION, 2018-2033 (USD THOUSAND)
16.8.1 EUROPE
16.8.2 NORTH AMERICA
16.8.3 ASIA-PACIFIC
16.8.4 MIDDLE EAST & AFRICA
16.8.5 SOUTH AMERICA
16.9 NORTH AMERICA PLASTIC IN CHEESE SPREAD MARKET, BY REGION, 2018-2033 (USD THOUSAND)
16.9.1 EUROPE
16.9.2 NORTH AMERICA
16.9.3 ASIA-PACIFIC
16.9.4 MIDDLE EAST & AFRICA
16.9.5 SOUTH AMERICA
16.1 NORTH AMERICA POUCHES / SQUEEZE PACKS IN CHEESE SPREAD MARKET, BY REGION, 2018-2033 (USD THOUSAND)
16.10.1 EUROPE
16.10.2 NORTH AMERICA
16.10.3 ASIA-PACIFIC
16.10.4 MIDDLE EAST & AFRICA
16.10.5 SOUTH AMERICA
16.11 NORTH AMERICA GLASS IN CHEESE SPREAD MARKET, BY REGION, 2018-2033 (USD THOUSAND)
16.11.1 EUROPE
16.11.2 NORTH AMERICA
16.11.3 ASIA-PACIFIC
16.11.4 MIDDLE EAST & AFRICA
16.11.5 SOUTH AMERICA
16.12 NORTH AMERICA FOIL-WRAPPED IN CHEESE SPREAD MARKET, BY REGION, 2018-2033 (USD THOUSAND)
16.12.1 EUROPE
16.12.2 NORTH AMERICA
16.12.3 ASIA-PACIFIC
16.12.4 MIDDLE EAST & AFRICA
16.12.5 SOUTH AMERICA
16.13 NORTH AMERICA OTHERS IN CHEESE SPREAD MARKET, BY REGION, 2018-2033 (USD THOUSAND)
16.13.1 EUROPE
16.13.2 NORTH AMERICA
16.13.3 ASIA-PACIFIC
16.13.4 MIDDLE EAST & AFRICA
16.13.5 SOUTH AMERICA
17 NORTH AMERICA CHEESE SPREAD MARKET, BY PACKAGING QUANTITY
17.1 OVERVIEW
17.2 100-250 G
17.3 250-500 G
17.4 LESS THAN 100 G
17.5 500-1000 G
17.6 MORE THAN 1000 G
17.7 NORTH AMERICA 100-250 G IN CHEESE SPREAD MARKET, BY REGION, 2018-2033 (USD THOUSAND)
17.7.1 EUROPE
17.7.2 NORTH AMERICA
17.7.3 ASIA-PACIFIC
17.7.4 MIDDLE EAST & AFRICA
17.7.5 SOUTH AMERICA
17.8 NORTH AMERICA 250-500 G IN CHEESE SPREAD MARKET, BY REGION, 2018-2033 (USD THOUSAND)
17.8.1 EUROPE
17.8.2 NORTH AMERICA
17.8.3 ASIA-PACIFIC
17.8.4 MIDDLE EAST & AFRICA
17.8.5 SOUTH AMERICA
17.9 NORTH AMERICA LESS THAN 100 G IN CHEESE SPREAD MARKET, BY REGION, 2018-2033 (USD THOUSAND)
17.9.1 EUROPE
17.9.2 NORTH AMERICA
17.9.3 ASIA-PACIFIC
17.9.4 MIDDLE EAST & AFRICA
17.9.5 SOUTH AMERICA
17.1 NORTH AMERICA 500-1000 G IN CHEESE SPREAD MARKET, BY REGION, 2018-2033 (USD THOUSAND)
17.10.1 EUROPE
17.10.2 NORTH AMERICA
17.10.3 ASIA-PACIFIC
17.10.4 MIDDLE EAST & AFRICA
17.10.5 SOUTH AMERICA
17.11 NORTH AMERICA MORE THAN 1000 G IN CHEESE SPREAD MARKET, BY REGION, 2018-2033 (USD THOUSAND)
17.11.1 EUROPE
17.11.2 NORTH AMERICA
17.11.3 ASIA-PACIFIC
17.11.4 MIDDLE EAST & AFRICA
17.11.5 SOUTH AMERICA
18 NORTH AMERICA CHEESE SPREAD MARKET, BY END USE
18.1 OVERVIEW
18.2 COMMERCIAL
18.3 HOUSEHOLD
18.4 NORTH AMERICA COMMERCIAL IN CHEESE SPREAD MARKET, BY TYPE, 2018-2033 (USD THOUSAND)
18.4.1 BAKERY & CONFECTIONERY
18.4.2 RESTAURANTS
18.4.3 CAFÉS
18.4.4 HOTELS
18.4.5 HOSPITALS
18.4.6 EDUCATIONAL INSTITUTES
18.4.7 OTHERS
18.5 NORTH AMERICA RESTAURANTS IN CHEESE SPREAD MARKET, BY TYPE, 2018-2033 (USD THOUSAND)
18.5.1 QSR
18.5.2 FSR
18.6 NORTH AMERICA EDUCATIONAL INSTITUTES IN CHEESE SPREAD MARKET, BY TYPE, 2018-2033 (USD THOUSAND)
18.6.1 SCHOOLS
18.6.2 COLLEGES
18.6.3 UNIVERSITITES
18.6.4 OTHERS
18.7 NORTH AMERICA COMMERCIAL IN CHEESE SPREAD MARKET, BY REGION, 2018-2033 (USD THOUSAND)
18.7.1 EUROPE
18.7.2 NORTH AMERICA
18.7.3 ASIA-PACIFIC
18.7.4 MIDDLE EAST & AFRICA
18.7.5 SOUTH AMERICA
18.8 NORTH AMERICA HOUSEHOLD IN CHEESE SPREAD MARKET, BY REGION, 2018-2033 (USD THOUSAND)
18.8.1 EUROPE
18.8.2 NORTH AMERICA
18.8.3 ASIA-PACIFIC
18.8.4 MIDDLE EAST & AFRICA
18.8.5 SOUTH AMERICA
19 NORTH AMERICA CHEESE SPREAD MARKET, BY DISTRIBUTION CHANNEL
19.1 OVERVIEW
19.2 B2C
19.3 B2B
19.4 NORTH AMERICA B2C IN CHEESE SPREAD MARKET, BY TYPE, 2018-2033 (USD THOUSAND)
19.4.1 SUPERMARKETS / HYPERMARKETS
19.4.2 GROCERY RETAILERS
19.4.3 CONVENIENCE STORES
19.4.4 INDEPENDENT SMALL GROCERS
19.4.5 MODERN GROCERY RETAILERS
19.4.6 E-COMMERCE
19.5 NORTH AMERICA B2C IN CHEESE SPREAD MARKET, BY REGION, 2018-2033 (USD THOUSAND)
19.5.1 EUROPE
19.5.2 NORTH AMERICA
19.5.3 ASIA-PACIFIC
19.5.4 MIDDLE EAST & AFRICA
19.5.5 SOUTH AMERICA
19.6 NORTH AMERICA B2B IN CHEESE SPREAD MARKET, BY TYPE, 2018-2033 (USD THOUSAND)
19.6.1 DIRECT SUPPLY CONTRACTS
19.6.2 COMPANY-OWNED WEBSITE
19.7 NORTH AMERICA B2B IN CHEESE SPREAD MARKET, BY REGION, 2018-2033 (USD THOUSAND)
19.7.1 EUROPE
19.7.2 NORTH AMERICA
19.7.3 ASIA-PACIFIC
19.7.4 MIDDLE EAST & AFRICA
19.7.5 SOUTH AMERICA
20 NORTH AMERICA CHEESE SPREAD MARKET, BY GEOGRAPHY
20.1 NORTH AMERICA
20.1.1 U.S.
20.1.2 CANADA
20.1.3 MEXICO
21 NORTH AMERICA CHEESE SPREAD MARKET: COMPANY LANDSCAPE
21.1 COMPANY SHARE ANALYSIS: GLOBAL
22 SWOT ANALYSIS
23 COMPANY PROFILE
23.1 LACTALIS AMERICAN GROUP, INC.
23.1.1 COMPANY SNAPSHOT
23.1.2 COMPANY SHARE ANALYSIS
23.1.3 PRODUCT PORTFOLIO
23.1.4 RECENT DEVELOPMENT
23.2 THE KRAFT HEINZ COMPANY
23.2.1 COMPANY SNAPSHOT
23.2.2 REVENUE ANALYSIS
23.2.3 COMPANY SHARE ANALYSIS
23.2.4 PRODUCT PORTFOLIO
23.2.5 RECENT DEVEOPMENT
23.3 ARLA FOODS AMBA
23.3.1 COMPANY SNAPSHOT
23.3.2 COMPANY SHARE ANALYSIS
23.3.3 PRODUCT PORTFOLIO
23.3.4 RECENT DEVEOPMENT
23.4 FONTERRA CO-OPERATIVE GROUP LIMITED
23.4.1 COMPANY SNAPSHOT
23.4.2 REVENUE ANALYSIS
23.4.3 COMPANY SHARE ANALYSIS
23.4.4 PRODUCT PORTFOLIO
23.4.5 RECENT DEVELOPMENT
23.5 SAVENCIA SA.
23.5.1 COMPANY SNAPSHOT
23.5.2 REVENUE ANALYSIS
23.5.3 COMPANY SHARE ANALYSIS
23.5.4 PRODUCT PORTFOLIO
23.5.5 RECENT DEVELOPMENT
23.6 ADIRONDACK CHEESE CO.
23.6.1 COMPANY SNAPSHOT
23.6.2 PRODUCT PORTFOLIO
23.6.3 RECENT DEVEOPMENT
23.7 ALMARAI
23.7.1 COMPANY SNAPSHOT
23.7.2 REVENUE ANALYSIS
23.7.3 PRODUCT PORTFOLIO
23.7.4 RECENT DEVEOPMENT
23.8 AMUL DAIRY
23.8.1 COMPANY SNAPSHOT
23.8.2 PRODUCT PORTFOLIO
23.8.3 RECENT DEVEOPMENT
23.9 BEGA CHEESE LIMITED
23.9.1 COMPANY SNAPSHOT
23.9.2 REVENUE ANALYSIS
23.9.3 PRODUCT PORTFOLIO
23.9.4 RECENT DEVEOPMENT
23.1 CABOT CREAMERY
23.10.1 COMPANY SNAPSHOT
23.10.2 PRODUCT PORTFOLIO
23.10.3 RECENT DEVELOPMENT
23.11 CRAVE BROTHERS FARMSTEAD CHEESE LLC.
23.11.1 COMPANY SNAPSHOT
23.11.2 PRODUCT PORTFOLIO
23.11.3 RECENT DEVELOPMENT
23.12 DAIRY FARMERS OF AMERICA, INC
23.12.1 COMPANY SNAPSHOT
23.12.2 PRODUCT PORTFOLIO
23.12.3 RECENT DEVELOPMENT
23.13 FRANKLIN FOODS
23.13.1 COMPANY SNAPSHOT
23.13.2 PRODUCT PORTFOLIO
23.13.3 RECENT DEVELOPMENT
23.14 FROMAGERIE GERMAIN
23.14.1 COMPANY SNAPSHOT
23.14.2 PRODUCT PORTFOLIO
23.14.3 RECENT DEVELOPMENT
23.15 KOLHAPUR ZILLA SAHAKARI DUDH UTPADAK SANGH LTD (GOKUL)
23.15.1 COMPANY SNAPSHOT
23.15.2 PRODUCT PORTFOLIO
23.15.3 RECENT DEVELOPMENT
23.16 GOSSNER FOODS.
23.16.1 COMPANY SNAPSHOT
23.16.2 PRODUCT PORTFOLIO
23.16.3 RECENT DEVELOPMENT
23.17 LONGLEY FARM
23.17.1 COMPANY SNAPSHOT
23.17.2 PRODUCT PORTFOLIO
23.17.3 RECENT DEVELOPMENT
23.18 MERKTS
23.18.1 COMPANY SNAPSHOT
23.18.2 PRODUCT PORTFOLIO
23.18.3 RECENT DEVELOPMENT
23.19 MILKANA PROFESSIONAL (SAVENCIA FROMAGE & DAIRY INDIA PRIVATE LIMITED)
23.19.1 COMPANY SNAPSHOT
23.19.2 PRODUCT PORTFOLIO
23.19.3 RECENT DEVELOPMENT
23.2 MILKY MIST
23.20.1 COMPANY SNAPSHOT
23.20.2 PRODUCT PORTFOLIO
23.20.3 RECENT DEVELOPMENT
23.21 NUSH FOODS
23.21.1 COMPANY SNAPSHOT
23.21.2 PRODUCT PORTFOLIO
23.21.3 RECENT DEVEOPMENT
23.22 PARAG MILK FOODS
23.22.1 COMPANY SNAPSHOT
23.22.2 REVENUE ANALYSIS
23.22.3 SOLUTION PORTFOLIO
23.22.4 RECENT DEVELOPMENT/NEWS
23.23 PAWLEYS ISLAND SPECIALTY FOODS
23.23.1 COMPANY SNAPSHOT
23.23.2 PRODUCT PORTFOLIO
23.23.3 RECENT DEVEOPMENT
23.24 PINE RIVER PRE-PACK, INC.
23.24.1 COMPANY SNAPSHOT
23.24.2 PRODUCT PORTFOLIO
23.24.3 RECENT DEVELOPMENT/NEWS
23.25 SAPUTO INC,
23.25.1 COMPANY SNAPSHOT
23.25.2 REVENUE ANALYSIS
23.25.3 PRODUCT PORTFOLIO
23.25.4 RECENT DEVELOPMENT/NEWS
23.26 SARGENTO FOODS.
23.26.1 COMPANY SNAPSHOT
23.26.2 PRODUCT PORTFOLIO
23.26.3 RECENT DEVELOPMENT
23.27 SCHREIBER DYNAMI
23.27.1 COMPANY SNAPSHOT
23.27.2 PRODUCT PORTFOLIO
23.27.3 RECENT DEVELOPMENT
23.28 SCOTTS OF WISCONSIN.
23.28.1 COMPANY SNAPSHOT
23.28.2 PRODUCT PORTFOLIO
23.28.3 RECENT DEVELOPMENT
23.29 TILLAMOOK
23.29.1 COMPANY SNAPSHOT
23.29.2 PRODUCT PORTFOLIO
23.29.3 RECENT DEVEOPMENT
23.3 VERKA
23.30.1 COMPANY SNAPSHOT
23.30.2 PRODUCT PORTFOLIO
23.30.3 RECENT DEVEOPMENT
24 QUESTIONNAIRE
25 RELATED REPORT
List of Table
TABLE 1 BRAND COMPARATIVE ANALYSIS
TABLE 2 COMPANY VS BRAND OVERVIEW
TABLE 3 CONSUMER BUYING BEHAVIOUR ANALYSIS
TABLE 4 NORTH AMERICA CHEESE PRODUCTION BY LEADING COUNTRIES (2024/2025)
TABLE 5 VALUE CHAIN MARGIN BREAKDOWN
TABLE 6 PRODUCT SEGMENT MARGIN SCENARIOS
TABLE 7 ILLUSTRATIVE MARGIN SCENARIO
TABLE 8 PERCENTAGE OF DAILY CALORIC INTAKE FROM ULTRA-PROCESSED FOODS BY AGE GROUP (AUG 2021–AUG 2023):
TABLE 9 INDIA – AVERAGE TONED MILK RETAIL PRICES:
TABLE 10 U.S. AVERAGE POWER OUTAGE DURATION (2020–2025):
TABLE 11 NORTH AMERICA CHEESE SPREAD MARKET, BY PRODUCT TYPE, 2018-2033 (USD THOUSAND)
TABLE 12 NORTH AMERICA PROCESSED CHEESE SPREADS IN CHEESE SPREAD MARKET, BY TYPE, 2018-2033 (USD THOUSAND)
TABLE 13 NORTH AMERICA PROCESSED CHEESE SPREADS IN CHEESE SPREAD MARKET, BY REGION, 2018-2033 (USD THOUSAND)
TABLE 14 NORTH AMERICA FRESH CHEESE SPREADS IN CHEESE SPREAD MARKET, BY TYPE, 2018-2033 (USD THOUSAND)
TABLE 15 NORTH AMERICA FRESH CHEESE SPREADS IN CHEESE SPREAD MARKET, BY REGION, 2018-2033 (USD THOUSAND)
TABLE 16 NORTH AMERICA CURDS / SOFT CHEESE SPREADS IN CHEESE SPREAD MARKET, BY TYPE, 2018-2033 (USD THOUSAND)
TABLE 17 NORTH AMERICA COTTAGE CHEESE IN CHEESE SPREAD MARKET, BY TYPE, 2018-2033 (USD THOUSAND)
TABLE 18 NORTH AMERICA QUARK / TVAROH IN CHEESE SPREAD MARKET, BY TYPE, 2018-2033 (USD THOUSAND)
TABLE 19 NORTH AMERICA GOAT / SHEEP SOFT CHEESE IN CHEESE SPREAD MARKET, BY TYPE, 2018-2033 (USD THOUSAND)
TABLE 20 NORTH AMERICA CURDS / SOFT CHEESE SPREADS IN CHEESE SPREAD MARKET, BY REGION, 2018-2033 (USD THOUSAND)
TABLE 21 NORTH AMERICA CHEESE SPREAD MARKET, BY NATURE, 2018-2033 (USD THOUSAND)
TABLE 22 NORTH AMERICA CONVENTIONAL IN CHEESE SPREAD MARKET, BY REGION, 2018-2033 (USD THOUSAND)
TABLE 23 NORTH AMERICA ORGANIC IN CHEESE SPREAD MARKET, BY REGION, 2018-2033 (USD THOUSAND)
TABLE 24 NORTH AMERICA CHEESE SPREAD MARKET, BY CHEESE TYPE, 2018-2033 (USD THOUSAND)
TABLE 25 NORTH AMERICA CHEDDAR IN CHEESE SPREAD MARKET, BY REGION, 2018-2033 (USD THOUSAND)
TABLE 26 NORTH AMERICA MOZZARELLA IN CHEESE SPREAD MARKET, BY REGION, 2018-2033 (USD THOUSAND)
TABLE 27 NORTH AMERICA CREAM CHEESE IN CHEESE SPREAD MARKET, BY REGION, 2018-2033 (USD THOUSAND)
TABLE 28 NORTH AMERICA PARMESAN IN CHEESE SPREAD MARKET, BY REGION, 2018-2033 (USD THOUSAND)
TABLE 29 NORTH AMERICA GOUDA IN CHEESE SPREAD MARKET, BY REGION, 2018-2033 (USD THOUSAND)
TABLE 30 NORTH AMERICA RICOTTA IN CHEESE SPREAD MARKET, BY REGION, 2018-2033 (USD THOUSAND)
TABLE 31 NORTH AMERICA FETA IN CHEESE SPREAD MARKET, BY REGION, 2018-2033 (USD THOUSAND)
TABLE 32 NORTH AMERICA BLUE CHEESE IN CHEESE SPREAD MARKET, BY REGION, 2018-2033 (USD THOUSAND)
TABLE 33 NORTH AMERICA OTHERS IN CHEESE SPREAD MARKET, BY REGION, 2018-2033 (USD THOUSAND)
TABLE 34 NORTH AMERICA CHEESE SPREAD MARKET, BY SOURCE, 2018-2033 (USD THOUSAND)
TABLE 35 NORTH AMERICA ANIMAL-BASED IN CHEESE SPREAD MARKET, BY TYPE, 2018-2033 (USD THOUSAND)
TABLE 36 NORTH AMERICA ANIMAL-BASED IN CHEESE SPREAD MARKET, BY REGION, 2018-2033 (USD THOUSAND)
TABLE 37 NORTH AMERICA PLANT-BASED IN CHEESE SPREAD MARKET, BY TYPE, 2018-2033 (USD THOUSAND)
TABLE 38 NORTH AMERICA PLANT-BASED IN CHEESE SPREAD MARKET, BY REGION, 2018-2033 (USD THOUSAND)
TABLE 39 NORTH AMERICA CHEESE SPREAD MARKET, BY FLAVOR, 2018-2033 (USD THOUSAND)
TABLE 40 NORTH AMERICA PLAIN IN CHEESE SPREAD MARKET, BY REGION, 2018-2033 (USD THOUSAND)
TABLE 41 NORTH AMERICA FLAVORED IN CHEESE SPREAD MARKET, BY TYPE, 2018-2033 (USD THOUSAND)
TABLE 42 NORTH AMERICA FLAVORED IN CHEESE SPREAD MARKET, BY REGION, 2018-2033 (USD THOUSAND)
TABLE 43 NORTH AMERICA CHEESE SPREAD MARKET, BY CLAIM, 2018-2033 (USD THOUSAND)
TABLE 44 NORTH AMERICA REGULAR / WITHOUT CLAIMS IN CHEESE SPREAD MARKET, BY REGION, 2018-2033 (USD THOUSAND)
TABLE 45 NORTH AMERICA WITH CLAIMS IN CHEESE SPREAD MARKET, BY TYPE, 2018-2033 (USD THOUSAND)
TABLE 46 NORTH AMERICA WITH CLAIMS IN CHEESE SPREAD MARKET, BY REGION, 2018-2033 (USD THOUSAND)
TABLE 47 NORTH AMERICA CHEESE SPREAD MARKET, BY BRAND CATEGORY, 2018-2033 (USD THOUSAND)
TABLE 48 NORTH AMERICA BRANDED IN CHEESE SPREAD MARKET, BY REGION, 2018-2033 (USD THOUSAND)
TABLE 49 NORTH AMERICA PRIVATE LABEL IN CHEESE SPREAD MARKET, BY REGION, 2018-2033 (USD THOUSAND)
TABLE 50 NORTH AMERICA CHEESE SPREAD MARKET, BY PRICE, 2018-2033 (USD THOUSAND)
TABLE 51 NORTH AMERICA 5-15 USD IN CHEESE SPREAD MARKET, BY REGION, 2018-2033 (USD THOUSAND)
TABLE 52 NORTH AMERICA UP TO 5 USD IN CHEESE SPREAD MARKET, BY REGION, 2018-2033 (USD THOUSAND)
TABLE 53 NORTH AMERICA 15-30 USD IN CHEESE SPREAD MARKET, BY REGION, 2018-2033 (USD THOUSAND)
TABLE 54 NORTH AMERICA ABOVE 30 USD IN CHEESE SPREAD MARKET, BY REGION, 2018-2033 (USD THOUSAND)
TABLE 55 NORTH AMERICA CHEESE SPREAD MARKET, BY PACKAGING, 2018-2033 (USD THOUSAND)
TABLE 56 NORTH AMERICA JARS / TUBS / CUPS IN CHEESE SPREAD MARKET, BY REGION, 2018-2033 (USD THOUSAND)
TABLE 57 NORTH AMERICA PLASTIC IN CHEESE SPREAD MARKET, BY REGION, 2018-2033 (USD THOUSAND)
TABLE 58 NORTH AMERICA POUCHES / SQUEEZE PACKS IN CHEESE SPREAD MARKET, BY REGION, 2018-2033 (USD THOUSAND)
TABLE 59 NORTH AMERICA GLASS IN CHEESE SPREAD MARKET, BY REGION, 2018-2033 (USD THOUSAND)
TABLE 60 NORTH AMERICA FOIL-WRAPPED IN CHEESE SPREAD MARKET, BY REGION, 2018-2033 (USD THOUSAND)
TABLE 61 NORTH AMERICA OTHERS IN CHEESE SPREAD MARKET, BY REGION, 2018-2033 (USD THOUSAND)
TABLE 62 NORTH AMERICA CHEESE SPREAD MARKET, BY PACKAGING QUANTITY, 2018-2033 (USD THOUSAND)
TABLE 63 NORTH AMERICA 100-250 G IN CHEESE SPREAD MARKET, BY REGION, 2018-2033 (USD THOUSAND)
TABLE 64 NORTH AMERICA 250-500 G IN CHEESE SPREAD MARKET, BY REGION, 2018-2033 (USD THOUSAND)
TABLE 65 NORTH AMERICA LESS THAN 100 G IN CHEESE SPREAD MARKET, BY REGION, 2018-2033 (USD THOUSAND)
TABLE 66 NORTH AMERICA 500-1000 G IN CHEESE SPREAD MARKET, BY REGION, 2018-2033 (USD THOUSAND)
TABLE 67 NORTH AMERICA MORE THAN 1000 G IN CHEESE SPREAD MARKET, BY REGION, 2018-2033 (USD THOUSAND)
TABLE 68 NORTH AMERICA CHEESE SPREAD MARKET, BY END USE, 2018-2033 (USD THOUSAND)
TABLE 69 NORTH AMERICA COMMERCIAL IN CHEESE SPREAD MARKET, BY TYPE, 2018-2033 (USD THOUSAND)
TABLE 70 NORTH AMERICA RESTAURANTS IN CHEESE SPREAD MARKET, BY TYPE, 2018-2033 (USD THOUSAND)
TABLE 71 NORTH AMERICA EDUCATIONAL INSTITUTES IN CHEESE SPREAD MARKET, BY TYPE, 2018-2033 (USD THOUSAND)
TABLE 72 NORTH AMERICA COMMERCIAL IN CHEESE SPREAD MARKET, BY REGION, 2018-2033 (USD THOUSAND)
TABLE 73 NORTH AMERICA HOUSEHOLD IN CHEESE SPREAD MARKET, BY REGION, 2018-2033 (USD THOUSAND)
TABLE 74 NORTH AMERICA CHEESE SPREAD MARKET, BY DISTRIBUTION CHANNEL, 2018-2033 (USD THOUSAND)
TABLE 75 NORTH AMERICA B2C IN CHEESE SPREAD MARKET, BY TYPE, 2018-2033 (USD THOUSAND)
TABLE 76 NORTH AMERICA B2C IN CHEESE SPREAD MARKET, BY REGION, 2018-2033 (USD THOUSAND)
TABLE 77 NORTH AMERICA B2B IN CHEESE SPREAD MARKET, BY TYPE, 2018-2033 (USD THOUSAND)
TABLE 78 NORTH AMERICA B2B IN CHEESE SPREAD MARKET, BY REGION, 2018-2033 (USD THOUSAND)
TABLE 79 NORTH AMERICA CHEESE SPREAD MARKET, BY COUNTRY, 2018-2033 (USD THOUSAND)
TABLE 80 NORTH AMERICA CHEESE SPREAD MARKET, BY COUNTRY, 2018-2033 (TONS)
TABLE 81 NORTH AMERICA CHEESE SPREAD MARKET, BY PRODUCT TYPE, 2018-2033 (USD THOUSAND)
TABLE 82 NORTH AMERICA PROCESSED CHEESE SPREADS IN CHEESE SPREAD MARKET, BY TYPE, 2018-2033 (USD THOUSAND)
TABLE 83 NORTH AMERICA FRESH CHEESE SPREADS IN CHEESE SPREAD MARKET, BY TYPE, 2018-2033 (USD THOUSAND)
TABLE 84 NORTH AMERICA CURDS / SOFT CHEESE SPREADS IN CHEESE SPREAD MARKET, BY TYPE, 2018-2033 (USD THOUSAND)
TABLE 85 NORTH AMERICA COTTAGE CHEESE IN CHEESE SPREAD MARKET, BY TYPE, 2018-2033 (USD THOUSAND)
TABLE 86 NORTH AMERICA QUARK / TVAROH IN CHEESE SPREAD MARKET, BY TYPE, 2018-2033 (USD THOUSAND)
TABLE 87 NORTH AMERICA GOAT / SHEEP SOFT CHEESE IN CHEESE SPREAD MARKET, BY TYPE, 2018-2033 (USD THOUSAND)
TABLE 88 NORTH AMERICA CHEESE SPREAD MARKET, BY NATURE, 2018-2033 (USD THOUSAND)
TABLE 89 NORTH AMERICA CHEESE SPREAD MARKET, BY CHEESE TYPE, 2018-2033 (USD THOUSAND)
TABLE 90 NORTH AMERICA CHEESE SPREAD MARKET, BY SOURCE, 2018-2033 (USD THOUSAND)
TABLE 91 NORTH AMERICA ANIMAL-BASED IN CHEESE SPREAD MARKET, BY TYPE, 2018-2033 (USD THOUSAND)
TABLE 92 NORTH AMERICA PLANT-BASED IN CHEESE SPREAD MARKET, BY TYPE, 2018-2033 (USD THOUSAND)
TABLE 93 NORTH AMERICA CHEESE SPREAD MARKET, BY FLAVOR, 2018-2033 (USD THOUSAND)
TABLE 94 NORTH AMERICA FLAVORED IN CHEESE SPREAD MARKET, BY TYPE, 2018-2033 (USD THOUSAND)
TABLE 95 NORTH AMERICA CHEESE SPREAD MARKET, BY CLAIM, 2018-2033 (USD THOUSAND)
TABLE 96 NORTH AMERICA WITH CLAIMS IN CHEESE SPREAD MARKET, BY TYPE, 2018-2033 (USD THOUSAND)
TABLE 97 NORTH AMERICA CHEESE SPREAD MARKET, BY BRAND CATEGORY, 2018-2033 (USD THOUSAND)
TABLE 98 NORTH AMERICA CHEESE SPREAD MARKET, BY PRICE, 2018-2033 (USD THOUSAND)
TABLE 99 NORTH AMERICA CHEESE SPREAD MARKET, BY PACKAGING, 2018-2033 (USD THOUSAND)
TABLE 100 NORTH AMERICA CHEESE SPREAD MARKET, BY PACKAGING QUANTITY, 2018-2033 (USD THOUSAND)
TABLE 101 NORTH AMERICA CHEESE SPREAD MARKET, BY END USE, 2018-2033 (USD THOUSAND)
TABLE 102 NORTH AMERICA COMMERCIAL IN CHEESE SPREAD MARKET, BY TYPE, 2018-2033 (USD THOUSAND)
TABLE 103 NORTH AMERICA RESTAURANTS IN CHEESE SPREAD MARKET, BY TYPE, 2018-2033 (USD THOUSAND)
TABLE 104 NORTH AMERICA EDUCATIONAL INSTITUTES IN CHEESE SPREAD MARKET, BY TYPE, 2018-2033 (USD THOUSAND)
TABLE 105 NORTH AMERICA CHEESE SPREAD MARKET, BY DISTRIBUTION CHANNEL, 2018-2033 (USD THOUSAND)
TABLE 106 NORTH AMERICA B2C IN CHEESE SPREAD MARKET, BY TYPE, 2018-2033 (USD THOUSAND)
TABLE 107 NORTH AMERICA B2B IN CHEESE SPREAD MARKET, BY TYPE, 2018-2033 (USD THOUSAND)
TABLE 108 U.S. CHEESE SPREAD MARKET, BY PRODUCT TYPE, 2018-2033 (USD THOUSAND)
TABLE 109 U.S. PROCESSED CHEESE SPREADS IN CHEESE SPREAD MARKET, BY TYPE, 2018-2033 (USD THOUSAND)
TABLE 110 U.S. FRESH CHEESE SPREADS IN CHEESE SPREAD MARKET, BY TYPE, 2018-2033 (USD THOUSAND)
TABLE 111 U.S. CURDS / SOFT CHEESE SPREADS IN CHEESE SPREAD MARKET, BY TYPE, 2018-2033 (USD THOUSAND)
TABLE 112 U.S. COTTAGE CHEESE IN CHEESE SPREAD MARKET, BY TYPE, 2018-2033 (USD THOUSAND)
TABLE 113 U.S. QUARK / TVAROH IN CHEESE SPREAD MARKET, BY TYPE, 2018-2033 (USD THOUSAND)
TABLE 114 U.S. GOAT / SHEEP SOFT CHEESE IN CHEESE SPREAD MARKET, BY TYPE, 2018-2033 (USD THOUSAND)
TABLE 115 U.S. CHEESE SPREAD MARKET, BY NATURE, 2018-2033 (USD THOUSAND)
TABLE 116 U.S. CHEESE SPREAD MARKET, BY CHEESE TYPE, 2018-2033 (USD THOUSAND)
TABLE 117 U.S. CHEESE SPREAD MARKET, BY SOURCE, 2018-2033 (USD THOUSAND)
TABLE 118 U.S. ANIMAL-BASED IN CHEESE SPREAD MARKET, BY TYPE, 2018-2033 (USD THOUSAND)
TABLE 119 U.S. PLANT-BASED IN CHEESE SPREAD MARKET, BY TYPE, 2018-2033 (USD THOUSAND)
TABLE 120 U.S. CHEESE SPREAD MARKET, BY FLAVOR, 2018-2033 (USD THOUSAND)
TABLE 121 U.S. FLAVORED IN CHEESE SPREAD MARKET, BY TYPE, 2018-2033 (USD THOUSAND)
TABLE 122 U.S. CHEESE SPREAD MARKET, BY CLAIM, 2018-2033 (USD THOUSAND)
TABLE 123 U.S. WITH CLAIMS IN CHEESE SPREAD MARKET, BY TYPE, 2018-2033 (USD THOUSAND)
TABLE 124 U.S. CHEESE SPREAD MARKET, BY BRAND CATEGORY, 2018-2033 (USD THOUSAND)
TABLE 125 U.S. CHEESE SPREAD MARKET, BY PRICE, 2018-2033 (USD THOUSAND)
TABLE 126 U.S. CHEESE SPREAD MARKET, BY PACKAGING, 2018-2033 (USD THOUSAND)
TABLE 127 U.S. CHEESE SPREAD MARKET, BY PACKAGING QUANTITY, 2018-2033 (USD THOUSAND)
TABLE 128 U.S. CHEESE SPREAD MARKET, BY END USE, 2018-2033 (USD THOUSAND)
TABLE 129 U.S. COMMERCIAL IN CHEESE SPREAD MARKET, BY TYPE, 2018-2033 (USD THOUSAND)
TABLE 130 U.S. RESTAURANTS IN CHEESE SPREAD MARKET, BY TYPE, 2018-2033 (USD THOUSAND)
TABLE 131 U.S. EDUCATIONAL INSTITUTES IN CHEESE SPREAD MARKET, BY TYPE, 2018-2033 (USD THOUSAND)
TABLE 132 U.S. CHEESE SPREAD MARKET, BY DISTRIBUTION CHANNEL, 2018-2033 (USD THOUSAND)
TABLE 133 U.S. B2C IN CHEESE SPREAD MARKET, BY TYPE, 2018-2033 (USD THOUSAND)
TABLE 134 U.S. B2B IN CHEESE SPREAD MARKET, BY TYPE, 2018-2033 (USD THOUSAND)
TABLE 135 CANADA CHEESE SPREAD MARKET, BY PRODUCT TYPE, 2018-2033 (USD THOUSAND)
TABLE 136 CANADA PROCESSED CHEESE SPREADS IN CHEESE SPREAD MARKET, BY TYPE, 2018-2033 (USD THOUSAND)
TABLE 137 CANADA FRESH CHEESE SPREADS IN CHEESE SPREAD MARKET, BY TYPE, 2018-2033 (USD THOUSAND)
TABLE 138 CANADA CURDS / SOFT CHEESE SPREADS IN CHEESE SPREAD MARKET, BY TYPE, 2018-2033 (USD THOUSAND)
TABLE 139 CANADA COTTAGE CHEESE IN CHEESE SPREAD MARKET, BY TYPE, 2018-2033 (USD THOUSAND)
TABLE 140 CANADA QUARK / TVAROH IN CHEESE SPREAD MARKET, BY TYPE, 2018-2033 (USD THOUSAND)
TABLE 141 CANADA GOAT / SHEEP SOFT CHEESE IN CHEESE SPREAD MARKET, BY TYPE, 2018-2033 (USD THOUSAND)
TABLE 142 CANADA CHEESE SPREAD MARKET, BY NATURE, 2018-2033 (USD THOUSAND)
TABLE 143 CANADA CHEESE SPREAD MARKET, BY CHEESE TYPE, 2018-2033 (USD THOUSAND)
TABLE 144 CANADA CHEESE SPREAD MARKET, BY SOURCE, 2018-2033 (USD THOUSAND)
TABLE 145 CANADA ANIMAL-BASED IN CHEESE SPREAD MARKET, BY TYPE, 2018-2033 (USD THOUSAND)
TABLE 146 CANADA PLANT-BASED IN CHEESE SPREAD MARKET, BY TYPE, 2018-2033 (USD THOUSAND)
TABLE 147 CANADA CHEESE SPREAD MARKET, BY FLAVOR, 2018-2033 (USD THOUSAND)
TABLE 148 CANADA FLAVORED IN CHEESE SPREAD MARKET, BY TYPE, 2018-2033 (USD THOUSAND)
TABLE 149 CANADA CHEESE SPREAD MARKET, BY CLAIM, 2018-2033 (USD THOUSAND)
TABLE 150 CANADA WITH CLAIMS IN CHEESE SPREAD MARKET, BY TYPE, 2018-2033 (USD THOUSAND)
TABLE 151 CANADA CHEESE SPREAD MARKET, BY BRAND CATEGORY, 2018-2033 (USD THOUSAND)
TABLE 152 CANADA CHEESE SPREAD MARKET, BY PRICE, 2018-2033 (USD THOUSAND)
TABLE 153 CANADA CHEESE SPREAD MARKET, BY PACKAGING, 2018-2033 (USD THOUSAND)
TABLE 154 CANADA CHEESE SPREAD MARKET, BY PACKAGING QUANTITY, 2018-2033 (USD THOUSAND)
TABLE 155 CANADA CHEESE SPREAD MARKET, BY END USE, 2018-2033 (USD THOUSAND)
TABLE 156 CANADA COMMERCIAL IN CHEESE SPREAD MARKET, BY TYPE, 2018-2033 (USD THOUSAND)
TABLE 157 CANADA RESTAURANTS IN CHEESE SPREAD MARKET, BY TYPE, 2018-2033 (USD THOUSAND)
TABLE 158 CANADA EDUCATIONAL INSTITUTES IN CHEESE SPREAD MARKET, BY TYPE, 2018-2033 (USD THOUSAND)
TABLE 159 CANADA CHEESE SPREAD MARKET, BY DISTRIBUTION CHANNEL, 2018-2033 (USD THOUSAND)
TABLE 160 CANADA B2C IN CHEESE SPREAD MARKET, BY TYPE, 2018-2033 (USD THOUSAND)
TABLE 161 CANADA B2B IN CHEESE SPREAD MARKET, BY TYPE, 2018-2033 (USD THOUSAND)
TABLE 162 MEXICO CHEESE SPREAD MARKET, BY PRODUCT TYPE, 2018-2033 (USD THOUSAND)
TABLE 163 MEXICO PROCESSED CHEESE SPREADS IN CHEESE SPREAD MARKET, BY TYPE, 2018-2033 (USD THOUSAND)
TABLE 164 MEXICO FRESH CHEESE SPREADS IN CHEESE SPREAD MARKET, BY TYPE, 2018-2033 (USD THOUSAND)
TABLE 165 MEXICO CURDS / SOFT CHEESE SPREADS IN CHEESE SPREAD MARKET, BY TYPE, 2018-2033 (USD THOUSAND)
TABLE 166 MEXICO COTTAGE CHEESE IN CHEESE SPREAD MARKET, BY TYPE, 2018-2033 (USD THOUSAND)
TABLE 167 MEXICO QUARK / TVAROH IN CHEESE SPREAD MARKET, BY TYPE, 2018-2033 (USD THOUSAND)
TABLE 168 MEXICO GOAT / SHEEP SOFT CHEESE IN CHEESE SPREAD MARKET, BY TYPE, 2018-2033 (USD THOUSAND)
TABLE 169 MEXICO CHEESE SPREAD MARKET, BY NATURE, 2018-2033 (USD THOUSAND)
TABLE 170 MEXICO CHEESE SPREAD MARKET, BY CHEESE TYPE, 2018-2033 (USD THOUSAND)
TABLE 171 MEXICO CHEESE SPREAD MARKET, BY SOURCE, 2018-2033 (USD THOUSAND)
TABLE 172 MEXICO ANIMAL-BASED IN CHEESE SPREAD MARKET, BY TYPE, 2018-2033 (USD THOUSAND)
TABLE 173 MEXICO PLANT-BASED IN CHEESE SPREAD MARKET, BY TYPE, 2018-2033 (USD THOUSAND)
TABLE 174 MEXICO CHEESE SPREAD MARKET, BY FLAVOR, 2018-2033 (USD THOUSAND)
TABLE 175 MEXICO FLAVORED IN CHEESE SPREAD MARKET, BY TYPE, 2018-2033 (USD THOUSAND)
TABLE 176 MEXICO CHEESE SPREAD MARKET, BY CLAIM, 2018-2033 (USD THOUSAND)
TABLE 177 MEXICO WITH CLAIMS IN CHEESE SPREAD MARKET, BY TYPE, 2018-2033 (USD THOUSAND)
TABLE 178 MEXICO CHEESE SPREAD MARKET, BY BRAND CATEGORY, 2018-2033 (USD THOUSAND)
TABLE 179 MEXICO CHEESE SPREAD MARKET, BY PRICE, 2018-2033 (USD THOUSAND)
TABLE 180 MEXICO CHEESE SPREAD MARKET, BY PACKAGING, 2018-2033 (USD THOUSAND)
TABLE 181 MEXICO CHEESE SPREAD MARKET, BY PACKAGING QUANTITY, 2018-2033 (USD THOUSAND)
TABLE 182 MEXICO CHEESE SPREAD MARKET, BY END USE, 2018-2033 (USD THOUSAND)
TABLE 183 MEXICO COMMERCIAL IN CHEESE SPREAD MARKET, BY TYPE, 2018-2033 (USD THOUSAND)
TABLE 184 MEXICO RESTAURANTS IN CHEESE SPREAD MARKET, BY TYPE, 2018-2033 (USD THOUSAND)
TABLE 185 MEXICO EDUCATIONAL INSTITUTES IN CHEESE SPREAD MARKET, BY TYPE, 2018-2033 (USD THOUSAND)
TABLE 186 MEXICO CHEESE SPREAD MARKET, BY DISTRIBUTION CHANNEL, 2018-2033 (USD THOUSAND)
TABLE 187 MEXICO B2C IN CHEESE SPREAD MARKET, BY TYPE, 2018-2033 (USD THOUSAND)
TABLE 188 MEXICO B2B IN CHEESE SPREAD MARKET, BY TYPE, 2018-2033 (USD THOUSAND)
List of Figure
FIGURE 1 NORTH AMERICA CHEESE SPREAD MARKET: SEGMENTATION
FIGURE 2 NORTH AMERICA CHEESE SPREAD MARKET: DATA TRIANGULATION
FIGURE 3 NORTH AMERICA CHEESE SPREAD MARKET: DROC ANALYSIS
FIGURE 4 NORTH AMERICA CHEESE SPREAD MARKET: NORTH AMERICA VS REGIONAL MARKET ANALYSIS
FIGURE 5 NORTH AMERICA CHEESE SPREAD MARKET: COMPANY RESEARCH ANALYSIS
FIGURE 6 NORTH AMERICA CHEESE SPREAD MARKET: MULTIVARIATE MODELLING
FIGURE 7 NORTH AMERICA CHEESE SPREAD MARKET: INTERVIEW DEMOGRAPHICS
FIGURE 8 NORTH AMERICA CHEESE SPREAD MARKET: DBMR MARKET POSITION GRID
FIGURE 9 NORTH AMERICA CHEESE SPREAD MARKET: MARKET END USER COVERAGE GRID
FIGURE 10 NORTH AMERICA CHEESE SPREAD MARKET: VENDOR SHARE ANALYSIS
FIGURE 11 NORTH AMERICA CHEESE SPREAD MARKET: SEGMENTATION
FIGURE 12 EXECUTIVE SUMMARY
FIGURE 13 NORTH AMERICA CHEESE SPREAD MARKET, BY PRODUCT TYPE (2025)
FIGURE 14 STRATEGIC DECISIONS
FIGURE 15 RISING PREFERENCE FOR CONVENIENT AND READY-TO-USE FOODS DRIVING THE NORTH AMERICA CHEESE SPREAD MARKET FROM 2026 TO 2033
FIGURE 16 PROCESSED CHEESE SPREAD SEGMENT IS EXPECTED TO ACCOUNT FOR THE LARGEST SHARE OF THE NORTH AMERICA CHEESE SPREAD MARKET IN 2025 & 2033
FIGURE 17 PRICING TRENDS FOR NORTH AMERICA CHEESE SPREAD MARKET (2025–2033, USD/KG)
FIGURE 18 DROC ANALYSIS
FIGURE 19 DEVELOPMENT OF THE SALES RELEVANCE OF ONLINE SHOPS, 2021–2025:
FIGURE 20 NORTH AMERICA CHEESE SPREAD MARKET, BY PRODUCT TYPE, 2025
FIGURE 21 NORTH AMERICA CHEESE SPREAD MARKET, BY NATURE, 2025
FIGURE 22 NORTH AMERICA CHEESE SPREAD MARKET, BY CHEESE TYPE, 2025
FIGURE 23 NORTH AMERICA CHEESE SPREAD MARKET, BY SOURCE, 2025
FIGURE 24 NORTH AMERICA CHEESE SPREAD MARKET, BY FLAVOR, 2025
FIGURE 25 NORTH AMERICA CHEESE SPREAD MARKET, BY CLAIM, 2025
FIGURE 26 NORTH AMERICA CHEESE SPREAD MARKET, BY BRAND CATEGORY, 2025
FIGURE 27 NORTH AMERICA CHEESE SPREAD MARKET, BY PRICE, 2025
FIGURE 28 NORTH AMERICA CHEESE SPREAD MARKET, BY PACKAGING, 2025
FIGURE 29 NORTH AMERICA CHEESE SPREAD MARKET, BY PACKAGING QUANTITY, 2025
FIGURE 30 NORTH AMERICA CHEESE SPREAD MARKET, BY END USE, 2025
FIGURE 31 NORTH AMERICA CHEESE SPREAD MARKET, BY DISTRIBUTION CHANNEL, 2025
FIGURE 32 NORTH AMERICA CHEESE SPREAD MARKET: SNAPSHOT
FIGURE 33 NORTH AMERICA CHEESE SPREAD MARKET: COMPANY SHARE 2025 (%)
North America Cheese Spread Market, Supply Chain Analysis and Ecosystem Framework
To support market growth and help clients navigate the impact of geopolitical shifts, DBMR has integrated in-depth supply chain analysis into its North America Cheese Spread Market research reports. This addition empowers clients to respond effectively to global changes affecting their industries. The supply chain analysis section includes detailed insights such as North America Cheese Spread Market consumption and production by country, price trend analysis, the impact of tariffs and geopolitical developments, and import and export trends by country and HSN code. It also highlights major suppliers with data on production capacity and company profiles, as well as key importers and exporters. In addition to research, DBMR offers specialized supply chain consulting services backed by over a decade of experience, providing solutions like supplier discovery, supplier risk assessment, price trend analysis, impact evaluation of inflation and trade route changes, and comprehensive market trend analysis.
Data collection and base year analysis are done using data collection modules with large sample sizes. The stage includes obtaining market information or related data through various sources and strategies. It includes examining and planning all the data acquired from the past in advance. It likewise envelops the examination of information inconsistencies seen across different information sources. The market data is analysed and estimated using market statistical and coherent models. Also, market share analysis and key trend analysis are the major success factors in the market report. To know more, please request an analyst call or drop down your inquiry.
The key research methodology used by DBMR research team is data triangulation which involves data mining, analysis of the impact of data variables on the market and primary (industry expert) validation. Data models include Vendor Positioning Grid, Market Time Line Analysis, Market Overview and Guide, Company Positioning Grid, Patent Analysis, Pricing Analysis, Company Market Share Analysis, Standards of Measurement, Global versus Regional and Vendor Share Analysis. To know more about the research methodology, drop in an inquiry to speak to our industry experts.
Data Bridge Market Research is a leader in advanced formative research. We take pride in servicing our existing and new customers with data and analysis that match and suits their goal. The report can be customized to include price trend analysis of target brands understanding the market for additional countries (ask for the list of countries), clinical trial results data, literature review, refurbished market and product base analysis. Market analysis of target competitors can be analyzed from technology-based analysis to market portfolio strategies. We can add as many competitors that you require data about in the format and data style you are looking for. Our team of analysts can also provide you data in crude raw excel files pivot tables (Fact book) or can assist you in creating presentations from the data sets available in the report.


