
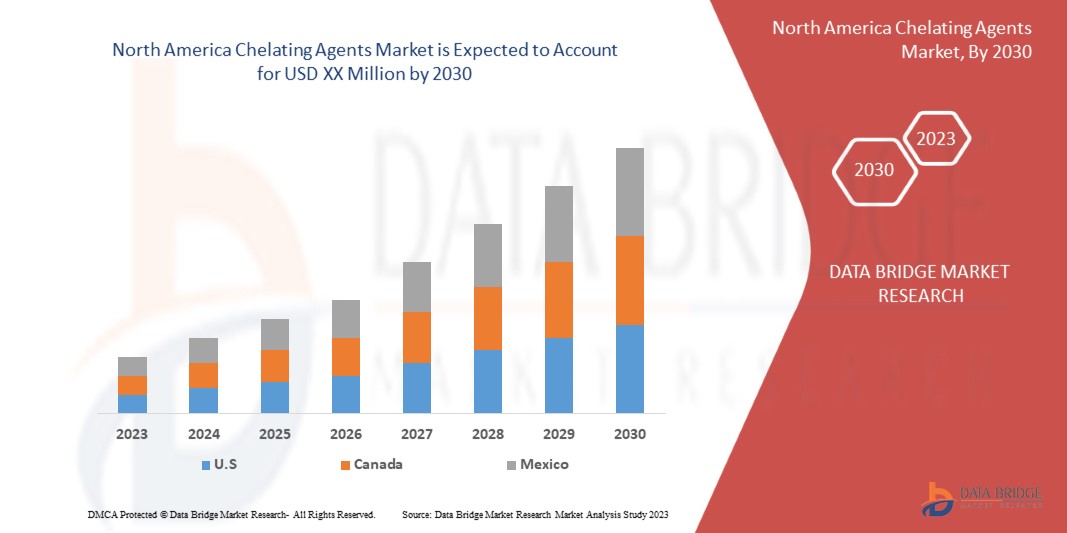
North America Chelating Agents Market Analysis and Insights
The chelating agents market is gaining significant growth due to increased usage of chelating agents in various sectors. They are used in different industries such as personal care, pulp and paper, agriculture among others products and have huge demand in market.
The major factor driving the growth of this market is the increase in consumption of treated water for industrial usage and high demand from household cleaning driving the market in the forecasted period while on the other hand; eco-toxicological risks of conventional chelating agents and decline in consumption of phosphate-based agents affect the North America chelating agents market Data Bridge Market Research analyses that the chelating agents market will grow at a CAGR of 5.0% during the forecast period of 2023 to 2030.
|
Report Metric |
Details |
|
Forecast Period |
2023 to 2030 |
|
Base Year |
2022 |
|
Historic Years |
2021 (Customizable to 2020 - 2016) |
|
Quantitative Units |
Revenue in Million, Volume in Thousand Ton, Pricing in USD |
|
Segments Covered |
By Type (Synthetic Chelating Agents, And Natural Chelating Agents), Form (Biodegradable, And Non-Biodegradable), Distribution Channel (Direct Sales/B2B, Specialty Stores, Warehouses, E-Commerce, And Others), Application (Pulp And Paper, Agriculture, Cleaners And Detergents, Industrial Cleaning/Descaling, Mining, Textile Processing, Oil And Gas, Polymer Production, Building And Construction, Photography, Electrical And Electronics, Food And Feed Additives, Personal Care, Pharmaceuticals, And Others) |
|
Regions Covered |
|
|
Market Players Covered |
BASF SE, Eastman Chemical Company, Chevron Phillips Chemical Company LLC, LANXESS, INEOS, ADM, Mitsubishi Chemical Corporation, SABIC, Dow, Nouryon, Kemira, Ascend Performance Materials, NIPPON SHOKUBAI CO., LTD., Lonza, Evonik Industries AG, Zhonglan Industry Co.,Ltd., Akzo Nobel N.V., among others.
|
Market Definition
Chelating agents are chemical compounds whose compositions cause two or more donor atoms (or sites) to be connected simultaneously to the same metal ion and to create one or more rings. These metal complexes have the potential to dissolve into optically active (R&L) shapes. The stability of metal complexes varies from the pattern of matrix-forming and the variation instability becomes more important in increasingly saturated solutions of biological processes such as serum or tissue. Toxic kinetics and toxic dynamics of metals and chelating agents are chemical compounds whose compositions enable two or more donor atoms (or sites) to be bound simultaneously to the same metal ion and to create one or more rings.
Chelating Agents Market Dynamics
This section deals with understanding the market drivers, opportunities, restraints, and challenges. All of this is discussed in detail as below:
Drivers
-
Rise in demand from pulp & paper industry
Chelating agents play a significant role in the pulp and paper industry. The operation of soluble metal ions without accumulation is hindered by chelating agents, ethylenediaminetraacetic acid (EDTA) and diethyleneetriamine pentaacetic acid (DTPA) in the pulp and paper used in the bleaching of voltage. Chelating agents are used in bleaching chains, in particular chlorine dioxide and sodium hydrosulphate processes. They can also be used for inking and scaling applications. There are various properties of chelating agents in chemical and acoustic purification of water and the use of chelating agents in the chlorine exfoliation manufacturer.
In the pulp and paper industry, chelating agents are used to improve process accuracy, such as chlorine drying. Aminopolycarboxylates, including EDTA and DTPA, are by far the most widely used chelating agents.
-
Increase in Consumption of Treated Water for Industrial Usage
Chelating agents are water softeners used in chemical analysis. EDTA is a common synthetic chelating agent. It is used in water treatment programs, particularly steam technology, in boiler water treatment systems. The chelating agent is used in the boiler to dissolve common types of scale and provide effective online and offline scale removal within the boiler.
Chelating agents form water-soluble complexes with alkali and transition metal ions, increasing metal solubility and preventing metal-catalyzed reactions. Aminopolycarboxylate chelating agents are widely used in various household products and industrial processes, with the most important applications being in industrial water treatment.
Opportunities
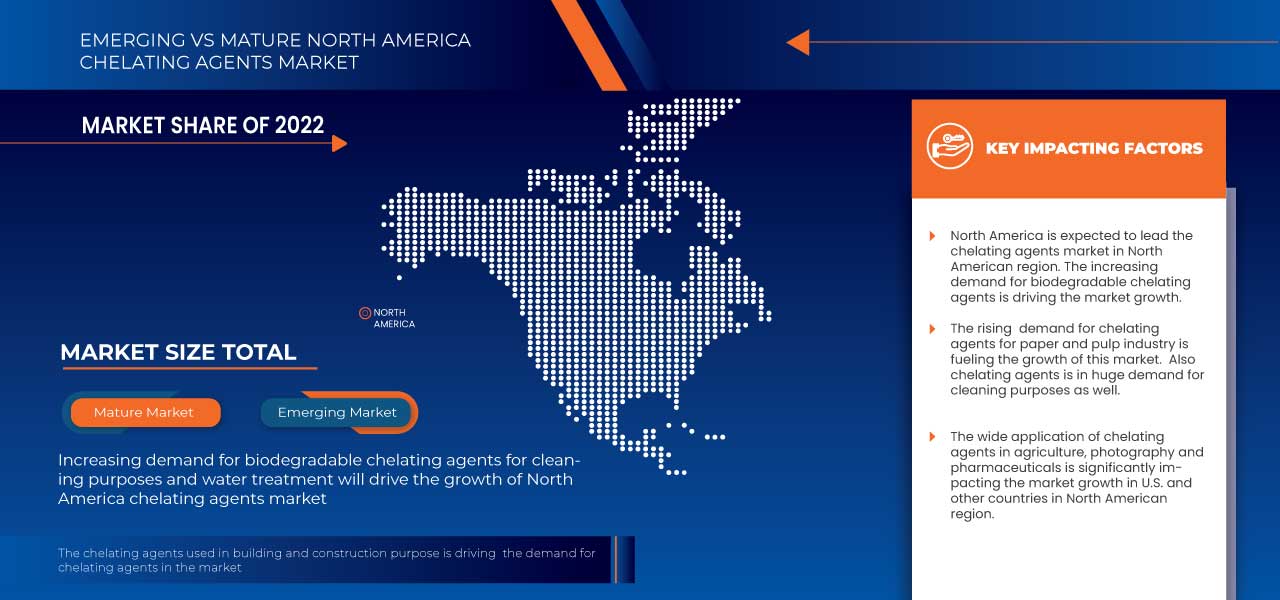
1 Development of eco-friendly chelating agents for cleaning application
Chelating agents have shown tremendous applications in cleaning especially in detergent actions. Chelating agents and their capacity to produce complex metals are widely used in many industrial, domestic and agricultural applications. Over the last decades, they have been used in a number of applications including cleaning applications.
Chelating agents are commonly used in household detergents to prevent metal ions naturally present in water from forming soap scum. There are many chelating agents out there, but EDTA and citric acid are two commonly found in cleaning products, using phosphoric acids that are banned in most countries. It is most commonly used in cleaning products to prevent it from reacting with mineral deposits and creating soap scum. The mechanism by which chelating agents work is complex. Basically, they bind with certain metal ions to form molecular complexes that trap or chelate calcium ions so that they do not exhibit ionic properties.
Restraints/Challenges
- Decline in Consumption of Phosphate-Based Agents
In soils without additional P fertiliser, EDTA and HEEDTA results in a substantial rise in WSP concentrations as well as a rise in Mehlich-1 P and Mehlich-3 P concentrations.
The use of chelating agents, with and without P fertiliser, could theoretically improve the plant supply of P and thus decrease P fertiliser. The roots of alternative natural chelating agents are found to help in the removal of metal ions inside the rhizosphere. Researches have studied engagement between excretion drugs and surface metals in response to synthesised chelating agents. Metal ions are absorbed once they have empty orbitals that cause the metal ion to interact with such a binding site that includes an atom with an electron pairs. Determined by the chemical structure, chelating agents can require upwards of one molecular to attach the metal carboxylic acid due to the number of concepts and skills in the ligand.
Recent Developments
- In October 2021, Jungbunzlauer sodium gluconate is produced through fermentation of renewable raw materials such as corn carbohydrates. Many organisms readily biodegrade it in aerobic and anaerobic wastewater conditions, as well as and in the natural environment
- Dow's chelating agents combine superior metal ion binding with relatively simple formulations. They are an integral and inexpensive part of most cleaning agents. Compared to many other chelating agents, Dow's chelating agents outperform traditional metal ion contaminants
Chelating Agents Market Scope
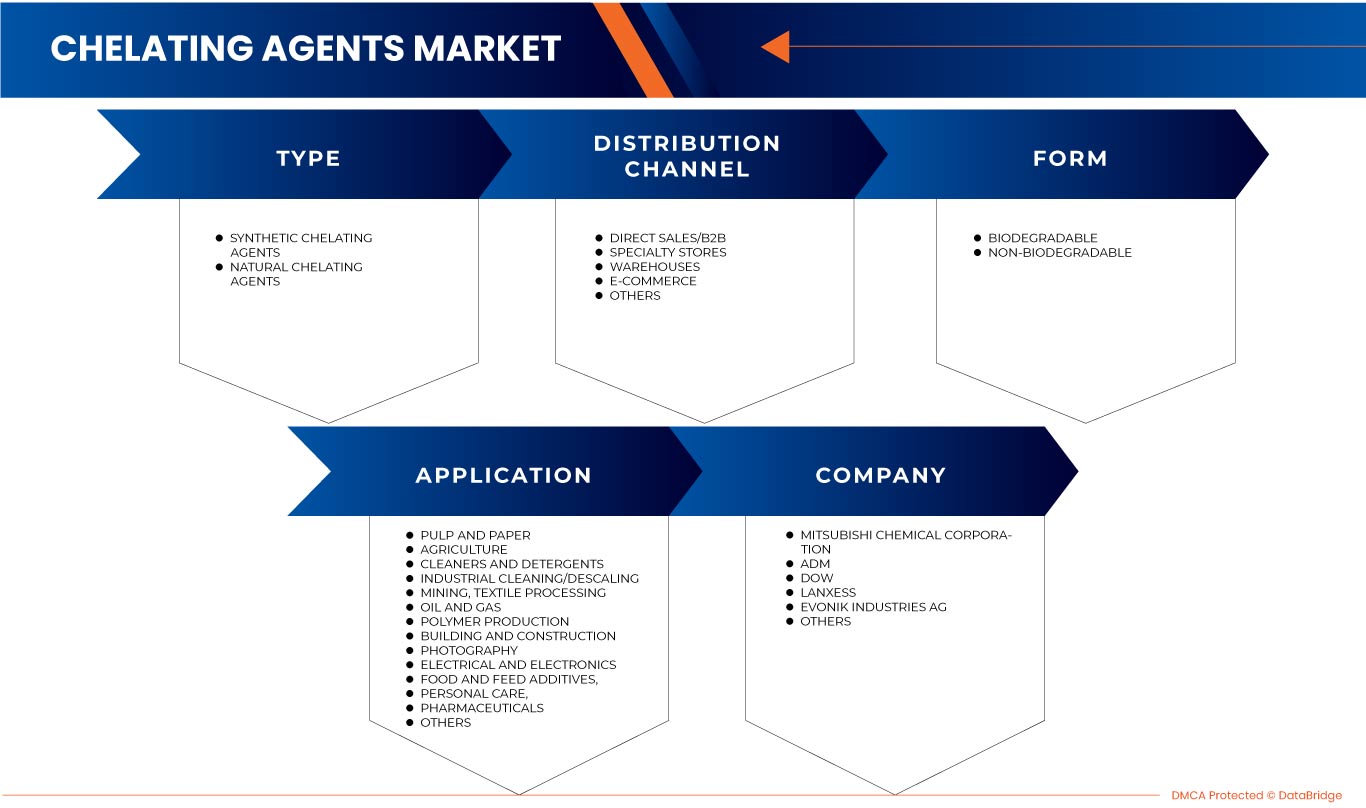
The chelating agents market is segmented based on type, form, distribution channel and application. The growth amongst these segments will help you analyze major growth segments in the industries and provide the users with a valuable market overview and market insights to make strategic decisions to identify core market applications.
Type
- Synthetic Chelating Agents
- Natural Chelating Agents
On the basis of type, the market is segmented into synthetic chelating agents, and natural chelating agents.
Form
- Biodegradable
- Non-Biodegradable
On the basis of form, the chelating agents market is segmented into biodegradable, and non-biodegradable.
Distribution Channel
- Direct Sales/B2B
- Specialty Stores
- Warehouses
- E-Commerce
- Others
On the basis of distribution channel, the chelating agents market is segmented into direct sales/B2B, specialty stores, warehouses, e-commerce, and others
Application
- Pulp And Paper
- Agriculture
- Cleaners And Detergents
- Industrial Cleaning/Descaling
- Mining
- Textile Processing
- Oil And Gas
- Polymer Production
- Building And Construction
- Photography
- Electrical And Electronics
- Food, And Feed Additives
- Personal Care
- Pharmaceuticals
- Others
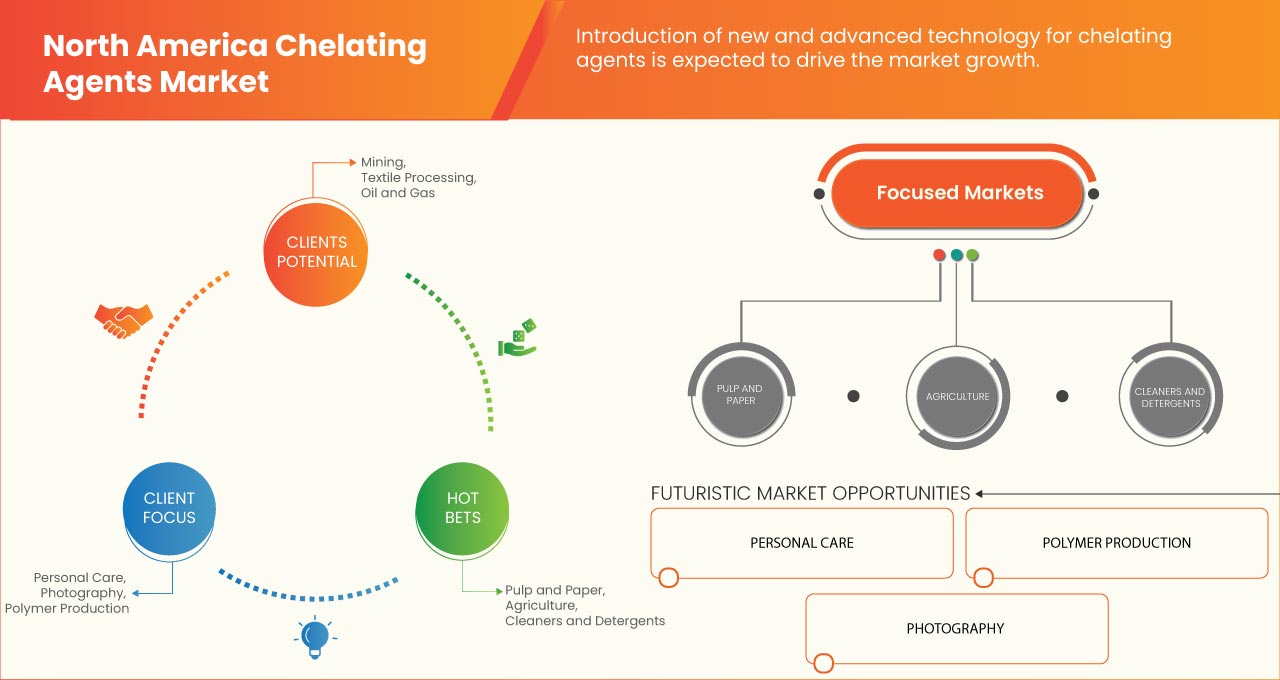
On the basis of application, the chelating agents market is segmented into pulp and paper, agriculture, cleaners and detergents, industrial cleaning/descaling, mining, textile processing, oil and gas, polymer production, building and construction, photography, electrical and electronics, food, and feed additives, personal care, pharmaceuticals, and others.
Chelating Agents Market Regional Analysis/Insights
The chelating agents market are analyzed, and market size insights and trends are provided based on as referenced above.
The countries covered in the chelating agents market report are U.S., Canada and Mexico.
U.S. is expected to dominate the chelating agents market due to the increased demand for chelating agents in fertilizer industries.
The region section of the report also provides individual market impacting factors and changes in regulations in the market that impact the current and future trends of the market. Data points, such as new and replacement sales, country demographics, disease epidemiology, and import-export tariffs, are some of the major pointers used to forecast the market scenario for individual countries. In addition, the presence and availability of North America brands and their challenges faced due to high competition from local and domestic brands and the impact of sales channels are considered while providing forecast analysis of the country data.
Competitive Landscape and Chelating Agents Market Share Analysis
The competitive Chelating agents market provide details about the competitors. Details include company overview, company financials, revenue generated, market potential, investment in research and development, new market initiatives, North America presence, production sites and facilities, production capacities, company strengths and weaknesses, product launch, product width and breadth, and application dominance. The above data points are only related to the companies' focus on the chelating agents market.
Some of the major players operating in the market are BASF SE, Eastman Chemical Company, Chevron Phillips Chemical Company LLC, LANXESS, INEOS, ADM, Mitsubishi Chemical Corporation, SABIC, Dow, Nouryon, Kemira, Ascend Performance Materials, NIPPON SHOKUBAI CO., LTD., Lonza, Evonik Industries AG, Zhonglan Industry Co., Ltd., Akzo Nobel N.V., among others.
SKU-

- Interactive Data Analysis Dashboard
- Company Analysis Dashboard for high growth potential opportunities
- Research Analyst Access for customization & queries
- Competitor Analysis with Interactive dashboard
- Latest News, Updates & Trend analysis
- Harness the Power of Benchmark Analysis for Comprehensive Competitor Tracking
Table of Content
1 INTRODUCTION
1.1 OBJECTIVES OF THE STUDY
1.2 MARKET DEFINITION
1.3 OVERVIEW OF THE NORTH AMERICA CHELATING AGENTS MARKET
1.4 LIMITATION
1.5 MARKETS COVERED
2 MARKET SEGMENTATION
2.1 MARKETS COVERED
2.2 GEOGRAPHICAL SCOPE
2.3 YEARS CONSIDERED FOR THE STUDY
2.4 CURRENCY AND PRICING
2.5 DBMR TRIPOD DATA VALIDATION MODEL
2.6 MULTIVARIATE MODELLING
2.7 TESTING TYPE LIFELINE CURVE
2.8 PRIMARY INTERVIEWS WITH KEY OPINION LEADERS
2.9 DBMR MARKET POSITION GRID
2.1 MARKET APPLICATION COVERAGE GRID
2.11 SECONDARY SOURCES
2.12 ASSUMPTIONS
3 EXECUTIVE SUMMARY
4 PREMIUM INSIGHTS
4.1 PRICING ANALYSIS –NORTH AMERICA CHELATING AGENTS MARKET
4.2 GROWTH STRATEGIES ADOPTED BY KEY MARKET PLAYERS
4.3 IMPACT OF ECONOMIC SLOWDOWN ON THE MARKET –NORTH AMERICA CHELATING AGENTS MARKET
5 MARKET OVERVIEW
5.1 DRIVERS
5.1.1 RISE IN DEMAND FROM THE PULP & PAPER INDUSTRY
5.1.2 INCREASE IN CONSUMPTION OF TREATED WATER FOR INDUSTRIAL USAGE
5.1.3 HIGH DEMAND FOR CHELATING AGENTS IN HOUSEHOLD CLEANING
5.1.4 SHIFT TOWARDS BIODEGRADABLE CHELATING AGENTS FROM NON-BIODEGRADABLE
5.2 RESTRAINTS
5.2.1 ECO-TOXICOLOGICAL RISKS OF CONVENTIONAL CHELATING AGENTS
5.2.2 DECLINE IN CONSUMPTION OF PHOSPHATE-BASED AGENTS
5.2.3 POOR DEGRADABILITY OF EDTA AND DTPA
5.3 OPPORTUNITIES
5.3.1 GROWTH IN R&D INVESTMENT TO DEVELOP BIO-BASED CHELATING AGENTS
5.3.2 DEVELOPMENT OF ECO-FRIENDLY CHELATING AGENTS FOR CLEANING APPLICATION
5.3.3 INCREASE IN THE USE OF CHELATING AGENTS FOR THE PHARMACEUTICAL INDUSTRY
5.4 CHALLENGES
5.4.1 ENVIRONMENTAL CONCERNS RELATED TO CHELATING AGENTS
5.4.2 LESS AWARENESS IN DEVELOPING ECONOMIES ABOUT THE BENEFITS OF GREEN CHELATES
6 NORTH AMERICA CHELATING AGENTS MARKET, BY TYPE
6.1 OVERVIEW
6.2 SYNTHETIC CHELATING AGENTS
6.2.1 AMINOPOLYCARBOLXYLATES (APCS)
6.2.1.1 ETHYLENEDIAMINETETRAACETIC ACID (EDTA)
6.2.1.2 DIETHYLENETRIAMINEPENTAACETIC ACID (DTPA)
6.2.1.3 NITRILOTRIACETIC ACID (NTA)
6.2.1.4 OTHERS
6.2.2 ORGANOPHOSPHATES
6.2.2.1 DIETHYLENETRIAMINE PENTA (METHYLENE PHOSPHONIC ACID)(DTPMP)
6.2.2.2 HYDROXYETHYLIDENEDIPHOSPHONIC ACID (HEDP)
6.2.2.3 NITRILOTRIMETHYLENEPHOSPHONIC ACID (NTMP)
6.2.2.4 OTHERS
6.2.3 ORGANIC ACIDS
6.2.3.1 CITRIC ACID
6.2.3.2 TARTARIC ACID
6.2.3.3 OTHERS
6.2.4 OTHERS
6.3 NATURAL CHELATING AGENTS
6.3.1 FOOD-GRADE ACTIVATED CHARCOAL
6.3.2 CHLORELLA
6.3.3 GLYCINE
6.3.4 OTHERS
7 NORTH AMERICA CHELATING AGENTS MARKET, BY FORM
7.1 OVERVIEW
7.2 BIODEGRADABLE
7.2.1 NTA
7.2.2 GLDA
7.2.3 MGDA
7.2.4 OTHERS
7.3 NON-BIODEGRADABLE
8 NORTH AMERICA CHELATING AGENTS MARKET, BY DISTRIBUTION CHANNEL
8.1 OVERVIEW
8.2 DIRECT SALES/B2B
8.3 SPECIALTY STORES
8.4 WAREHOUSES
8.5 E-COMMERCE
8.6 OTHERS
9 NORTH AMERICA CHELATING AGENTS MARKET, BY END USER
9.1 OVERVIEW
9.2 PULP AND PAPER
9.2.1 BIODEGRADABLE
9.2.2 NON-BIODEGRADABLE
9.3 AGRICULTURE
9.3.1 BIODEGRADABLE
9.3.2 NON-BIODEGRADABLE
9.4 CLEANERS AND DETERGENTS
9.4.1 BIODEGRADABLE
9.4.2 NON-BIODEGRADABLE
9.5 INDUSTRIAL CLEANING/DESCALING
9.5.1 BIODEGRADABLE
9.5.2 NON-BIODEGRADABLE
9.6 MINING
9.6.1 BIODEGRADABLE
9.6.2 NON-BIODEGRADABLE
9.7 TEXTILE PROCESSING
9.7.1 BIODEGRADABLE
9.7.2 NON-BIODEGRADABLE
9.8 OIL AND GAS
9.8.1 BIODEGRADABLE
9.8.2 NON-BIODEGRADABLE
9.9 POLYMER PRODUCTION
9.9.1 BIODEGRADABLE
9.9.2 NON-BIODEGRADABLE
9.1 BUILDING AND CONSTRUCTION
9.10.1 BIODEGRADABLE
9.10.2 NON-BIODEGRADABLE
9.11 PHOTOGRAPHY
9.11.1 BIODEGRADABLE
9.11.2 NON-BIODEGRADABLE
9.12 ELECTRICAL AND ELECTRONICS
9.12.1 BIODEGRADABLE
9.12.2 NON-BIODEGRADABLE
9.13 FOOD AND FEED ADDITIVES
9.13.1 BIODEGRADABLE
9.13.2 NON-BIODEGRADABLE
9.14 PERSONAL CARE
9.14.1 BIODEGRADABLE
9.14.2 NON-BIODEGRADABLE
9.15 PHARMACEUTICALS
9.15.1 BIODEGRADABLE
9.15.2 NON-BIODEGRADABLE
9.16 OTHERS
9.16.1 BIODEGRADABLE
9.16.2 NON-BIODEGRADABLE
10 NORTH AMERICA CHELATING AGENTS MARKET, BY REGION
10.1 NORTH AMERICA
10.1.1 U.S.
10.1.2 CANADA
10.1.3 MEXICO
11 NORTH AMERICA CHELATING AGENTS MARKET COMPANY LANDSCAPE
11.1 COMPANY SHARE ANALYSIS: NORTH AMERICA
12 SWOT ANALYSIS
13 COMPANY PROFILE
13.1 ADM
13.1.1 COMPANY SNAPSHOT
13.1.2 REVENUE ANALYSIS
13.1.3 COMPANY SHARE ANALYSIS
13.1.4 PRODUCT PORTFOLIO
13.1.5 RECENT UPDATE
13.2 MITSUBISHI CHEMICAL CORPORATION
13.2.1 COMPANY SNAPSHOT
13.2.2 RECENT FINANCIALS
13.2.3 COMPANY SHARE ANALYSIS
13.2.4 PRODUCT PORTFOLIO
13.2.5 RECENT DEVELOPMENT
13.3 LANXESS
13.3.1 COMPANY SNAPSHOT
13.3.2 RECENT FINANCIALS
13.3.3 COMPANY SHARE ANALYSIS
13.3.4 PRODUCT PORTFOLIO
13.3.5 RECENT DEVELOPMENT
13.4 DOW
13.4.1 COMPANY SNAPSHOT
13.4.2 REVENUE ANALYSIS
13.4.3 COMPANY SHARE ANALYSIS
13.4.4 PRODUCT PORTFOLIO
13.4.5 RECENT UPDATE
13.5 EVONIK INDUSTRIES AG
13.5.1 COMPANY SNAPSHOT
13.5.2 RECENT FINANCIALS
13.5.3 COMPANY SHARE ANALYSIS
13.5.4 PRODUCT PORTFOLIO
13.5.5 RECENT DEVELOPMENT
13.6 AQUAPHARM CHEMICAL PVT LTD.
13.6.1 COMPANY SNAPSHOT
13.6.2 PRODUCT PORTFOLIO
13.6.3 RECENT DEVELOPMENT
13.7 ASCEND PERFORMANCE MATERIALS
13.7.1 COMPANY SNAPSHOT
13.7.2 PRODUCT PORTFOLIO
13.7.3 RECENT DEVELOPMENT
13.8 AVA CHEMICALS PRIVATE LIMITED
13.8.1 COMPANY SNAPSHOT
13.8.2 PRODUCT PORTFOLIO
13.8.3 RECENT DEVELOPMENT
13.9 BASF SE
13.9.1 COMPANY SNAPSHOT
13.9.2 REVENUE ANALYSIS
13.9.3 PRODUCT PORTFOLIO
13.9.4 RECENT UPDATE
13.1 CHEVRON PHILLIPS CHEMICAL COMPANY
13.10.1 COMPANY SNAPSHOT
13.10.2 PRODUCT PORTFOLIO
13.10.3 RECENT DEVELOPMENT
13.11 EASTMAN CHEMICAL COMPANY
13.11.1 COMPANY SNAPSHOT
13.11.2 RECENT FINANCIALS
13.11.3 PRODUCT PORTFOLIO
13.11.4 RECENT DEVELOPMENT
13.12 JARCHEM INNOVATIVE INGREDIENTS LLC
13.12.1 COMPANY SNAPSHOT
13.12.2 PRODUCT PORTFOLIO
13.12.3 RECENT DEVELOPMENT
13.13 KEMIRA
13.13.1 COMPANY SNAPSHOT
13.13.2 REVENUE ANALYSIS
13.13.3 PRODUCT PORTFOLIO
13.13.4 RECENT UPDATES
13.14 LONZA
13.14.1 COMPANY SNAPSHOT
13.14.2 RECENT FINANCIALS
13.14.3 PRODUCT PORTFOLIO
13.14.4 RECENT DEVELOPMENT
13.15 NANJING SUNRISE IMP. & EXP. CO., LTD
13.15.1 COMPANY SNAPSHOT
13.15.2 PRODUCT PORTFOLIO
13.15.3 RECENT DEVELOPMENT
13.16 NIPPON SHKUBAI CO., LTD.
13.16.1 COMPANY SNAPSHOT
13.16.2 RECENT FINANCIALS
13.16.3 PRODUCT PORTFOLIO
13.16.4 RECENT DEVELOPMENT
13.17 NOURYON
13.17.1 COMPANY SNAPSHOT
13.17.2 PRODUCT PORTFOLIO
13.17.3 RECENT UPDATE
13.18 SABIC
13.18.1 COMPANY SNAPSHOT
13.18.2 RECENT FINANCIALS
13.18.3 .PRODUCT PORTFOLIO
13.18.4 RECENT DEVELOPMENT
13.19 SHANDONG IRO CHELATING CHEMICAL CO., LTD.
13.19.1 COMPANY SNAPSHOT
13.19.2 PRODUCT PORTFOLIO
13.19.3 RECENT DEVELOPMENT
13.2 ZHONGLAN INDUSTRY CO., LTD
13.20.1 COMPANY SNAPSHOT
13.20.2 PRODUCT PORTFOLIO
13.20.3 RECENT DEVELOPMENT
14 QUESTIONNAIRE
15 RELATED REPORTS
List of Table
TABLE 1 NORTH AMERICA CHELATING AGENTS MARKET, BY TYPE, 2016-2030 (USD MILLION)
TABLE 2 NORTH AMERICA CHELATING AGENTS MARKET, BY TYPE, 2016-2030 (TONS)
TABLE 3 NORTH AMERICA SYNTHETIC CHELATING AGENTS IN CHELATING AGENTS MARKET, BY REGION, 2016-2030 (USD MILLION)
TABLE 4 NORTH AMERICA SYNTHETIC CHELATING AGENTS IN CHELATING AGENTS MARKET, BY TYPE, 2016-2030 (USD MILLION)
TABLE 5 NORTH AMERICA SYNTHETIC CHELATING AGENTS IN CHELATING AGENTS MARKET, BY TYPE, 2016-2030 (TONS)
TABLE 6 NORTH AMERICA AMINOPOLYCARBOLXYLATES (APCS) IN CHELATING AGENTS MARKET, BY TYPE, 2016-2030 (USD MILLION)
TABLE 7 NORTH AMERICA AMINOPOLYCARBOLXYLATES (APCS) IN CHELATING AGENTS MARKET, BY TYPE, 2016-2030 (TONS)
TABLE 8 NORTH AMERICA ORGANOPHOSPHATES IN CHELATING AGENTS MARKET, BY TYPE, 2016-2030 (USD MILLION)
TABLE 9 NORTH AMERICA ORGANOPHOSPHATES IN CHELATING AGENTS MARKET, BY TYPE, 2016-2030 (TONS)
TABLE 10 NORTH AMERICA ORGANIC ACIDS IN CHELATING AGENTS MARKET, BY TYPE, 2016-2030 (USD MILLION)
TABLE 11 NORTH AMERICA ORGANIC ACIDS IN CHELATING AGENTS MARKET, BY TYPE, 2016-2030 (TONS)
TABLE 12 NORTH AMERICA NATURAL CHELATING AGENTS IN CHELATING AGENTS MARKET, BY REGION, 2016-2030 (USD MILLION)
TABLE 13 NORTH AMERICA NATURAL CHELATING AGENTS IN CHELATING AGENTS MARKET, BY TYPE, 2016-2030 (USD MILLION)
TABLE 14 NORTH AMERICA NATURAL CHELATING AGENTS IN CHELATING AGENTS MARKET, BY TYPE, 2016-2030 (TONS)
TABLE 15 NORTH AMERICA CHELATING AGENTS MARKET, BY FORM, 2016-2030 (USD MILLION)
TABLE 16 NORTH AMERICA CHELATING AGENTS MARKET, BY FORM, 2016-2030 (TONS)
TABLE 17 NORTH AMERICA BIODEGRADABLE IN CHELATING AGENTS MARKET, BY REGION, 2016-2030 (USD MILLION)
TABLE 18 NORTH AMERICA BIODEGRADABLE IN CHELATING AGENTS MARKET, BY FORM, 2016-2030 (USD MILLION)
TABLE 19 NORTH AMERICA BIODEGRADABLE IN CHELATING AGENTS MARKET, BY FORM, 2016-2030 (TONS)
TABLE 20 NORTH AMERICA NON-BIODEGRADEABLE IN CHELATING AGENTS MARKET, BY REGION, 2016-2030 (USD MILLION)
TABLE 21 NORTH AMERICA CHELATING AGENTS MARKET, BY DISTRIBUTION CHANNEL, 2016-2030 (USD MILLION)
TABLE 22 NORTH AMERICA CHELATING AGENTS MARKET, BY DISTRIBUTION CHANNEL, 2016-2030 (TONS)
TABLE 23 NORTH AMERICA DIRECT SALES/B2B IN CHELATING AGENTS MARKET, BY REGION, 2016-2030 (USD MILLION)
TABLE 24 NORTH AMERICA SPECIALTY STORES IN CHELATING AGENTS MARKET, BY REGION, 2016-2030 (USD MILLION)
TABLE 25 NORTH AMERICA WAREHOUSES IN CHELATING AGENTS MARKET, BY REGION, 2016-2030 (USD MILLION)
TABLE 26 NORTH AMERICA E-COMMERCE IN CHELATING AGENTS MARKET, BY REGION, 2016-2030 (USD MILLION)
TABLE 27 NORTH AMERICA OTHERS IN CHELATING AGENTS MARKET, BY REGION, 2016-2030 (USD MILLION)
TABLE 28 NORTH AMERICA CHELATING AGENTS MARKET, BY END USER, 2016-2030 (USD MILLION)
TABLE 29 NORTH AMERICA CHELATING AGENTS MARKET, BY END USER, 2016-2030 (TONS)
TABLE 30 NORTH AMERICA PULP AND PAPER IN CHELATING AGENTS MARKET, BY REGION, 2016-2030 (USD MILLION)
TABLE 31 NORTH AMERICA PULP AND PAPER IN CHELATING AGENTS MARKET, BY FORM, 2016-2030 (USD MILLION)
TABLE 32 NORTH AMERICA AGRICULTURE IN CHELATING AGENTS MARKET, BY REGION, 2016-2030 (USD MILLION)
TABLE 33 NORTH AMERICA AGRICULTURE IN CHELATING AGENTS MARKET, BY FORM, 2016-2030 (USD MILLION)
TABLE 34 NORTH AMERICA CLEANERS AND DETERGENTS IN CHELATING AGENTS MARKET, BY REGION, 2016-2030 (USD MILLION)
TABLE 35 NORTH AMERICA CLEANERS AND DETERGENTS IN CHELATING AGENTS MARKET, BY FORM, 2016-2030 (USD MILLION)
TABLE 36 NORTH AMERICA INDUSTRIAL CLEANING/DESCALING IN CHELATING AGENTS MARKET, BY REGION, 2016-2030 (USD MILLION)
TABLE 37 NORTH AMERICA INDUSTRIAL CLEANING/DESCALING IN CHELATING AGENTS MARKET, BY FORM, 2016-2030 (USD MILLION)
TABLE 38 NORTH AMERICA MINING IN CHELATING AGENTS MARKET, BY REGION, 2016-2030 (USD MILLION)
TABLE 39 NORTH AMERICA MINING IN CHELATING AGENTS MARKET, BY FORM, 2016-2030 (USD MILLION)
TABLE 40 NORTH AMERICA TEXTILE PROCESSING IN CHELATING AGENTS MARKET, BY REGION, 2016-2030 (USD MILLION)
TABLE 41 NORTH AMERICA TEXTILE PROCESSING IN CHELATING AGENTS MARKET, BY FORM, 2016-2030 (USD MILLION)
TABLE 42 NORTH AMERICA OIL AND GAS IN CHELATING AGENTS MARKET, BY REGION, 2016-2030 (USD MILLION)
TABLE 43 NORTH AMERICA OIL AND GAS IN CHELATING AGENTS MARKET, BY FORM, 2016-2030 (USD MILLION)
TABLE 44 NORTH AMERICA POLYMER PRODUCTION IN CHELATING AGENTS MARKET, BY REGION, 2016-2030 (USD MILLION)
TABLE 45 NORTH AMERICA POLYMER PRODUCTION IN CHELATING AGENTS MARKET, BY FROM, 2016-2030 (USD MILLION)
TABLE 46 NORTH AMERICA BUILDING AND CONSTRUCTION IN CHELATING AGENTS MARKET, BY REGION, 2016-2030 (USD MILLION)
TABLE 47 NORTH AMERICA BUILDING AND CONSTRUCTION IN CHELATING AGENTS MARKET, BY FORM, 2016-2030 (USD MILLION)
TABLE 48 NORTH AMERICA PHOTOGRAPHY IN CHELATING AGENTS MARKET, BY REGION, 2016-2030 (USD MILLION)
TABLE 49 NORTH AMERICA PHOTOGRAPHY IN CHELATING AGENTS MARKET, BY FORM, 2016-2030 (USD MILLION)
TABLE 50 NORTH AMERICA ELECTRICAL AND ELECTRONICS IN CHELATING AGENTS MARKET, BY REGION, 2016-2030 (USD MILLION)
TABLE 51 NORTH AMERICA ELECTRICAL AND ELECTRONICS IN CHELATING AGENTS MARKET, BY FORM, 2016-2030 (USD MILLION)
TABLE 52 NORTH AMERICA FOOD AND FEED ADDITIVES IN CHELATING AGENTS MARKET, BY REGION, 2016-2030 (USD MILLION)
TABLE 53 NORTH AMERICA FOOD AND FEED ADDITIVES IN CHELATING AGENTS MARKET, BY FORM, 2016-2030 (USD MILLION)
TABLE 54 NORTH AMERICA PERSONAL CARE IN CHELATING AGENTS MARKET, BY REGION, 2016-2030 (USD MILLION)
TABLE 55 NORTH AMERICA PERSONAL CARE IN CHELATING AGENTS MARKET, BY FORM, 2016-2030 (USD MILLION)
TABLE 56 NORTH AMERICA PHARMACEUTICALS IN CHELATING AGENTS MARKET, BY REGION, 2016-2030 (USD MILLION)
TABLE 57 NORTH AMERICA PHARMACEUTICALS IN CHELATING AGENTS MARKET BY FORM, 2016-2030 (USD MILLION)
TABLE 58 NORTH AMERICA OTHERS IN CHELATING AGENTS MARKET, BY REGION, 2016-2030 (USD MILLION)
TABLE 59 NORTH AMERICA CHELATING AGENTS MARKET, OTHERS BY TYPE, 2016-2030 (USD MILLION)
TABLE 60 NORTH AMERICA CHELATING AGENTS MARKET, BY COUNTRY, 2016-2030 (USD MILLION)
TABLE 61 NORTH AMERICA CHELATING AGENTS MARKET, BY COUNTRY, 2016-2030 (TONS)
TABLE 62 NORTH AMERICA CHELATING AGENTS MARKET, BY TYPE, 2016-2030 (USD MILLION)
TABLE 63 NORTH AMERICA CHELATING AGENTS MARKET, BY TYPE, 2016-2030 (TONS)
TABLE 64 NORTH AMERICA SYNTHETIC IN CHELATING AGENTS MARKET, BY TYPE, 2016-2030 (USD MILLION)
TABLE 65 NORTH AMERICA SYNTHETIC IN CHELATING AGENTS MARKET, BY TYPE, 2016-2030 (TONS)
TABLE 66 NORTH AMERICA AMINOPOLYCARBOLXYLATES (APCS) IN CHELATING AGENTS MARKET, BY TYPE, 2016-2030 (USD MILLION)
TABLE 67 NORTH AMERICA AMINOPOLYCARBOLXYLATES (APCS) IN CHELATING AGENTS MARKET, BY TYPE, 2016-2030 (TONS)
TABLE 68 NORTH AMERICA ORGANOPHOSPHATES IN CHELATING AGENTS MARKET, BY TYPE, 2016-2030 (USD MILLION)
TABLE 69 NORTH AMERICA ORGANOPHOSPHATES IN CHELATING AGENTS MARKET, BY TYPE, 2016-2030 (TONS)
TABLE 70 NORTH AMERICA ORGANIC ACIDS IN CHELATING AGENTS MARKET, BY TYPE, 2016-2030 (USD MILLION)
TABLE 71 NORTH AMERICA ORGANIC ACIDS IN CHELATING AGENTS MARKET, BY TYPE, 2016-2030 (TONS)
TABLE 72 NORTH AMERICA NATURAL IN CHELATING AGENTS MARKET, BY TYPE, 2016-2030 (USD MILLION)
TABLE 73 NORTH AMERICA NATURAL IN CHELATING AGENTS MARKET, BY TYPE, 2016-2030 (TONS)
TABLE 74 NORTH AMERICA CHELATING AGENTS MARKET, BY FORM, 2016-2030 (USD MILLION)
TABLE 75 NORTH AMERICA CHELATING AGENTS MARKET, BY FORM, 2016-2030 (TONS)
TABLE 76 NORTH AMERICA BIODEGRADABLE IN CHELATING AGENTS MARKET, BY FORM, 2016-2030 (USD MILLION)
TABLE 77 NORTH AMERICA BIODEGRADABLE IN CHELATING AGENTS MARKET, BY FORM, 2016-2030 (TONS)
TABLE 78 NORTH AMERICA CHELATING AGENTS MARKET, BY DISTRIBUTION CHANNEL, 2016-2030 (USD MILLION)
TABLE 79 NORTH AMERICA CHELATING AGENTS MARKET, BY DISTRIBUTION CHANNEL, 2016-2030 (TONS)
TABLE 80 NORTH AMERICA CHELATING AGENTS MARKET, BY END-USER, 2016-2030 (USD MILLION)
TABLE 81 NORTH AMERICA CHELATING AGENTS MARKET, BY END-USER, 2016-2030 (TONS)
TABLE 82 NORTH AMERICA PULP AND PAPER IN CHELATING AGENTS MARKET, BY FORM, 2016-2030 (USD MILLION)
TABLE 83 NORTH AMERICA AGRICULTURE IN CHELATING AGENTS MARKET, BY TYPE, 2016-2030 (USD MILLION)
TABLE 84 NORTH AMERICA CLEANERS AND DETERGENTS IN CHELATING AGENTS MARKET, BY FORM, 2016-2030 (USD MILLION)
TABLE 85 NORTH AMERICA INDUSTRIAL CLEANING/DESCALING IN CHELATING AGENTS MARKET, BY FORM, 2016-2030 (USD MILLION)
TABLE 86 NORTH AMERICA MINING IN CHELATING AGENTS MARKET, BY FORM, 2016-2030 (USD MILLION)
TABLE 87 NORTH AMERICA TEXTILE PROCESSING IN CHELATING AGENTS MARKET, BY FORM, 2016-2030 (USD MILLION)
TABLE 88 NORTH AMERICA OIL AND GAS IN CHELATING AGENTS MARKET, BY TYPE, 2016-2030 (USD MILLION)
TABLE 89 NORTH AMERICA POLYMER PRODUCTION IN CHELATING AGENTS MARKET, BY FORM, 2016-2030 (USD MILLION)
TABLE 90 NORTH AMERICA BUILDING AND CONSTRUCTION IN CHELATING AGENTS MARKET, BY FORM, 2016-2030 (USD MILLION)
TABLE 91 NORTH AMERICA PHOTOGRAPHY IN CHELATING AGENTS MARKET, BY FORM, 2016-2030 (USD MILLION)
TABLE 92 NORTH AMERICA ELECTRICAL AND ELECTRONICS IN CHELATING AGENTS MARKET, BY FORM, 2016-2030 (USD MILLION)
TABLE 93 NORTH AMERICA FOOD AND FEED ADDITIVES IN CHELATING AGENTS MARKET, BY FORM, 2016-2030 (USD MILLION)
TABLE 94 NORTH AMERICA PERSONAL CARE IN CHELATING AGENTS MARKET, BY FORM, 2016-2030 (USD MILLION)
TABLE 95 NORTH AMERICA PHARMACEUTICALS IN CHELATING AGENTS MARKET, BY FORM, 2016-2030 (USD MILLION)
TABLE 96 NORTH AMERICA OTHERS IN CHELATING AGENTS MARKET, BY FORM, 2016-2030 (USD MILLION)
TABLE 97 U.S. CHELATING AGENTS MARKET, BY TYPE, 2016-2030 (USD MILLION)
TABLE 98 U.S. CHELATING AGENTS MARKET, BY TYPE, 2016-2030 (TONS)
TABLE 99 U.S. SYNTHETIC IN CHELATING AGENTS MARKET, BY TYPE, 2016-2030 (USD MILLION)
TABLE 100 U.S. SYNTHETIC IN CHELATING AGENTS MARKET, BY TYPE, 2016-2030 (TONS)
TABLE 101 U.S. AMINOPOLYCARBOLXYLATES (APCS) IN CHELATING AGENTS MARKET, BY TYPE, 2016-2030 (USD MILLION)
TABLE 102 U.S. AMINOPOLYCARBOLXYLATES (APCS) IN CHELATING AGENTS MARKET, BY TYPE, 2016-2030 (TONS)
TABLE 103 U.S. ORGANOPHOSPHATES IN CHELATING AGENTS MARKET, BY TYPE, 2016-2030 (USD MILLION)
TABLE 104 U.S. ORGANOPHOSPHATES IN CHELATING AGENTS MARKET, BY TYPE, 2016-2030 (TONS)
TABLE 105 U.S. ORGANIC ACIDS IN CHELATING AGENTS MARKET, BY TYPE, 2016-2030 (USD MILLION)
TABLE 106 U.S. ORGANIC ACIDS IN CHELATING AGENTS MARKET, BY TYPE, 2016-2030 (TONS)
TABLE 107 U.S. NATURAL IN CHELATING AGENTS MARKET, BY TYPE, 2016-2030 (USD MILLION)
TABLE 108 U.S. NATURAL IN CHELATING AGENTS MARKET, BY TYPE, 2016-2030 (TONS)
TABLE 109 U.S. CHELATING AGENTS MARKET, BY FORM, 2016-2030 (USD MILLION)
TABLE 110 U.S. CHELATING AGENTS MARKET, BY FORM, 2016-2030 (TONS)
TABLE 111 U.S. BIODEGRADABLE IN CHELATING AGENTS MARKET, BY FORM, 2016-2030 (USD MILLION)
TABLE 112 U.S. BIODEGRADABLE IN CHELATING AGENTS MARKET, BY FORM, 2016-2030 (TONS)
TABLE 113 U.S. CHELATING AGENTS MARKET, BY DISTRIBUTION CHANNEL, 2016-2030 (USD MILLION)
TABLE 114 U.S. CHELATING AGENTS MARKET, BY DISTRIBUTION CHANNEL, 2016-2030 (TONS)
TABLE 115 U.S. CHELATING AGENTS MARKET, BY END-USER, 2016-2030 (USD MILLION)
TABLE 116 U.S. CHELATING AGENTS MARKET, BY END-USER, 2016-2030 (TONS)
TABLE 117 U.S. PULP AND PAPER IN CHELATING AGENTS MARKET, BY FORM, 2016-2030 (USD MILLION)
TABLE 118 U.S. AGRICULTURE IN CHELATING AGENTS MARKET, BY TYPE, 2016-2030 (USD MILLION)
TABLE 119 U.S. CLEANERS AND DETERGENTS IN CHELATING AGENTS MARKET, BY FORM, 2016-2030 (USD MILLION)
TABLE 120 U.S. INDUSTRIAL CLEANING/DESCALING IN CHELATING AGENTS MARKET, BY FORM, 2016-2030 (USD MILLION)
TABLE 121 U.S. MINING IN CHELATING AGENTS MARKET, BY FORM, 2016-2030 (USD MILLION)
TABLE 122 U.S. TEXTILE PROCESSING IN CHELATING AGENTS MARKET, BY FORM, 2016-2030 (USD MILLION)
TABLE 123 U.S. OIL AND GAS IN CHELATING AGENTS MARKET, BY TYPE, 2016-2030 (USD MILLION)
TABLE 124 U.S. POLYMER PRODUCTION IN CHELATING AGENTS MARKET, BY FORM, 2016-2030 (USD MILLION)
TABLE 125 U.S. BUILDING AND CONSTRUCTION IN CHELATING AGENTS MARKET, BY FORM, 2016-2030 (USD MILLION)
TABLE 126 U.S. PHOTOGRAPHY IN CHELATING AGENTS MARKET, BY FORM, 2016-2030 (USD MILLION)
TABLE 127 U.S. ELECTRICAL AND ELECTRONICS IN CHELATING AGENTS MARKET, BY FORM, 2016-2030 (USD MILLION)
TABLE 128 U.S. FOOD AND FEED ADDITIVES IN CHELATING AGENTS MARKET, BY FORM, 2016-2030 (USD MILLION)
TABLE 129 U.S. PERSONAL CARE IN CHELATING AGENTS MARKET, BY FORM, 2016-2030 (USD MILLION)
TABLE 130 U.S. PHARMACEUTICALS IN CHELATING AGENTS MARKET, BY FORM, 2016-2030 (USD MILLION)
TABLE 131 U.S. OTHERS IN CHELATING AGENTS MARKET, BY FORM, 2016-2030 (USD MILLION)
TABLE 132 CANADA CHELATING AGENTS MARKET, BY TYPE, 2016-2030 (USD MILLION)
TABLE 133 CANADA CHELATING AGENTS MARKET, BY TYPE, 2016-2030 (TONS)
TABLE 134 CANADA SYNTHETIC IN CHELATING AGENTS MARKET, BY TYPE, 2016-2030 (USD MILLION)
TABLE 135 CANADA SYNTHETIC IN CHELATING AGENTS MARKET, BY TYPE, 2016-2030 (TONS)
TABLE 136 CANADA AMINOPOLYCARBOLXYLATES (APCS) IN CHELATING AGENTS MARKET, BY TYPE, 2016-2030 (USD MILLION)
TABLE 137 CANADA AMINOPOLYCARBOLXYLATES (APCS) IN CHELATING AGENTS MARKET, BY TYPE, 2016-2030 (TONS)
TABLE 138 CANADA ORGANOPHOSPHATES IN CHELATING AGENTS MARKET, BY TYPE, 2016-2030 (USD MILLION)
TABLE 139 CANADA ORGANOPHOSPHATES IN CHELATING AGENTS MARKET, BY TYPE, 2016-2030 (TONS)
TABLE 140 CANADA ORGANIC ACIDS IN CHELATING AGENTS MARKET, BY TYPE, 2016-2030 (USD MILLION)
TABLE 141 CANADA ORGANIC ACIDS IN CHELATING AGENTS MARKET, BY TYPE, 2016-2030 (TONS)
TABLE 142 CANADA NATURAL IN CHELATING AGENTS MARKET, BY TYPE, 2016-2030 (USD MILLION)
TABLE 143 CANADA NATURAL IN CHELATING AGENTS MARKET, BY TYPE, 2016-2030 (TONS)
TABLE 144 CANADA CHELATING AGENTS MARKET, BY FORM, 2016-2030 (USD MILLION)
TABLE 145 CANADA CHELATING AGENTS MARKET, BY FORM, 2016-2030 (TONS)
TABLE 146 CANADA BIODEGRADABLE IN CHELATING AGENTS MARKET, BY FORM, 2016-2030 (USD MILLION)
TABLE 147 CANADA BIODEGRADABLE IN CHELATING AGENTS MARKET, BY FORM, 2016-2030 (TONS)
TABLE 148 CANADA CHELATING AGENTS MARKET, BY DISTRIBUTION CHANNEL, 2016-2030 (USD MILLION)
TABLE 149 CANADA CHELATING AGENTS MARKET, BY DISTRIBUTION CHANNEL, 2016-2030 (TONS)
TABLE 150 CANADA CHELATING AGENTS MARKET, BY END-USER, 2016-2030 (USD MILLION)
TABLE 151 CANADA CHELATING AGENTS MARKET, BY END-USER, 2016-2030 (TONS)
TABLE 152 CANADA PULP AND PAPER IN CHELATING AGENTS MARKET, BY FORM, 2016-2030 (USD MILLION)
TABLE 153 CANADA AGRICULTURE IN CHELATING AGENTS MARKET, BY TYPE, 2016-2030 (USD MILLION)
TABLE 154 CANADA CLEANERS AND DETERGENTS IN CHELATING AGENTS MARKET, BY FORM, 2016-2030 (USD MILLION)
TABLE 155 CANADA INDUSTRIAL CLEANING/DESCALING IN CHELATING AGENTS MARKET, BY FORM, 2016-2030 (USD MILLION)
TABLE 156 CANADA MINING IN CHELATING AGENTS MARKET, BY FORM, 2016-2030 (USD MILLION)
TABLE 157 CANADA TEXTILE PROCESSING IN CHELATING AGENTS MARKET, BY FORM, 2016-2030 (USD MILLION)
TABLE 158 CANADA OIL AND GAS IN CHELATING AGENTS MARKET, BY TYPE, 2016-2030 (USD MILLION)
TABLE 159 CANADA POLYMER PRODUCTION IN CHELATING AGENTS MARKET, BY FORM, 2016-2030 (USD MILLION)
TABLE 160 CANADA BUILDING AND CONSTRUCTION IN CHELATING AGENTS MARKET, BY FORM, 2016-2030 (USD MILLION)
TABLE 161 CANADA PHOTOGRAPHY IN CHELATING AGENTS MARKET, BY FORM, 2016-2030 (USD MILLION)
TABLE 162 CANADA ELECTRICAL AND ELECTRONICS IN CHELATING AGENTS MARKET, BY FORM, 2016-2030 (USD MILLION)
TABLE 163 CANADA FOOD AND FEED ADDITIVES IN CHELATING AGENTS MARKET, BY FORM, 2016-2030 (USD MILLION)
TABLE 164 CANADA PERSONAL CARE IN CHELATING AGENTS MARKET, BY FORM, 2016-2030 (USD MILLION)
TABLE 165 CANADA PHARMACEUTICALS IN CHELATING AGENTS MARKET, BY FORM, 2016-2030 (USD MILLION)
TABLE 166 CANADA OTHERS IN CHELATING AGENTS MARKET, BY FORM, 2016-2030 (USD MILLION)
TABLE 167 MEXICO CHELATING AGENTS MARKET, BY TYPE, 2016-2030 (USD MILLION)
TABLE 168 MEXICO CHELATING AGENTS MARKET, BY TYPE, 2016-2030 (TONS)
TABLE 169 MEXICO SYNTHETIC IN CHELATING AGENTS MARKET, BY TYPE, 2016-2030 (USD MILLION)
TABLE 170 MEXICO SYNTHETIC IN CHELATING AGENTS MARKET, BY TYPE, 2016-2030 (TONS)
TABLE 171 MEXICO AMINOPOLYCARBOLXYLATES (APCS) IN CHELATING AGENTS MARKET, BY TYPE, 2016-2030 (USD MILLION)
TABLE 172 MEXICO AMINOPOLYCARBOLXYLATES (APCS) IN CHELATING AGENTS MARKET, BY TYPE, 2016-2030 (TONS)
TABLE 173 MEXICO ORGANOPHOSPHATES IN CHELATING AGENTS MARKET, BY TYPE, 2016-2030 (USD MILLION)
TABLE 174 MEXICO ORGANOPHOSPHATES IN CHELATING AGENTS MARKET, BY TYPE, 2016-2030 (TONS)
TABLE 175 MEXICO ORGANIC ACIDS IN CHELATING AGENTS MARKET, BY TYPE, 2016-2030 (USD MILLION)
TABLE 176 MEXICO ORGANIC ACIDS IN CHELATING AGENTS MARKET, BY TYPE, 2016-2030 (TONS)
TABLE 177 MEXICO NATURAL IN CHELATING AGENTS MARKET, BY TYPE, 2016-2030 (USD MILLION)
TABLE 178 MEXICO NATURAL IN CHELATING AGENTS MARKET, BY TYPE, 2016-2030 (TONS)
TABLE 179 MEXICO CHELATING AGENTS MARKET, BY FORM, 2016-2030 (USD MILLION)
TABLE 180 MEXICO CHELATING AGENTS MARKET, BY FORM, 2016-2030 (TONS)
TABLE 181 MEXICO BIODEGRADABLE IN CHELATING AGENTS MARKET, BY FORM, 2016-2030 (USD MILLION)
TABLE 182 MEXICO BIODEGRADABLE IN CHELATING AGENTS MARKET, BY FORM, 2016-2030 (TONS)
TABLE 183 MEXICO CHELATING AGENTS MARKET, BY DISTRIBUTION CHANNEL, 2016-2030 (USD MILLION)
TABLE 184 MEXICO CHELATING AGENTS MARKET, BY DISTRIBUTION CHANNEL, 2016-2030 (TONS)
TABLE 185 MEXICO CHELATING AGENTS MARKET, BY END-USER, 2016-2030 (USD MILLION)
TABLE 186 MEXICO CHELATING AGENTS MARKET, BY END-USER, 2016-2030 (TONS)
TABLE 187 MEXICO PULP AND PAPER IN CHELATING AGENTS MARKET, BY FORM, 2016-2030 (USD MILLION)
TABLE 188 MEXICO AGRICULTURE IN CHELATING AGENTS MARKET, BY TYPE, 2016-2030 (USD MILLION)
TABLE 189 MEXICO CLEANERS AND DETERGENTS IN CHELATING AGENTS MARKET, BY FORM, 2016-2030 (USD MILLION)
TABLE 190 MEXICO INDUSTRIAL CLEANING/DESCALING IN CHELATING AGENTS MARKET, BY FORM, 2016-2030 (USD MILLION)
TABLE 191 MEXICO MINING IN CHELATING AGENTS MARKET, BY FORM, 2016-2030 (USD MILLION)
TABLE 192 MEXICO TEXTILE PROCESSING IN CHELATING AGENTS MARKET, BY FORM, 2016-2030 (USD MILLION)
TABLE 193 MEXICO OIL AND GAS IN CHELATING AGENTS MARKET, BY TYPE, 2016-2030 (USD MILLION)
TABLE 194 MEXICO POLYMER PRODUCTION IN CHELATING AGENTS MARKET, BY FORM, 2016-2030 (USD MILLION)
TABLE 195 MEXICO BUILDING AND CONSTRUCTION IN CHELATING AGENTS MARKET, BY FORM, 2016-2030 (USD MILLION)
TABLE 196 MEXICO PHOTOGRAPHY IN CHELATING AGENTS MARKET, BY FORM, 2016-2030 (USD MILLION)
TABLE 197 MEXICO ELECTRICAL AND ELECTRONICS IN CHELATING AGENTS MARKET, BY FORM, 2016-2030 (USD MILLION)
TABLE 198 MEXICO FOOD AND FEED ADDITIVES IN CHELATING AGENTS MARKET, BY FORM, 2016-2030 (USD MILLION)
TABLE 199 MEXICO PERSONAL CARE IN CHELATING AGENTS MARKET, BY FORM, 2016-2030 (USD MILLION)
TABLE 200 MEXICO PHARMACEUTICALS IN CHELATING AGENTS MARKET, BY FORM, 2016-2030 (USD MILLION)
TABLE 201 MEXICO OTHERS IN CHELATING AGENTS MARKET, BY FORM, 2016-2030 (USD MILLION)
List of Figure
FIGURE 1 NORTH AMERICA CHELATING AGENTS MARKET: SEGMENTATION
FIGURE 2 NORTH AMERICA CHELATING AGENTS MARKET: DATA TRIANGULATION
FIGURE 3 NORTH AMERICA CHELATING AGENTS MARKET: DROC ANALYSIS
FIGURE 4 NORTH AMERICA CHELATING AGENTS MARKET : NORTH AMERICA VS REGIONAL MARKET ANALYSIS
FIGURE 5 NORTH AMERICA CHELATING AGENTS MARKET : COMPANY RESEARCH ANALYSIS
FIGURE 6 NORTH AMERICA CHELATING AGENTS MARKET: INTERVIEW DEMOGRAPHICS
FIGURE 7 NORTH AMERICA CHELATING AGENTS MARKET: DBMR MARKET POSITION GRID
FIGURE 8 NORTH AMERICA CHELATING AGENTS MARKET: MARKET APPLICATION COVERAGE GRID
FIGURE 9 NORTH AMERICA CHELATING AGENTS MARKET: SEGMENTATION
FIGURE 10 RISE IN DEMAND FROM PULP & PAPER INDUSTRY IS DRIVING THE NORTH AMERICA CHELATING AGENTS MARKET IN THE FORECAST PERIOD OF 2023 TO 2030
FIGURE 11 THE SYNTHETIC CHELATING AGENTS SEGMENT IS EXPECTED TO ACCOUNT FOR THE LARGEST SHARE OF THE NORTH AMERICA CHELATING AGENTS MARKET IN 2023 & 2030
FIGURE 12 THE CHANGE IN PRICES OF CHELATING AGENTS IN THE NORTH AMERICA MARKET HAS BEEN GIVEN BELOW.
FIGURE 13 DRIVERS, RESTRAINTS, OPPORTUNITIES AND CHALLENGES OF NORTH AMERICA CHELATING AGENTS MARKET
FIGURE 14 NORTH AMERICA CHELATING AGENTS MARKET: BY TYPE, 2022
FIGURE 15 NORTH AMERICA CHELATING AGENTS MARKET: BY FORM, 2022
FIGURE 16 NORTH AMERICA CHELATING AGENTS MARKET: BY DISTRIBUTION CHANNEL, 2022
FIGURE 17 NORTH AMERICA CHELATING AGENTS MARKET: BY END USER, 2022
FIGURE 18 NORTH AMERICA CHELATING AGENTS MARKET: SNAPSHOT (2022)
FIGURE 19 NORTH AMERICA CHELATING AGENTS MARKET: BY COUNTRY (2022)
FIGURE 20 NORTH AMERICA CHELATING AGENTS MARKET: BY COUNTRY (2023 & 2030)
FIGURE 21 NORTH AMERICA CHELATING AGENTS MARKET: BY COUNTRY (2022 & 2030)
FIGURE 22 NORTH AMERICA CHELATING AGENTS MARKET: BY TYPE (2023-2030)
FIGURE 23 NORTH AMERICA CHELATING AGENTS MARKET: COMPANY SHARE 2022 (%)
North America Chelating Agents Market, Supply Chain Analysis and Ecosystem Framework
To support market growth and help clients navigate the impact of geopolitical shifts, DBMR has integrated in-depth supply chain analysis into its North America Chelating Agents Market research reports. This addition empowers clients to respond effectively to global changes affecting their industries. The supply chain analysis section includes detailed insights such as North America Chelating Agents Market consumption and production by country, price trend analysis, the impact of tariffs and geopolitical developments, and import and export trends by country and HSN code. It also highlights major suppliers with data on production capacity and company profiles, as well as key importers and exporters. In addition to research, DBMR offers specialized supply chain consulting services backed by over a decade of experience, providing solutions like supplier discovery, supplier risk assessment, price trend analysis, impact evaluation of inflation and trade route changes, and comprehensive market trend analysis.
Data collection and base year analysis are done using data collection modules with large sample sizes. The stage includes obtaining market information or related data through various sources and strategies. It includes examining and planning all the data acquired from the past in advance. It likewise envelops the examination of information inconsistencies seen across different information sources. The market data is analysed and estimated using market statistical and coherent models. Also, market share analysis and key trend analysis are the major success factors in the market report. To know more, please request an analyst call or drop down your inquiry.
The key research methodology used by DBMR research team is data triangulation which involves data mining, analysis of the impact of data variables on the market and primary (industry expert) validation. Data models include Vendor Positioning Grid, Market Time Line Analysis, Market Overview and Guide, Company Positioning Grid, Patent Analysis, Pricing Analysis, Company Market Share Analysis, Standards of Measurement, Global versus Regional and Vendor Share Analysis. To know more about the research methodology, drop in an inquiry to speak to our industry experts.
Data Bridge Market Research is a leader in advanced formative research. We take pride in servicing our existing and new customers with data and analysis that match and suits their goal. The report can be customized to include price trend analysis of target brands understanding the market for additional countries (ask for the list of countries), clinical trial results data, literature review, refurbished market and product base analysis. Market analysis of target competitors can be analyzed from technology-based analysis to market portfolio strategies. We can add as many competitors that you require data about in the format and data style you are looking for. Our team of analysts can also provide you data in crude raw excel files pivot tables (Fact book) or can assist you in creating presentations from the data sets available in the report.


