
North America Chinese Hamster Ovary Cells Cho Market
Market Size in USD Million
 USD
158.66 Million
USD
293.69 Million
2024
2032
USD
158.66 Million
USD
293.69 Million
2024
2032
| 2025 - 2032 | |
| USD 158.66 Million | |
| USD 293.69 Million | |
| % | |
|
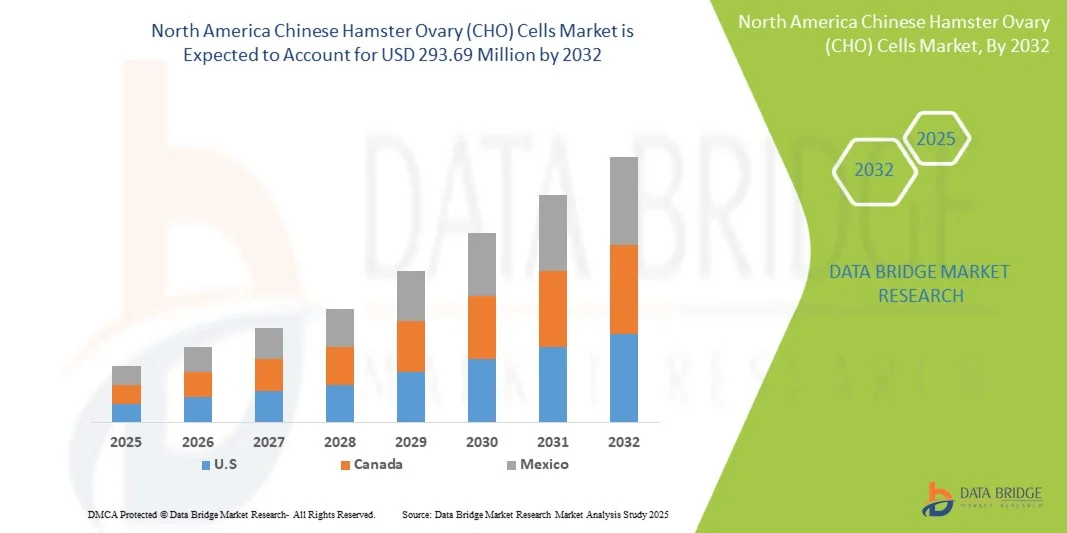
North America Chinese Hamster Ovary (CHO) Cells Market Size
- The North America Chinese Hamster Ovary (CHO) Cells Market was valued at USD 158.66 Million in 2024 and is expected to reach USD 293.69 Million by 2032
- During the forecast period of 2025 to 2032 the market is likely to grow at a CAGR of 8.0%, primarily driven by the Rising use of CHO cells in the genetic study.
- This growth is driven by factors such as increasing demand for biologics, advancements in cell line engineering, rising investments in biotechnology research, and expanding applications in gene therapy.
North America Chinese Hamster Ovary (CHO) Cells Market Analysis
- Chinese Hamster Ovary (CHO) cells are a type of mammalian cell line which is commonly used in biotechnology and biomedical research, particularly in the field of cell culture and bioprocessing. These cells have become essential tools in biotechnology and biomedical research. CHO cells are known for their adherence to culture surfaces, robust growth characteristics, and ability to express recombinant proteins.
- One of the primary uses of CHO cells is in the production of recombinant proteins, including therapeutic antibodies and enzymes. They can be genetically engineered to express specific genes of interest, and their capacity for performing post-translational modifications similar to human cells ensures the quality of biopharmaceutical products. CHO cells are also renowned for their genetic stability, which means they introduced genetic modifications consistently over multiple generations, ensuring the reliability and consistency of bioprocessing.
- In 2025, the services segment is expected to dominate the market with a 65.50% market share owing to the increasing demand for specialized services related to CHO cell line development, bioprocessing, and contract manufacturing.
Report Scope and Ophthalmic Operational Microscope Market Segmentation
|
Attributes |
Ophthalmic Operational Microscope Key Market Insights |
|
Segments Covered |
|
|
Countries Covered |
North America
|
|
Key Market Players |
|
|
Market Opportunities |
|
|
Value Added Data Infosets |
In addition to the insights on market scenarios such as market value, growth rate, segmentation, geographical coverage, and major players, the market reports curated by the Data Bridge Market Research also include import export analysis, production capacity overview, production consumption analysis, price trend analysis, climate change scenario, supply chain analysis, value chain analysis, raw material/consumables overview, vendor selection criteria, PESTLE Analysis, Porter Analysis, and regulatory framework. |
North America Chinese Hamster Ovary (CHO) Cells Market Trends
“Growing Integration of Artificial Intelligence (AI) in Cell Line Development”
- One prominent trend in the North America Chinese Hamster Ovary (CHO) Cells Market is the increasing integration of artificial intelligence (AI) in cell line development and bioprocess optimization.
- AI algorithms are being used to analyze large datasets, predict optimal culture conditions, and identify high-yielding clones more efficiently than traditional methods.
- For instance, machine learning models can process experimental data to predict cell performance, reducing the time and cost associated with trial-and-error approaches in CHO cell-based production.
- This technology enables faster development timelines, improved product quality, and better scalability for biologic manufacturing.
- The use of AI is transforming CHO cell research and biomanufacturing, leading to increased efficiency, reduced development costs, and a competitive edge for companies adopting advanced digital solutions.
North America Chinese Hamster Ovary (CHO) Cells Market Dynamics
Driver
“Rising Use of CHO Cells in the Genetic Study”
- Rising application of Chinese Hamster Ovary (CHO) cells in genetic research is a clear and accelerating driver for the North America CHO market. As genetic tools (CRISPR, RMCE, RNA-seq, single-cell multi-omics) mature, CHO cells are no longer merely production hosts; they are experimental platforms for dissecting genotype–phenotype relationships, testing gene-editing strategies, and rationally engineering host traits (growth, productivity, glycosylation, stress tolerance).
- That shift expands demand across three linked market vectors: (1) upstream—licensed/engineered CHO cell lines and gene-editing services; (2) process development—analytics, omics, digital-twin and AI tools needed to translate genetic insights into stable high-yield clones; and (3) manufacturing—CDMO capacity and single-use/continuous platforms optimized for genetically enhanced hosts.
- In short, genetic-study activity feeds an expanding ecosystem (software, analytics, cell-banking, reagents, CDMO runs), increasing both the breadth and depth of commercial CHO offerings and therefore raising market size, billings, and strategic importance of CHO-derived manufacturing capabilities.
- For Instance- In January 2025, an article in NIH stated that a genome-scale, non-viral CRISPR knockout screening dataset for CHO-K1 and derived recombinant cells was published (Sci Data), providing a comprehensive resource to identify genes that affect cell fitness and protein production—evidence that functional genomic screening in CHO is now mature, publicly documented, and directly informing cell-engineering programs.
- In April 2025, article published in NIH stated that a meta-analysis of CHO transcriptomes (“Fantastic genes…”) was accepted/published on PMC (open-access) after revision in early 2025; the paper integrates RNA-seq and epigenetic data across hundreds of CHO samples and calls out the need for targeted genetic engineering to control expression programs—this is direct evidence that genomic/epigenomic studies of CHO are defining engineering targets for industrial cell-line improvement.
- The rising use of CHO cells in genetic studies is not only reinforcing their dominance as the gold-standard expression system for biologics but also expanding their role as experimental platforms for functional genomics, regulatory testing, and cell engineering.
Opportunity
“Continuous Development of Cell-Culture Technologies”
- Continuous advances in cell-culture technologies are creating a unique opportunity set for the North America Chinese Hamster Ovary (CHO) cell market.
- Improvements in bioreactor design and perfusion processes, coupled with precision cell-line engineering, site-specific integration tools, and machine-learning driven process optimisation, are steadily raising CHO productivities, stability, and product quality while lowering per-batch costs.
- For instance- In June 2021, World Health Organization reported that it was supporting a South African consortium to establish the first COVID mRNA vaccine technology transfer hub to build regional manufacturing capability and share know-how for advanced biologics production.
- In April 2022, Medicines Patent Pool reported that the World Health Organization and the MPP had announced 15 manufacturers to receive training from the WHO mRNA technology transfer programme, demonstrating an ongoing, multi-year public effort to spread advanced vaccine and biologics manufacturing capacity.
- The selected instances collectively show that continuous development of cell-culture technologies is no longer confined to isolated labs or vendor roadmaps it is being actively accelerated by coordinated public efforts, regulatory updates, and peer-reviewed technical innovations.
Restraint/Challenge
“High Cost of CHO Cell–Based Production as a Market Restraint”
- The high capital and operating costs associated with CHO cell–based biologics production represent a major restraint on the North America CHO cells market.
- Large upfront investments in bioreactor capacity, cleanrooms, single-use systems or stainless-steel infrastructure, and specialized downstream purification equipment—combined with expensive raw materials (media, chromatography resins), skilled labour, complex regulatory compliance and long validation timelines—raise the total cost of ownership for manufacturers and CDMOs.
- These cost pressures increase time-to-market, compress margins, discourage smaller developers from in-house manufacturing, and can slow adoption in lower-income regions; collectively they constrain demand for new cell lines, consumables and service contracts tied to CHO platforms.
- For instance- In July 2025, the U.S. Department of Health & Human Services’ Office of the Assistant Secretary for Planning and Evaluation (HHS-ASPE) released an issue brief noting that spending on biologics has been increasing substantially and that biologics’ complexity and cost profile (development and manufacturing) are material drivers of rising drug expenditures—underscoring the economic restraint posed by biologics/CHO manufacturing costs.
- In March 2024, the European Commission published policy and research material (Joint Research Centre / DG R&I analyses) noting that biotech and biomanufacturing require highly specialised equipment and skilled multidisciplinary workforces—factors that increase manufacturing unit costs and present barriers for scaling production across the EU.
- Despite being the gold standard for therapeutic protein and monoclonal antibody production, CHO cell–based manufacturing remains significantly constrained by its high cost structure. Capital-intensive infrastructure requirements, costly raw materials, specialized workforce needs, and stringent compliance processes elevate overall production expenses, limiting participation by smaller firms and hindering access in emerging markets
North America Chinese Hamster Ovary (CHO) Cells Market Scope
The market is segmented on the basis type, system, application, end-user, and distribution channel.
- By Type
On the basis of type, the market is segmented into services, products and others, In 2025, the services segment is expected to dominate the market with 66.50%, and expected to be fastest growing segment with 8.3% CAGR. This growth can be attributed to the increasing reliance on contract research organizations (CROs) and contract development and manufacturing organizations (CDMOs) for specialized cell line development, process optimization, and large-scale biomanufacturing. Additionally, the rising complexity of biologics production, high costs associated with in-house facilities, and growing demand for customized solutions are encouraging pharmaceutical and biotechnology companies to outsource more services. These factors collectively drive the expansion of the services segment, enhancing its market share and growth potential over the forecast period.
- By System
On the basis of system, the market is segmented into Metabolic Selection System, Antibiotic Selection System, and Others, In 2025, the Metabolic Selection System segment is expected to dominate the market with 58.17%, and expected to be fastest growing segment with 8.3% CAGR, This growth is primarily driven by the increasing adoption of metabolic selection systems for stable and high-yield recombinant protein production, as they eliminate the need for antibiotic resistance markers, reduce regulatory concerns, and enhance culture efficiency. Moreover, the growing preference for safer, cost-effective, and scalable cell line development techniques in biologics and biosimilar manufacturing further supports the expansion of this segment.
- By Application
On the basis of application, the market is segmented into Biologics, and Medical Research, In 2025, the Biologics segment is expected to dominate the market with 71.48%, and expected to be fastest growing segment with 8.2% CAGR, This growth is mainly attributed to the increasing demand for therapeutic proteins, monoclonal antibodies, and vaccines, coupled with the rising prevalence of chronic and autoimmune diseases. Additionally, advancements in bioprocessing technologies, expanding biopharmaceutical R&D investments, and the growing adoption of Chinese Hamster Ovary (CHO) cells for high-quality and scalable biologics production further propel the dominance and rapid expansion of the Biologics segment in the market.
- By End User
On the basis of end user, the market is segmented into Biopharmaceutical Companies, Biotechnology Companies, Clinical Development and Manufacturing Organizations, Clinical Research Organizations, Academic Institutes and Research Organizations, and Others, In 2025, the Biopharmaceutical Companies segment is expected to dominate the market with 43.07%, This dominance is driven by the increasing focus of biopharmaceutical companies on developing biologics, monoclonal antibodies, and gene therapies, which heavily rely on advanced cell lines like CHO cells for high-yield and high-quality protein production. Additionally, rising R&D investments, the expansion of biologics pipelines, and the need for scalable and cost-effective production processes further reinforce the leading position of biopharmaceutical companies in the market.
- By Distribution Channel
On the basis of Distribution Channel, the market is segmented into Direct Tenders, Retail Sales, and Others, In 2025, the Direct Tenders segment is expected to dominate the market with 55.46%, and Retail Sales expected to be fastest growing segment with 7.8% CAGR. The dominance of direct tenders is driven by bulk procurement by large biopharmaceutical and research organizations seeking cost efficiency, reliable supply, and long-term contracts. Meanwhile, the rapid growth of retail sales is fueled by increasing accessibility of research products to smaller laboratories and academic institutes, rising demand for ready-to-use kits, and the expansion of e-commerce platforms for scientific supplies, making products more readily available across diverse end users.
North America Chinese Hamster Ovary (CHO) Cells Market Regional Analysis
“North America is the Dominant Region in the Chinese Hamster Ovary (CHO) Cells”
- U.S. holds the largest share in the North America CHO cells market, driven by a well-established biopharmaceutical industry, advanced healthcare infrastructure, and the strong presence of leading pharmaceutical and biotechnology companies.
- The United States, in particular, contributes significantly to regional dominance due to high R&D spending, increasing demand for biologics, and extensive use of CHO cells in the production of therapeutic proteins such as monoclonal antibodies.
- Government support for biologics development, coupled with robust regulatory frameworks and favorable reimbursement policies, further accelerates market growth. Moreover, strategic collaborations, technological advancements in cell line development, and an increase in FDA approvals for CHO cell-derived products continue to boost market expansion across the region.
U.S. CHO cells Market Insight
- The U.S. CHO cells market accounted for the largest market revenue share in the North American CHO cells market in 2025, attributed to the country’s well-established biopharmaceutical industry, significant R&D investments, presence of major biotechnology and pharmaceutical companies, advanced biologics manufacturing infrastructure, and strong government support for innovation in cell line development and biologics production.
Canada CHO cells Market Insight
- The Canada CHO cells market is expected to register a significant CAGR in North America from 2025 to 2032, driven by growing investments in biopharmaceutical research, increasing adoption of advanced cell line technologies, expansion of biologics and biosimilar production facilities, and supportive government initiatives promoting biotechnology and life sciences innovation.
North America Chinese Hamster Ovary (CHO) Cells Market Share
The market competitive landscape provides details by competitor. Details included are company overview, company financials, revenue generated, market potential, investment in research and development, new market initiatives, North America presence, production sites and facilities, production capacities, company strengths and weaknesses, product launch, product width and breadth, application dominance. The above data points provided are only related to the companies' focus related to market.
The Major Market Leaders Operating in the Market Are:
- Thermo Fisher Scientific Inc. (U.S.)
- AcceGen (U.S.)
- RayBiotech Life, Inc. (U.S.)
- Cytion (Germany)
- BPS Bioscience, Inc. (U.S.)
- GenTarget Inc. (U.S.)
- Merck KGaA (Germany)
- Promega Corporation (U.S.)
- Abeomics (U.S.)
- Applied Biological Materials Inc. (Canada)
- ATCC (U.S.)
- Sartorius AG (Germany)
- Lonza (Switzerland)
- Revvity Discovery Limited (U.S.)
- Cytiva (U.S.)
- GTP Bioways (France)
- Curia North America, Inc. (U.S.)
- Abbott (U.S.)
Latest Developments in North America Chinese Hamster Ovary (CHO) Cells
- In February 2022, Sartorius acquired business from Novasep, added a complementary offering to its chromatography portfolio. The acquired portfolio includes chromatography systems primarily suited for small biomolecules such as oligonucleotides, peptides, and insulin, and innovative systems for the continuous production of biopharmaceuticals.
- In July 2023, Lonza launched TheraPRO CHO Media System, a new cell culture medium that simplifies processes and optimizes productivity and protein quality when using GS-CHO cell lines. The start-up supports pharmaceutical and biotech companies producing therapeutic proteins to further improve product quality. The TheraPRO CHO Media System provides efficient performance, achieving high concentrations of viable cells and protein titers above 5 g/L over a 15-day culture period. This represents more than double the protein titer that can be produced with commercially available solutions. This launch has helped the company to expand its product portfolio in the market.
- In October 2022, Thermo Fisher Scientific Inc. collaborated with ProBioGen to develop better platform the Gibco Freedom ExpiCHO-S Cell Line Development Kit. This kit allows users to generate cell lines suitable for clinical development without their own original cells, vectors, or previous experience in the field. ProBioGen significantly contributed to the performance of the Freedom ExpiCHO-S kit by leveraging its strong expertise in cell line and process development. The new series utilizes Thermo Fisher's ExpiCHO-S cell line expanding the company's product portfolio for the CHO cell line development series.
- In July 2023, Merck announced that it is expanding its facility in Lenexa, Kansas, U.S., adding 9,100 square meters of laboratory space and production capacity for the production of cell culture media. This expansion makes Lenexa the company's largest dry powder cell culture facility and a center of excellence in North America. The investment in the region reflects the company's strategy to expand and diversify its supply chain to meet current and future demand for cell culture platforms.
- In November 2022, ATCC, the world's leading regulatory and standards organization for biological materials, announced a new line of CAR-T Target luciferase reporter cell lines to support immuno-oncology (IO) discovery and the development of new immunotherapies. These models have a high endogenous expression of relevant chimeric antigen receptor (CAR) T target antigens such as HER2, CD19, and CD20. These new IO tools consist of both hematologic cancers and solid tumor cell lines expressing a luciferase reporter. This helped the company to expand its product portfolio.
SKU-

- Interactive Data Analysis Dashboard
- Company Analysis Dashboard for high growth potential opportunities
- Research Analyst Access for customization & queries
- Competitor Analysis with Interactive dashboard
- Latest News, Updates & Trend analysis
- Harness the Power of Benchmark Analysis for Comprehensive Competitor Tracking
Table of Content
1 INTRODUCTION
1.1 OBJECTIVES OF THE STUDY
1.2 MARKET DEFINITION
1.3 OVERVIEW OF THE NORTH AMERICA CHINESE HAMSTER OVARY (CHO) CELLS MARKET
1.4 LIMITATIONS
1.5 MARKETS COVERED
2 MARKET SEGMENTATION
2.1 MARKETS COVERED
2.2 GEOGRAPHICAL SCOPE
2.3 YEARS CONSIDERED FOR THE STUDY
2.4 CURRENCY AND PRICING
2.5 DBMR TRIPOD DATA VALIDATION MODEL
2.6 MULTIVARIATE MODELLING
2.7 PRIMARY INTERVIEWS WITH KEY OPINION LEADERS
2.8 DBMR MARKET POSITION GRID
2.9 MARKET APPLICATION COVERAGE GRID
2.1 VENDOR SHARE ANALYSIS
2.11 SECONDARY SOURCES
2.12 ASSUMPTIONS
3 EXECUTIVE SUMMARY
4 PREMIUM INSIGHTS
4.1 PESTAL ANALYSIS
4.2 PORTER'S FIVE FORCES ANALYSIS
4.3 PATENT ANALYSIS – NORTH AMERICA CHO CELLS MARKET
4.3.1 PATENT QUALITY AND STRENGTH
4.3.2 PATENT FAMILIES
4.3.3 LICENSING AND COLLABORATIONS
4.3.4 COMPETITIVE LANDSCAPE
4.3.5 IP STRATEGY AND MANAGEMENT
4.3.6 OTHER OBSERVATIONS
4.4 INDUSTRY INSIGHTS
4.4.1 MICRO AND MACRO ECONOMIC FACTORS
4.4.2 PENETRATION AND GROWTH PROSPECT MAPPING
4.4.3 KEY PRICING STRATEGIES
4.5 INNOVATION TRACKER AND STRATEGIC ANALYSIS
4.5.1 MAJOR DEALS AND STRATEGIC ALLIANCES ANALYSIS
4.5.1.1 JOINT VENTURES
4.5.1.2 MERGERS AND ACQUISITIONS
4.5.1.3 LICENSING AND PARTNERSHIP
4.5.1.4 TECHNOLOGY COLLABORATIONS
4.5.1.5 STRATEGIC DIVESTMENTS
4.5.2 NUMBER OF PRODUCTS IN DEVELOPMENT
4.5.3 STAGE OF DEVELOPMENT
4.5.4 TIMELINES AND MILESTONES
4.5.5 INNOVATION STRATEGIES AND METHODOLOGIES
4.5.6 RISK ASSESSMENT AND MITIGATION
4.5.7 FUTURE OUTLOOK
4.6 OPPORTUNITY MAP
4.7 PRICING ANALYSIS – NORTH AMERICA CHINESE HAMSTER OVARY (CHO) CELLS MARKET
4.8 RAW MATERIAL COVERAGE
4.9 VALUE CHAIN ANALYSIS
4.1 CONSUMER BUYING BEHAVIOUR
4.11 TECHNOLOGICAL ADVANCEMENTS
5 TARIFFS & IMPACT ON THE MARKET
5.1 CURRENT TARIFF RATE
5.2 OUTLOOK — LOCAL PRODUCTION VS. IMPORT RELIANCE
5.3 VENDOR SELECTION CRITERIA DYNAMICS
5.4 IMPACT ON SUPPLY CHAIN
5.4.1 RAW MATERIAL PROCUREMENT
5.4.2 MANUFACTURING AND PRODUCTION
5.4.3 LOGISTICS AND DISTRIBUTION
5.4.4 PRICE PITCHING AND MARKET POSITION
5.5 INDUSTRY PARTICIPANTS
5.5.1 SUPPLY CHAIN OPTIMIZATION
5.5.2 JOINT VENTURE AND LOCAL PARTNERSHIPS
5.6 IMPACT ON PRICES
5.7 REGULATORY INCLINATION
5.7.1 GEOPOLITICAL SITUATION
5.7.2 TRADE PARTNERSHIPS BETWEEN COUNTRIES
5.7.2.1 FREE TRADE AGREEMENTS
5.7.2.2 ALLIANCES ESTABLISHMENTS
5.7.3 STATUS ACCREDITATION (INCLUDING MFN)
5.7.4 DOMESTIC COURSE OF CORRECTION
5.7.4.1 INCENTIVE SCHEMES TO BOOST PRODUCTION OUTPUTS
5.7.4.2 ESTABLISHMENT OF SPECIAL ECONOMIC ZONES / INDUSTRIAL PARKS
6 REGULATORY FRAMEWORK – NORTH AMERICA CHO CELLS MARKET
6.1 NORTH AMERICA
6.2 EUROPE
6.3 ASIA-PACIFIC
6.4 SOUTH AMERICA
6.5 MIDDLE EAST & AFRICA
7 MARKET OVERVIEW
7.1 DRIVER
7.1.1 RISING USE OF CHO CELLS IN THE GENETIC STUDY
7.1.2 GROWING DEMAND FOR BIOPHARMACEUTICALS
7.1.3 RISING INVESTMENTS IN BIOTECHNOLOGY R&D
7.1.4 RISING DEMAND FOR MONOCLONAL ANTIBODIES
7.2 RESTRAINT
7.2.1 HIGH COST OF CHO CELL–BASED PRODUCTION AS A MARKET RESTRAINT
7.2.2 STRICT REGULATORY REQUIREMENTS FOR CHO CELL-BASED PRODUCTION
7.3 OPPORTUNITY
7.3.1 CONTINUOUS DEVELOPMENT OF CELL-CULTURE TECHNOLOGIES
7.3.2 RISING NUMBER OF APPLICATIONS OF CHO CELLS
7.3.3 ADVANCES IN CELL-LINE ENGINEERING & SYNTHETIC BIOLOGY
7.4 CHALLENGES
7.4.1 TIME-CONSUMING AND INCONSISTENCY IN CHO CELL LINE DEVELOPMENT PROCESS
7.4.2 CONTAMINATION RISK OF CHO CELL CULTURES
8 NORTH AMERICA CHINESE HAMSTER OVARY (CHO) CELLS MARKET, BY TYPE
8.1 OVERVIEW
8.2 SERVICES
8.3 PRODUCT
8.3.1 CHO-K1
8.3.1.1 CHO-K1 ATCC
8.3.1.2 CHO-K1 ECACC
8.3.1.3 Others
8.3.2 CHO-DG44
8.3.3 CHO-S
8.3.4 CHO-DXB11
8.3.5 OTHERS
9 NORTH AMERICA CHINESE HAMSTER OVARY (CHO) CELLS MARKET, BY SYSTEM
9.1 OVERVIEW
9.2 METABOLIC SELECTION SYSTEM
9.3 ANTIBIOTIC SELECTION SYSTEM
9.4 OTHERS
10 NORTH AMERICA CHINESE HAMSTER OVARY (CHO) CELLS MARKET, BY APPLICATION
10.1 OVERVIEW
10.2 BIOLOGICS
10.2.1 MONOCLONAL ANTIBODIES
10.2.2 FC-FUSION PROTIEN
10.2.3 ENZYMES
10.2.4 HORMONES
10.2.5 CYTOKINES
10.2.6 CLOTTING FACTORS
10.2.7 OTHERS
10.3 MEDICAL RESEARCH
11 NORTH AMERICA CHINESE HAMSTER OVARY (CHO) CELLS MARKET, BY END USER
11.1 OVERVIEW
11.2 BIOPHARMACEUTICAL COMPANIES
11.2.1 MEDIUM
11.2.2 SMALL
11.3 CLINICAL DEVELOPMENT AND MANUFACTURING ORGANIZATIONS
11.3.1 MEDIUM
11.3.2 SMALL
11.4 BIOTECHNOLOGY COMPANIES
11.4.1 MEDIUM
11.4.2 SMALL
11.5 ACADEMIC INSTITUTES AND RESEARCH ORGANIZATIONS
11.6 CLINICAL RESEARCH ORGANIZATIONS
11.6.1 MEDIUM
11.6.2 SMALL
11.7 OTHERS
12 NORTH AMERICA CHINESE HAMSTER OVARY (CHO) CELLS MARKET, BY DISTRIBUTION CHANNEL
12.1 OVERVIEW
12.2 DIRECT TENDERS
12.3 RETAIL SALES
12.4 OTHERS
13 NORTH AMERICA CHINESE HAMSTER OVARY (CHO) CELLS MARKET, BY REGION
13.1 NORTH AMERICA
13.1.1 U.S.
13.1.2 CANADA
13.1.3 MEXICO
14 NORTH AMERICA CHINESE HAMSTER OVARY (CHO) CELLS MARKET: COMPANY LANDSCAPE
14.1 COMPANY SHARE ANALYSIS: NORTH AMERICA
15 SWOT ANALYSIS
16 COMPANY PROFILE
16.1 SARTORIUS AG
16.1.1 COMPANY SNAPSHOT
16.1.2 REVENUE ANALYSIS
16.1.3 COMPANY SHARE ANALYSIS
16.1.4 PRODUCT PORTFOLIO
16.1.5 RECENT DEVELOPMENT
16.2 LONZA
16.2.1 COMPANY SNAPSHOT
16.2.2 REVENUE ANALYSIS
16.2.3 COMPANY SHARE ANALYSIS
16.2.4 PRODUCT PORTFOLIO
16.2.5 RECENT DEVELOPMENT
16.3 THERMO FISHER SCIENTIFIC INC.
16.3.1 COMPANY SNAPSHOT
16.3.2 REVENUE ANALYSIS
16.3.3 COMPANY SHARE ANALYSIS
16.3.4 PRODUCT PORTFOLIO
16.3.5 RECENT DEVELOPMENT
16.4 CYTIVA
16.4.1 COMPANY SNAPSHOT
16.4.2 COMPANY SHARE ANALYSIS
16.4.3 PRODUCT PORTFOLIO
16.4.4 RECENT DEVELOPMENT
16.5 MERCK KGAA
16.5.1 COMPANY SNAPSHOT
16.5.2 REVENUE ANALYSIS
16.5.3 COMPANY SHARE ANALYSIS
16.5.4 PRODUCT PORTFOLIO
16.5.5 RECENT DEVELOPMENT
16.6 ABEOMICS
16.6.1 COMPANY SNAPSHOT
16.6.2 PRODUCT PORTFOLIO
16.6.3 RECENT DEVELOPMENT
16.7 ACCEGEN
16.7.1 COMPANY SNAPSHOT
16.7.2 PRODUCT PORTFOLIO
16.7.3 RECENT DEVELOPMENT
16.8 APPLIED BIOLOGICAL MATERIALS INC. (ABM)
16.8.1 COMPANY SNAPSHOT
16.8.2 PRODUCT PORTFOLIO
16.8.3 RECENT DEVELOPMENT
16.9 ATCC
16.9.1 COMPANY SNAPSHOT
16.9.2 PRODUCT PORTFOLIO
16.9.3 RECENT DEVELOPMENT
16.1 BPS BIOSCIENCE, INC.
16.10.1 COMPANY SNAPSHOT
16.10.2 PRODUCT PORTFOLIO
16.10.3 RECENT DEVELOPMENT
16.11 CYTION
16.11.1 COMPANY SNAPSHOT
16.11.2 PRODUCT PORTFOLIO
16.11.3 RECENT DEVELOPMENT
16.12 CURIA GLOBAL, INC.
16.12.1 COMPANY SNAPSHOT
16.12.2 SERVICE PORTFOLIO
16.12.3 RECENT DEVELOPMENT
16.13 GENTARGET INC.
16.13.1 COMPANY SNAPSHOT
16.13.2 PRODUCT PORTFOLIO
16.13.3 RECENT DEVELOPMENT
16.14 GTP BIOWAYS
16.14.1 COMPANY SNAPSHOT
16.14.2 PRODUCT PORTFOLIO
16.14.3 RECENT DEVELOPMENT
16.15 PROMEGA CORPORATION
16.15.1 COMPANY SNAPSHOT
16.15.2 PRODUCT PORTFOLIO
16.15.3 RECENT DEVELOPMENT
16.16 RAYBIOTECH LIFE, INC.
16.16.1 COMPANY SNAPSHOT
16.16.2 PRODUCT PORTFOLIO
16.16.3 RECENT DEVELOPMENT
16.17 REVVITY DISCOVERY LIMITED.
16.17.1 COMPANY SNAPSHOT
16.17.2 PRODUCT PORTFOLIO
16.17.3 RECENT DEVELOPMENT
17 QUESTIONNAIRE
18 RELATED REPORTS
List of Table
TABLE 1 NORTH AMERICA CHINESE HAMSTER OVARY (CHO) CELLS MARKET, BY TYPE, 2018-2032 (USD THOUSAND)
TABLE 2 NORTH AMERICA SERVICES IN CHINESE HAMSTER OVARY (CHO) CELLS MARKET, BY REGION, 2018-2032 (USD THOUSAND)
TABLE 3 NORTH AMERICA PRODUCT IN CHINESE HAMSTER OVARY (CHO) CELLS MARKET, BY REGION, 2018-2032 (USD THOUSAND)
TABLE 4 NORTH AMERICA PRODUCT IN CHINESE HAMSTER OVARY (CHO) CELLS MARKET, BY TYPE, 2018-2032 (USD THOUSAND)
TABLE 5 NORTH AMERICA CHO-K1 IN CHINESE HAMSTER OVARY (CHO) CELLS MARKET, BY TYPE, 2018-2032 (USD THOUSAND)
TABLE 6 NORTH AMERICA CHINESE HAMSTER OVARY (CHO) CELLS MARKET, BY SYSTEM, 2018-2032 (USD THOUSAND)
TABLE 7 NORTH AMERICA METABOLIC SELECTION SYSTEM IN CHINESE HAMSTER OVARY (CHO) CELLS MARKET, BY REGION, 2018-2032 (USD THOUSAND)
TABLE 8 NORTH AMERICA ANTIBIOTIC SELECTION SYSTEM IN CHINESE HAMSTER OVARY (CHO) CELLS MARKET, BY REGION, 2018-2032 (USD THOUSAND)
TABLE 9 NORTH AMERICA OTHERS IN CHINESE HAMSTER OVARY (CHO) CELLS MARKET, BY REGION, 2018-2032 (USD THOUSAND)
TABLE 10 NORTH AMERICA CHINESE HAMSTER OVARY (CHO) CELLS MARKET, BY APPLICATION, 2018-2032 (USD THOUSAND)
TABLE 11 NORTH AMERICA BIOLOGICS IN CHINESE HAMSTER OVARY (CHO) CELLS MARKET, BY REGION, 2018-2032 (USD THOUSAND)
TABLE 12 NORTH AMERICA BIOLOGICS IN CHINESE HAMSTER OVARY (CHO) CELLS MARKET, BY TYPE, 2018-2032 (USD THOUSAND)
TABLE 13 NORTH AMERICA MEDICAL RESEARCH IN CHINESE HAMSTER OVARY (CHO) CELLS MARKET, BY REGION, 2018-2032 (USD THOUSAND)
TABLE 14 NORTH AMERICA CHINESE HAMSTER OVARY CELLS CHO MARKET, BY END USER, 2018-2032 (USD THOUSAND)
TABLE 15 NORTH AMERICA BIOPHARMACEUTICAL COMPANIES IN CHINESE HAMSTER OVARY (CHO) CELLS MARKET, BY REGION, 2018-2032 (USD THOUSAND)
TABLE 16 NORTH AMERICA BIOPHARMACEUTICAL COMPANIES IN CHINESE HAMSTER OVARY (CHO) CELLS MARKET, BY TYPE, 2018-2032 (USD THOUSAND)
TABLE 17 NORTH AMERICA CLINICAL DEVELOPMENT AND MANUFACTURING ORGANIZATIONS IN CHINESE HAMSTER OVARY (CHO) CELLS MARKET, BY REGION, 2018-2032 (USD THOUSAND)
TABLE 18 NORTH AMERICA CLINICAL DEVELOPMENT AND MANUFACTURING ORGANIZATIONS IN CHINESE HAMSTER OVARY (CHO) CELLS MARKET, BY TYPE, 2018-2032 (USD THOUSAND)
TABLE 19 NORTH AMERICA BIOTECHNOLOGY COMPANIES IN CHINESE HAMSTER OVARY (CHO) CELLS MARKET, BY REGION, 2018-2032 (USD THOUSAND)
TABLE 20 NORTH AMERICA BIOTECHNOLOGY COMPANIES IN CHINESE HAMSTER OVARY (CHO) CELLS MARKET, BY TYPE, 2018-2032 (USD THOUSAND)
TABLE 21 NORTH AMERICA ACADEMIC INSTITUTES AND RESEARCH ORGANIZATIONS IN CHINESE HAMSTER OVARY (CHO) CELLS MARKET, BY REGION, 2018-2032 (USD THOUSAND)
TABLE 22 NORTH AMERICA CLINICAL RESEARCH ORGANIZATIONS IN CHINESE HAMSTER OVARY (CHO) CELLS MARKET, BY REGION, 2018-2032 (USD THOUSAND)
TABLE 23 NORTH AMERICA CLINICAL RESEARCH ORGANIZATIONS IN CHINESE HAMSTER OVARY (CHO) CELLS MARKET, BY TYPE, 2018-2032 (USD THOUSAND)
TABLE 24 NORTH AMERICA OTHERS IN CHINESE HAMSTER OVARY (CHO) CELLS MARKET, BY REGION, 2018-2032 (USD THOUSAND)
TABLE 25 NORTH AMERICA CHINESE HAMSTER OVARY (CHO) CELLS MARKET, BY DISTRIBUTION CHANNEL, 2018-2032 (USD THOUSAND)
TABLE 26 NORTH AMERICA DIRECT TENDERS IN CHINESE HAMSTER OVARY (CHO) CELLS MARKET, BY REGION, 2018-2032 (USD THOUSAND)
TABLE 27 NORTH AMERICA RETAIL SALES IN CHINESE HAMSTER OVARY (CHO) CELLS MARKET, BY REGION, 2018-2032 (USD THOUSAND)
TABLE 28 NORTH AMERICA OTHERS IN CHINESE HAMSTER OVARY (CHO) CELLS MARKET, BY REGION, 2018-2032 (USD THOUSAND)
TABLE 29 NORTH AMERICA CHINESE HAMSTER OVARY (CHO) CELLS MARKET, BY COUNTRY, 2018-2032 (USD THOUSAND)
TABLE 30 NORTH AMERICA CHINESE HAMSTER OVARY (CHO) CELLS MARKET, BY TYPE, 2018-2032 (USD THOUSAND)
TABLE 31 NORTH AMERICA PRODUCT IN CHINESE HAMSTER OVARY (CHO) CELLS MARKET, BY TYPE, 2018-2032 (USD THOUSAND)
TABLE 32 NORTH AMERICA CHO-K1 IN CHINESE HAMSTER OVARY (CHO) CELLS MARKET, BY TYPE, 2018-2032 (USD THOUSAND)
TABLE 33 NORTH AMERICA CHINESE HAMSTER OVARY (CHO) CELLS MARKET, BY SYSTEM, 2018-2032 (USD THOUSAND)
TABLE 34 NORTH AMERICA CHINESE HAMSTER OVARY (CHO) CELLS MARKET, BY APPLICATION, 2018-2032 (USD THOUSAND)
TABLE 35 NORTH AMERICA BIOLOGICS IN CHINESE HAMSTER OVARY (CHO) CELLS MARKET, BY TYPE, 2018-2032 (USD THOUSAND)
TABLE 36 NORTH AMERICA CHINESE HAMSTER OVARY (CHO) CELLS MARKET, BY END USER, 2018-2032 (USD THOUSAND)
TABLE 37 NORTH AMERICA BIOPHARMACEUTICAL COMPANIES IN CHINESE HAMSTER OVARY (CHO) CELLS MARKET, BY TYPE, 2018-2032 (USD THOUSAND)
TABLE 38 NORTH AMERICA CLINICAL DEVELOPMENT AND MANUFACTURING ORGANIZATIONS IN CHINESE HAMSTER OVARY (CHO) CELLS MARKET, BY TYPE, 2018-2032 (USD THOUSAND)
TABLE 39 NORTH AMERICA BIOTECHNOLOGY COMPANIES IN CHINESE HAMSTER OVARY (CHO) CELLS MARKET, BY TYPE, 2018-2032 (USD THOUSAND)
TABLE 40 NORTH AMERICA CLINICAL RESEARCH ORGANIZATIONS IN CHINESE HAMSTER OVARY (CHO) CELLS MARKET, BY TYPE, 2018-2032 (USD THOUSAND)
TABLE 41 NORTH AMERICA CHINESE HAMSTER OVARY (CHO) CELLS MARKET, BY DISTRIBUTION CHANNEL, 2018-2032 (USD THOUSAND)
TABLE 42 U.S. CHINESE HAMSTER OVARY (CHO) CELLS MARKET, BY TYPE, 2018-2032 (USD THOUSAND)
TABLE 43 U.S. PRODUCT IN CHINESE HAMSTER OVARY (CHO) CELLS MARKET, BY TYPE, 2018-2032 (USD THOUSAND)
TABLE 44 U.S. CHO-K1 IN CHINESE HAMSTER OVARY (CHO) CELLS MARKET, BY TYPE, 2018-2032 (USD THOUSAND)
TABLE 45 U.S. CHINESE HAMSTER OVARY (CHO) CELLS MARKET, BY SYSTEM, 2018-2032 (USD THOUSAND)
TABLE 46 U.S. CHINESE HAMSTER OVARY (CHO) CELLS MARKET, BY APPLICATION, 2018-2032 (USD THOUSAND)
TABLE 47 U.S. BIOLOGICS IN CHINESE HAMSTER OVARY (CHO) CELLS MARKET, BY TYPE, 2018-2032 (USD THOUSAND)
TABLE 48 U.S. CHINESE HAMSTER OVARY (CHO) CELLS MARKET, BY END USER, 2018-2032 (USD THOUSAND)
TABLE 49 U.S. BIOPHARMACEUTICAL COMPANIES IN CHINESE HAMSTER OVARY (CHO) CELLS MARKET, BY TYPE, 2018-2032 (USD THOUSAND)
TABLE 50 U.S. CLINICAL DEVELOPMENT AND MANUFACTURING ORGANIZATIONS IN CHINESE HAMSTER OVARY (CHO) CELLS MARKET, BY TYPE, 2018-2032 (USD THOUSAND)
TABLE 51 U.S. BIOTECHNOLOGY COMPANIES IN CHINESE HAMSTER OVARY (CHO) CELLS MARKET, BY TYPE, 2018-2032 (USD THOUSAND)
TABLE 52 U.S. CLINICAL RESEARCH ORGANIZATIONS IN CHINESE HAMSTER OVARY (CHO) CELLS MARKET, BY TYPE, 2018-2032 (USD THOUSAND)
TABLE 53 U.S. CHINESE HAMSTER OVARY (CHO) CELLS MARKET, BY DISTRIBUTION CHANNEL, 2018-2032 (USD THOUSAND)
TABLE 54 CANADA CHINESE HAMSTER OVARY (CHO) CELLS MARKET, BY TYPE, 2018-2032 (USD THOUSAND)
TABLE 55 CANADA PRODUCT IN CHINESE HAMSTER OVARY (CHO) CELLS MARKET, BY TYPE, 2018-2032 (USD THOUSAND)
TABLE 56 CANADA CHO-K1 IN CHINESE HAMSTER OVARY (CHO) CELLS MARKET, BY TYPE, 2018-2032 (USD THOUSAND)
TABLE 57 CANADA CHINESE HAMSTER OVARY (CHO) CELLS MARKET, BY SYSTEM, 2018-2032 (USD THOUSAND)
TABLE 58 CANADA CHINESE HAMSTER OVARY (CHO) CELLS MARKET, BY APPLICATION, 2018-2032 (USD THOUSAND)
TABLE 59 CANADA BIOLOGICS IN CHINESE HAMSTER OVARY (CHO) CELLS MARKET, BY TYPE, 2018-2032 (USD THOUSAND)
TABLE 60 CANADA CHINESE HAMSTER OVARY (CHO) CELLS MARKET, BY END USER, 2018-2032 (USD THOUSAND)
TABLE 61 CANADA BIOPHARMACEUTICAL COMPANIES IN CHINESE HAMSTER OVARY (CHO) CELLS MARKET, BY TYPE, 2018-2032 (USD THOUSAND)
TABLE 62 CANADA CLINICAL DEVELOPMENT AND MANUFACTURING ORGANIZATIONS IN CHINESE HAMSTER OVARY (CHO) CELLS MARKET, BY TYPE, 2018-2032 (USD THOUSAND)
TABLE 63 CANADA BIOTECHNOLOGY COMPANIES IN CHINESE HAMSTER OVARY (CHO) CELLS MARKET, BY TYPE, 2018-2032 (USD THOUSAND)
TABLE 64 CANADA CLINICAL RESEARCH ORGANIZATIONS IN CHINESE HAMSTER OVARY (CHO) CELLS MARKET, BY TYPE, 2018-2032 (USD THOUSAND)
TABLE 65 CANADA CHINESE HAMSTER OVARY (CHO) CELLS MARKET, BY DISTRIBUTION CHANNEL, 2018-2032 (USD THOUSAND)
TABLE 66 MEXICO CHINESE HAMSTER OVARY (CHO) CELLS MARKET, BY TYPE, 2018-2032 (USD THOUSAND)
TABLE 67 MEXICO PRODUCT IN CHINESE HAMSTER OVARY (CHO) CELLS MARKET, BY TYPE, 2018-2032 (USD THOUSAND)
TABLE 68 MEXICO CHO-K1 IN CHINESE HAMSTER OVARY (CHO) CELLS MARKET, BY TYPE, 2018-2032 (USD THOUSAND)
TABLE 69 MEXICO CHINESE HAMSTER OVARY (CHO) CELLS MARKET, BY SYSTEM, 2018-2032 (USD THOUSAND)
TABLE 70 MEXICO CHINESE HAMSTER OVARY (CHO) CELLS MARKET, BY APPLICATION, 2018-2032 (USD THOUSAND)
TABLE 71 MEXICO BIOLOGICS IN CHINESE HAMSTER OVARY (CHO) CELLS MARKET, BY TYPE, 2018-2032 (USD THOUSAND)
TABLE 72 MEXICO CHINESE HAMSTER OVARY (CHO) CELLS MARKET, BY END USER, 2018-2032 (USD THOUSAND)
TABLE 73 MEXICO BIOPHARMACEUTICAL COMPANIES IN CHINESE HAMSTER OVARY (CHO) CELLS MARKET, BY TYPE, 2018-2032 (USD THOUSAND)
TABLE 74 MEXICO CLINICAL DEVELOPMENT AND MANUFACTURING ORGANIZATIONS IN CHINESE HAMSTER OVARY (CHO) CELLS MARKET, BY TYPE, 2018-2032 (USD THOUSAND)
TABLE 75 MEXICO BIOTECHNOLOGY COMPANIES IN CHINESE HAMSTER OVARY (CHO) CELLS MARKET, BY TYPE, 2018-2032 (USD THOUSAND)
TABLE 76 MEXICO CLINICAL RESEARCH ORGANIZATIONS IN CHINESE HAMSTER OVARY (CHO) CELLS MARKET, BY TYPE, 2018-2032 (USD THOUSAND)
TABLE 77 MEXICO CHINESE HAMSTER OVARY (CHO) CELLS MARKET, BY DISTRIBUTION CHANNEL, 2018-2032 (USD THOUSAND)
List of Figure
FIGURE 1 NORTH AMERICA CHINESE HAMSTER OVARY (CHO) CELLS MARKET: SEGMENTATION
FIGURE 2 NORTH AMERICA CHINESE HAMSTER OVARY (CHO) CELLS MARKET: DATA TRIANGULATION
FIGURE 3 NORTH AMERICA CHINESE HAMSTER OVARY (CHO) CELLS MARKET: DROC ANALYSIS
FIGURE 4 NORTH AMERICA CHINESE HAMSTER OVARY (CHO) CELLS MARKET: NORTH AMERICA VS REGIONAL MARKET ANALYSIS
FIGURE 5 NORTH AMERICA CHINESE HAMSTER OVARY (CHO) CELLS MARKET: COMPANY RESEARCH ANALYSIS
FIGURE 6 NORTH AMERICA CHINESE HAMSTER OVARY (CHO) CELLS MARKET: INTERVIEW DEMOGRAPHICS
FIGURE 7 NORTH AMERICA CHINESE HAMSTER OVARY (CHO) CELLS MARKET: DBMR MARKET POSITION GRID
FIGURE 8 NORTH AMERICA CHINESE HAMSTER OVARY (CHO) CELLS MARKET: MARKET APPLICATION COVERAGE GRID
FIGURE 9 NORTH AMERICA CHINESE HAMSTER OVARY (CHO) CELLS MARKET: VENDOR SHARE ANALYSIS
FIGURE 10 EXECUTIVE SUMMARY: NORTH AMERICA CHINESE HAMSTER OVARY CELLS CHO MARKET
FIGURE 11 NORTH AMERICA CHINESE HAMSTER OVARY (CHO) CELLS MARKET: SEGMENTATION
FIGURE 12 STRATEGIC DECISIONS
FIGURE 13 TWO SEGMENTS COMPRISE THE NORTH AMERICA CHINESE HAMSTER OVARY CELLS CHO MARKET, BY TYPE
FIGURE 14 RISING DEMAND FOR BIOLOGICS AND THERAPEUTIC PROTEINS EXPECTED TO DRIVE THE NORTH AMERICA CHINESE HAMSTER OVARY (CHO) CELLS MARKET GROWTH IN THE FORECAST PERIOD OF 2025 TO 2032
FIGURE 15 TYPE SEGMENT IS EXPECTED TO ACCOUNT FOR THE LARGEST SHARE OF THE NORTH AMERICA CHINESE HAMSTER OVARY (CHO) CELLS MARKET IN THE FORECAST PERIOD OF 2025 & 2032
FIGURE 16 NUMBER OF PATENTS PER COUNTRY OR REGION
FIGURE 17 NUMBER OF PATENTS PER APPLICANTS
FIGURE 18 NUMBER OF PATENTS PER YEAR.
FIGURE 19 DROC ANALYSIS
FIGURE 20 NORTH AMERICA CHINESE HAMSTER OVARY (CHO) CELLS MARKET: BY TYPE, 2024
FIGURE 21 NORTH AMERICA CHINESE HAMSTER OVARY (CHO) CELLS MARKET: BY TYPE, 2025 TO 2032 (USD THOUSAND)
FIGURE 22 NORTH AMERICA CHINESE HAMSTER OVARY (CHO) CELLS MARKET: BY TYPE, CAGR (2025- 2032)
FIGURE 23 NORTH AMERICA CHINESE HAMSTER OVARY (CHO) CELLS MARKET: BY TYPE, LIFELINE CURVE
FIGURE 24 NORTH AMERICA CHINESE HAMSTER OVARY (CHO) CELLS MARKET: BY SYSTEM, 2024
FIGURE 25 NORTH AMERICA CHINESE HAMSTER OVARY (CHO) CELLS MARKET: BY SYSTEM, 2025 TO 2032 (USD THOUSAND)
FIGURE 26 NORTH AMERICA CHINESE HAMSTER OVARY (CHO) CELLS MARKET: BY SYSTEM, CAGR (2025- 2032)
FIGURE 27 NORTH AMERICA CHINESE HAMSTER OVARY (CHO) CELLS MARKET: BY SYSTEM, LIFELINE CURVE
FIGURE 28 NORTH AMERICA CHINESE HAMSTER OVARY (CHO) CELLS MARKET: BY APPLICATION, 2024
FIGURE 29 NORTH AMERICA CHINESE HAMSTER OVARY (CHO) CELLS MARKET: BY APPLICATION, 2025 TO 2032 (USD THOUSAND)
FIGURE 30 NORTH AMERICA CHINESE HAMSTER OVARY (CHO) CELLS MARKET: BY APPLICATION, CAGR (2025- 2032)
FIGURE 31 NORTH AMERICA CHINESE HAMSTER OVARY (CHO) CELLS MARKET: BY APPLICATION, LIFELINE CURVE
FIGURE 32 NORTH AMERICA CHINESE HAMSTER OVARY (CHO) CELLS MARKET: BY END USER, 2024
FIGURE 33 NORTH AMERICA CHINESE HAMSTER OVARY (CHO) CELLS MARKET: BY END USER, 2025 TO 2032 (USD THOUSAND)
FIGURE 34 NORTH AMERICA CHINESE HAMSTER OVARY (CHO) CELLS MARKET: BY END USER, CAGR (2025- 2032)
FIGURE 35 NORTH AMERICA CHINESE HAMSTER OVARY (CHO) CELLS MARKET: BY END USER, LIFELINE CURVE
FIGURE 36 NORTH AMERICA CHINESE HAMSTER OVARY (CHO) CELLS MARKET: BY DISTRIBUTION CHANNEL, 2024
FIGURE 37 NORTH AMERICA CHINESE HAMSTER OVARY (CHO) CELLS MARKET: BY DISTRIBUTION CHANNEL, 2025 TO 2032 (USD THOUSAND)
FIGURE 38 NORTH AMERICA CHINESE HAMSTER OVARY (CHO) CELLS MARKET: BY DISTRIBUTION CHANNEL, CAGR (2025- 2032)
FIGURE 39 NORTH AMERICA CHINESE HAMSTER OVARY (CHO) CELLS MARKET: BY DISTRIBUTION CHANNEL, LIFELINE CURVE
FIGURE 40 NORTH AMERICA CHINESE HAMSTER OVARY (CHO) CELLS MARKET: SNAPSHOT (2022)
FIGURE 41 NORTH AMERICA CHINESE HAMSTER OVARY (CHO) CELLS MARKET: COMPANY SHARE 2024 (%)
Data collection and base year analysis are done using data collection modules with large sample sizes. The stage includes obtaining market information or related data through various sources and strategies. It includes examining and planning all the data acquired from the past in advance. It likewise envelops the examination of information inconsistencies seen across different information sources. The market data is analysed and estimated using market statistical and coherent models. Also, market share analysis and key trend analysis are the major success factors in the market report. To know more, please request an analyst call or drop down your inquiry.
The key research methodology used by DBMR research team is data triangulation which involves data mining, analysis of the impact of data variables on the market and primary (industry expert) validation. Data models include Vendor Positioning Grid, Market Time Line Analysis, Market Overview and Guide, Company Positioning Grid, Patent Analysis, Pricing Analysis, Company Market Share Analysis, Standards of Measurement, Global versus Regional and Vendor Share Analysis. To know more about the research methodology, drop in an inquiry to speak to our industry experts.
Data Bridge Market Research is a leader in advanced formative research. We take pride in servicing our existing and new customers with data and analysis that match and suits their goal. The report can be customized to include price trend analysis of target brands understanding the market for additional countries (ask for the list of countries), clinical trial results data, literature review, refurbished market and product base analysis. Market analysis of target competitors can be analyzed from technology-based analysis to market portfolio strategies. We can add as many competitors that you require data about in the format and data style you are looking for. Our team of analysts can also provide you data in crude raw excel files pivot tables (Fact book) or can assist you in creating presentations from the data sets available in the report.


