
North America Commercial Jar Blender Market
Market Size in USD Million
CAGR :
% 
 USD
61.98 Million
USD
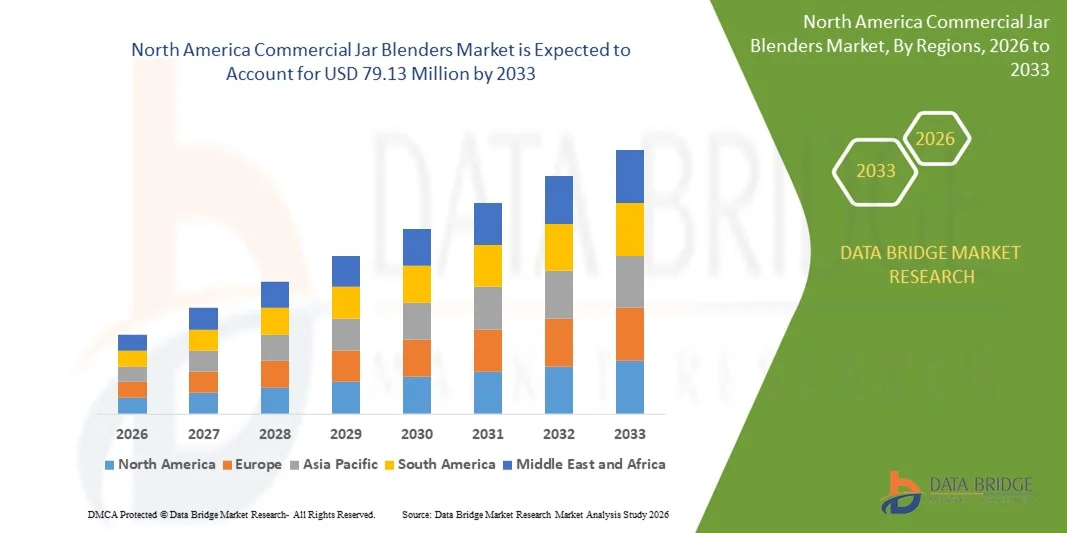
79.13 Million
2025
2033
USD
61.98 Million
USD
79.13 Million
2025
2033
| 2026 - 2033 | |
| USD 61.98 Million | |
| USD 79.13 Million | |
| % | |
|
What is the North America Commercial Jar Blenders Market Size and Growth Rate?
- The North America commercial jar blenders market size was valued at USD 61.98 million in 2025 and is expected to reach USD 79.13 million by 2033, at a CAGR of 3.10% during the forecast period
- The factors driving the growth of the market are increasing demand for commercial jar blenders with sound enclosures, rising preference towards the consumption of fruit based drinks, increasing adoption to latest technologies in jar blenders, rising number of dealers and electronic stores
What are the Major Takeaways of Commercial Jar Blenders Market?
- Due to the ease and safety, it provides users, immersion blenders have gained significant popularity among both working and non-working populations
- The emergence of hand blenders coincides with a movement in customer choice favoring natural products, which is expected to boost blender sales in the not-too-distant future
- The U.S. dominated the North America commercial jar blenders market with an estimated 36.7% revenue share in 2025, driven by rapid growth in cafés, restaurants, juice bars, and foodservice chains
- In Mexico, the market is expected to register the fastest CAGR of 6.8% from 2026 to 2033, driven by the rising café culture, growth of smoothie and juice chains, and increasing demand for blended beverages in restaurants and foodservice establishments
- The Plastic Jar segment dominated the market with an estimated 39.2% share in 2025, driven by affordability, lightweight design, impact resistance, and ease of cleaning, making it ideal for high-volume foodservice and commercial beverage preparation
Report Scope and Commercial Jar Blenders Market Segmentation
|
Attributes |
Commercial Jar Blenders Key Market Insights |
|
Segments Covered |
|
|
Countries Covered |
North America
|
|
Key Market Players |
|
|
Market Opportunities |
|
|
Value Added Data Infosets |
In addition to the insights on market scenarios such as market value, growth rate, segmentation, geographical coverage, and major players, the market reports curated by the Data Bridge Market Research also include in-depth expert analysis, pricing analysis, brand share analysis, consumer survey, demography analysis, supply chain analysis, value chain analysis, raw material/consumables overview, vendor selection criteria, PESTLE Analysis, Porter Analysis, and regulatory framework. |
What is the Key Trend in the Commercial Jar Blenders Market?
Rising Shift Toward High-Performance, Energy-Efficient, and Multi-Function Commercial Jar Blenders
- The commercial jar blenders market is witnessing strong adoption of high-powered, durable, and versatile blenders designed for professional kitchens, cafés, smoothie bars, and foodservice operations
- Manufacturers are expanding portfolios with application-specific blenders, including high-torque motors, variable speed controls, pre-programmed settings, and noise-reduction technologies tailored for commercial use.
- Growing demand for efficiency, consistency, and multifunctionality is driving adoption across restaurants, juice bars, hotels, and catering businesses.
- For instance, companies such as Vitamix, Blendtec, Hamilton Beach, Waring, and NutriBullet are investing in robust jar designs, smart sensors, and programmable interfaces to enhance blending performance.
- Rising focus on on-demand preparation, customizable textures, and easy cleanup is accelerating demand for high-quality commercial blenders.
- As foodservice operators increasingly value durability, speed, and versatility, Commercial Jar Blenders will remain critical for professional culinary and beverage operations.
What are the Key Drivers of Commercial Jar Blenders Market?
- Increasing demand for high-efficiency, versatile, and durable blenders in restaurants, cafés, juice bars, and catering services globally
- For instance, during 2024–2025, leading players such as Vitamix, Blendtec, Hamilton Beach, Waring, and NutriBullet upgraded product lines with higher motor power, larger jar capacities, and smart blending programs
- Rising adoption of smoothie, juice, and health-focused food trends across the U.S., Europe, and North America is boosting commercial blender consumption
- Advancements in motor efficiency, noise reduction, jar material durability, and digital interface controls enhance performance, speed, and reliability
- Growing demand for consistent product texture, multi-use functionality, and fast preparation supports long-term market growth
- Supported by increasing number of cafés, health-oriented eateries, and commercial kitchens, the Commercial Jar Blenders market is expected to witness strong global growth
Which Factor is Challenging the Growth of the Commercial Jar Blenders Market?
- High upfront costs for premium commercial blenders, robust jars, and advanced electronic controls limit adoption among small businesses
- For instance, during 2024–2025, fluctuations in component prices, motor costs, and import tariffs affected product pricing for several global brands
- Intense competition from low-cost, entry-level blenders and personal home-use models creates pricing pressure and reduces differentiation
- Limited awareness among small eateries and home-based businesses regarding professional-grade blender benefits slows market penetration.
- Maintenance requirements, replacement parts, and energy consumption can pose operational challenges for some users
- To address these issues, companies are focusing on energy-efficient motors, durable jar materials, modular components, after-sales support, and value-added smart features to expand global adoption of commercial jar blenders
How is the Commercial Jar Blenders Market Segmented?
The market is segmented on the basis of product type, type, application, control type, mode of operation, end user, and distribution channel.
- By Product Type
On the basis of product type, the commercial jar blenders market is segmented into Plastic Jar, Metal Jar, Glass Jar, and Others. The Plastic Jar segment dominated the market with an estimated 39.2% share in 2025, driven by affordability, lightweight design, impact resistance, and ease of cleaning, making it ideal for high-volume foodservice and commercial beverage preparation. Plastic jars are widely adopted in cafés, juice bars, and fast-food chains due to durability, low cost, and compatibility with high-speed blending operations.
The Glass Jar segment is expected to grow at the fastest CAGR from 2026 to 2033, supported by rising demand for premium-quality, chemical-free, and aesthetically appealing blenders. Glass jars offer superior heat resistance, transparency, and odor-free blending, making them preferred for health-conscious businesses and establishments seeking professional-grade equipment for smoothies, soups, and sauces.
- By Type
On the basis of blender type, the market is segmented into Heavy Duty Blenders, Medium Duty Blenders, and Light Duty Blenders. The Heavy Duty segment dominated the market with a 41.8% share in 2025, fueled by demand in high-volume commercial kitchens, smoothie bars, and food processing units where continuous operation, powerful motors, and extended durability are critical. Heavy-duty blenders ensure consistent texture, speed, and reliability for professional chefs and operators handling dense ingredients.
The Medium Duty segment is expected to grow at the fastest CAGR from 2026 to 2033, driven by adoption among small to medium cafés, juice bars, and boutique restaurants. Medium-duty models strike a balance between affordability, power, and versatility, supporting rising demand in urban centers and small-scale foodservice operations seeking reliable performance without industrial-level specifications.
- By Application
On the basis of application, the commercial jar blenders market is segmented primarily into Food and Beverages. The Food & Beverage segment dominated the market with an estimated 88.5% share in 2025, driven by extensive use in cafés, juice bars, restaurants, and catering services. Blenders are critical for smoothies, soups, sauces, nut butters, and beverage preparation, ensuring consistency, speed, and hygiene. Increasing popularity of health drinks, protein shakes, and on-demand beverage preparation continues to fuel adoption.
The segment is projected to maintain strong growth, supported by rising consumer demand for fresh, customized, and visually appealing food and beverage offerings. Specialized recipes, high-speed blending, and versatility across ingredients reinforce commercial blenders as indispensable tools in the global foodservice and hospitality industry.
- By Control Type
On the basis of control type, the market is segmented into Electronic Control, Toggle Control, and Others. The Electronic Control segment dominated the market with a 53.4% share in 2025, owing to precise speed regulation, pre-programmed blending cycles, and user-friendly digital interfaces. Electronic controls allow commercial operators to achieve consistent results, reduce human error, and integrate automated workflows in busy kitchens.
The Toggle Control segment is expected to grow at the fastest CAGR from 2026 to 2033, supported by simplicity, low maintenance, and reliability in small cafés and fast-food outlets. Toggle control blenders are cost-effective, durable, and preferred by establishments requiring straightforward operations without extensive electronic components.
- By Mode of Operation
On the basis of operation mode, the market is segmented into Automatic and Manual blenders. The Automatic segment dominated the market with a 61.1% share in 2025, driven by programmable settings, timer-based blending, and optimized speed control that reduce operator effort in high-volume environments. Automatic blenders enhance efficiency, consistency, and safety, especially in foodservice chains and commercial kitchens.
The Manual segment is expected to grow at the fastest CAGR from 2026 to 2033, supported by demand in small eateries, home-based businesses, and experimental kitchens where hands-on control over blending speed, duration, and texture is preferred.
- By End User
On the basis of end-user, the market is segmented into Food Processing Establishments, Food Service Establishments, and Others. The Food Service Establishments segment dominated with a 48.7% share in 2025, fueled by high adoption in cafés, restaurants, hotels, and catering businesses requiring reliable, high-speed blending for diverse menu items. Blenders are integral for consistent quality, operational efficiency, and quick preparation of beverages and sauces.
The Food Processing Establishments segment is projected to grow at the fastest CAGR from 2026 to 2033, supported by increasing use of blenders in industrial kitchens, packaged food production, and ready-to-drink beverage manufacturing where large volumes, consistency, and durability are critical.
- By Distribution Channel
On the basis of distribution channel, the market is segmented into Store-Based and Non-Store-Based channels. The Store-Based segment dominated the market with a 51.3% share in 2025, driven by commercial appliance retailers, kitchenware stores, and specialty equipment outlets providing direct access, installation support, and after-sales services.
The Non-Store-Based segment is expected to grow at the fastest CAGR from 2026 to 2033, supported by online marketplaces, e-commerce platforms, and direct-to-business sales channels. Convenience, competitive pricing, detailed product information, and doorstep delivery are driving adoption among small businesses, cafés, and startups globally.
Which Region Holds the Largest Share of the Commercial Jar Blenders Market?
- The U.S. dominated the North America commercial jar blenders market with an estimated 36.7% revenue share in 2025, driven by rapid growth in cafés, restaurants, juice bars, and foodservice chains
- Rising consumer preference for smoothies, protein shakes, and on-demand beverages, combined with investments in modern commercial kitchens and advanced appliance technology, supports widespread adoption
- Strong distribution networks, e-commerce penetration, and a mature hospitality infrastructure further reinforce the U.S.’s leadership in the regional market
Canada Commercial Jar Blenders Market Insight
In Canada, the market is witnessing steady growth, supported by expanding urban foodservice establishments, specialty cafés, and high-end restaurants. Blenders with heavy-duty motors, durable jars, and electronic controls are increasingly preferred for cafés, hotels, and catering services. Focus on hygiene, efficiency, and automated operation drives adoption, while investments in retail distribution, appliance import networks, and foodservice modernization enhance long-term market expansion.
Mexico Commercial Jar Blenders Market Insight
In Mexico, the market is expected to register the fastest CAGR of 6.8% from 2026 to 2033, driven by the rising café culture, growth of smoothie and juice chains, and increasing demand for blended beverages in restaurants and foodservice establishments. Adoption of mid- to heavy-duty blenders with multiple speed options, large-capacity jars, and electronic controls is rising. Expansion of retail distribution channels, online appliance sales, and growing awareness of health-focused beverages further accelerates market penetration.
Which are the Top Companies in Commercial Jar Blenders Market?
The commercial jar blenders industry is primarily led by well-established companies, including:
- Newell Brands Inc. (U.S.)
- Whirlpool Corp. (U.S.)
- Vita-Mix Corp (U.S.)
- Spectrum Brands, Inc. (U.S.)
- Blendtec Inc. (U.S.)
- Hamilton Beach Brands (U.S.)
- Zhongshan CRANDDI Electrical Appliance Co., Ltd (China)
- Ceado Srl (Italy)
- Foshan Canmax Electric Appliances Co (China)
- Waring (U.S.)
- Sammic S.L. (Spain)
- NutriBullet, LLC (U.S.)
- HANS APPLIANCES (India)
- Bianco di puro GmbH & Co. KG (Germany)
What are the Recent Developments in Global Commercial Jar Blenders Market?
- In February 2025, the European Union approved updated regulations on food processing equipment, including commercial jar blenders, mandating stricter safety and hygiene standards (European Commission Press Release). This regulatory change prompted manufacturers to upgrade their products, creating opportunities for innovation and improved compliance across the commercial blender market
- In May 2024, Hamilton Beach Brands Holding Corporation completed the acquisition of Silverson Machines, a prominent manufacturer of industrial mixing equipment, including commercial jar blenders (SEC Filing). This acquisition allowed Hamilton Beach to diversify its revenue streams, expand its product portfolio, and strengthen its presence in industrial and commercial markets
- In March 2024, Waring Commercial and Blendtec formed a strategic partnership to co-brand and distribute select Blendtec models under the Waring name (Bloomberg). This collaboration leveraged both companies’ strengths, expanded market reach, and enhanced their combined product offerings for commercial customers
- In January 2024, Bosch Appliance Corporation launched its new commercial-grade jar blender, the PowerMaster Pro, featuring a 3-horsepower motor and 12-liter capacity (Reuters). This product launch expanded Bosch’s commercial blender lineup, catering to larger businesses and industrial applications, and reinforced its position in the professional blending market
SKU-
Get online access to the report on the World's First Market Intelligence Cloud

- Interactive Data Analysis Dashboard
- Company Analysis Dashboard for high growth potential opportunities
- Research Analyst Access for customization & queries
- Competitor Analysis with Interactive dashboard
- Latest News, Updates & Trend analysis
- Harness the Power of Benchmark Analysis for Comprehensive Competitor Tracking
North America Commercial Jar Blender Market, Supply Chain Analysis and Ecosystem Framework
To support market growth and help clients navigate the impact of geopolitical shifts, DBMR has integrated in-depth supply chain analysis into its North America Commercial Jar Blender Market research reports. This addition empowers clients to respond effectively to global changes affecting their industries. The supply chain analysis section includes detailed insights such as North America Commercial Jar Blender Market consumption and production by country, price trend analysis, the impact of tariffs and geopolitical developments, and import and export trends by country and HSN code. It also highlights major suppliers with data on production capacity and company profiles, as well as key importers and exporters. In addition to research, DBMR offers specialized supply chain consulting services backed by over a decade of experience, providing solutions like supplier discovery, supplier risk assessment, price trend analysis, impact evaluation of inflation and trade route changes, and comprehensive market trend analysis.
Research Methodology
Data collection and base year analysis are done using data collection modules with large sample sizes. The stage includes obtaining market information or related data through various sources and strategies. It includes examining and planning all the data acquired from the past in advance. It likewise envelops the examination of information inconsistencies seen across different information sources. The market data is analysed and estimated using market statistical and coherent models. Also, market share analysis and key trend analysis are the major success factors in the market report. To know more, please request an analyst call or drop down your inquiry.
The key research methodology used by DBMR research team is data triangulation which involves data mining, analysis of the impact of data variables on the market and primary (industry expert) validation. Data models include Vendor Positioning Grid, Market Time Line Analysis, Market Overview and Guide, Company Positioning Grid, Patent Analysis, Pricing Analysis, Company Market Share Analysis, Standards of Measurement, Global versus Regional and Vendor Share Analysis. To know more about the research methodology, drop in an inquiry to speak to our industry experts.
Customization Available
Data Bridge Market Research is a leader in advanced formative research. We take pride in servicing our existing and new customers with data and analysis that match and suits their goal. The report can be customized to include price trend analysis of target brands understanding the market for additional countries (ask for the list of countries), clinical trial results data, literature review, refurbished market and product base analysis. Market analysis of target competitors can be analyzed from technology-based analysis to market portfolio strategies. We can add as many competitors that you require data about in the format and data style you are looking for. Our team of analysts can also provide you data in crude raw excel files pivot tables (Fact book) or can assist you in creating presentations from the data sets available in the report.


