
North America Compression Garments Stockings Market
Market Size in USD Billion
 USD
1.15 Billion
USD
1.70 Billion
2024
2032
USD
1.15 Billion
USD
1.70 Billion
2024
2032
| 2025 - 2032 | |
| USD 1.15 Billion | |
| USD 1.70 Billion | |
| % | |
|
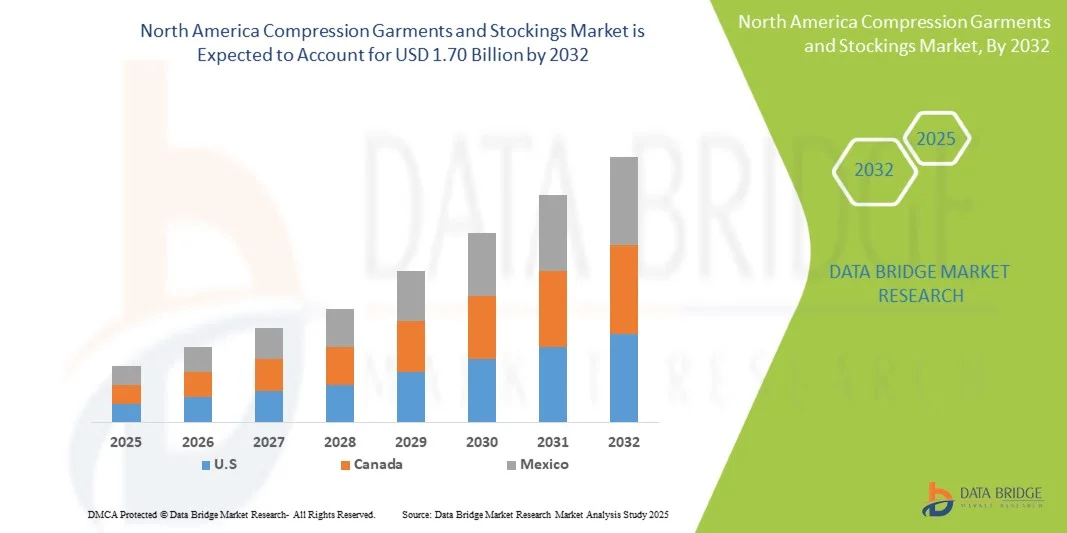
North America Compression Garments and Stockings Market Size
- The North America Compression Garments and Stockings Market size was valued at USD 1.15 billion in 2024 and is expected to reach USD 1.70 billion by 2032, at a CAGR of 5.13% during the forecast period
- The market growth is largely fueled by increasing awareness regarding venous disorders and the rising adoption of preventive healthcare solutions.
- Furthermore, the growing geriatric population, increasing incidence of varicose veins, and expanding use of compression stockings in post-surgical recovery are further driving demand.
North America Compression Garments and Stockings Market Analysis
- The market is driven by increasing cases of venous disorders, lymphedema, and diabetes-related swelling. Compression wear is becoming a preferred solution for managing chronic symptoms and improving patient comfort, especially among aging populations.
- Usage in post-operative recovery and sports recovery is boosting demand. Athletes and fitness enthusiasts increasingly adopt compression wear for enhanced circulation, reduced muscle fatigue, and faster healing, contributing to strong market traction.
- U.S is expected to be the dominate in the North America Compression Garments and Stockings Market with the largest market share of 78.61 in 2025, fueled by increasing healthcare spending, growing aging population, rising awareness of compression therapy benefits, and expanding access to medical-grade garments across developing countries
- The compression stockings segment is expected to dominate the North America Compression Garments and Stockings Market with a market share of 70.22% in 2025, driven by rising cases of varicose veins, deep vein thrombosis (DVT), and chronic venous insufficiency, along with growing physician recommendations and hospital usage
Report Scope and North America Compression Garments and Stockings Market Segmentation
|
Attributes |
North America Compression garments and stockings Key Market Insights |
|
Segments Covered |
|
|
Countries Covered |
North America
|
|
Key Market Players |
|
|
Market Opportunities |
|
|
Value Added Data Infosets |
In addition to the insights on market scenarios such as market value, growth rate, segmentation, geographical coverage, and major players, the market reports curated by the Data Bridge Market Research also include in-depth expert analysis, pricing analysis, brand share analysis, consumer survey, demography analysis, supply chain analysis, value chain analysis, raw material/consumables overview, vendor selection criteria, PESTLE Analysis, Porter Analysis, and regulatory framework. |
North America Compression Garments and Stockings Market Trends
“Increasing Obesity and Sedentary Lifestyles”
- The rising prevalence of obesity and sedentary lifestyles has led to increased usage of compression garments and stockings across various population groups. Prolonged sitting, lack of physical activity, and growing rates of metabolic disorders have contributed to a surge in vascular conditions such as varicose veins, deep vein thrombosis (DVT), and chronic venous insufficiency. In response, compression therapy is being adopted as a non-invasive, preventive, and therapeutic approach to support circulatory health and alleviate swelling and discomfort in the lower limbs.
- Healthcare providers are recommending compression wear not only for at-risk individuals but also for the general population as part of preventive wellness routines. Urbanization, desk-bound work cultures, and aging demographics particularly in developed markets are further contributing to wider adoption.
- As awareness of circulatory health risks increases, compression wear continues to gain traction in both medical and lifestyle applications, supporting sustained market growth.
- The rising prevalence of obesity and sedentary behavior continues to contribute significantly to vascular health issues worldwide. As these lifestyle trends persist, the need for effective, non-invasive solutions like compression garments grows stronger.
- Increasing awareness among healthcare providers and consumers is expanding the use of compression therapy beyond clinical settings into everyday wellness routines. This evolving landscape underscores the sustained potential for market growth driven by health-conscious and at-risk population.
North America Compression Garments and Stockings Market Dynamics
Driver
“Rising Use of Compression Wear in Sports Recovery”
- The growing focus on athletic performance and faster recovery has led to increased adoption of compression garments among professional athletes and fitness enthusiasts. Compression wear is recognized for its benefits in enhancing blood circulation, reducing muscle fatigue, minimizing swelling, and accelerating recovery post-exercise. Sports medicine specialists and physiotherapists frequently recommend compression stockings and sleeves to support muscle endurance and prevent injuries during both training and competition.
- Advancements in textile technology have enabled the production of lightweight, breathable, and ergonomically designed compression apparel that caters specifically to athletes’ needs. Additionally, rising participation in recreational sports and fitness activities Europely alongside increasing awareness of injury prevention has expanded the market beyond elite athletes to the general population. This trend is further supported by endorsements from sports professionals and growing availability through e-commerce platforms, driving widespread consumer acceptance of compression wear as an essential component of sports recovery.
- The increasing adoption of compression garments in sports recovery reflects growing recognition of their benefits in reducing muscle fatigue, soreness, and inflammation after physical activity. Both athletes and fitness enthusiasts are leveraging these products to enhance recovery times and improve training outcomes.
Restraint/Challenge
“Shortage of Trained Personnel for Proper Fitting”
- Proper fitting of compression garments and stockings is critical to ensure therapeutic effectiveness and patient comfort. However, a significant shortage of trained healthcare professionals skilled in measuring, fitting, and educating patients poses a major challenge in the Europe market. Incorrect sizing or improper application can lead to insufficient compression, skin irritation, or even worsened medical conditions, reducing user compliance and treatment outcomes.
- This shortage is especially acute in low-resource and rural healthcare settings, where access to specialized personnel like vascular nurses or certified fitters is limited. Additionally, limited awareness and training among general practitioners and caregivers further exacerbate the problem, hindering optimal prescription and use. As compression therapy increasingly moves into home and outpatient care, the lack of proper fitting guidance remains a critical barrier to widespread and effective adoption.
- According to the World Health Organization (WHO), there is a projected Europe shortage of 11 million health workers by 2030, particularly affecting low- and lower-middle-income countries. This shortage includes healthcare professionals trained in the proper fitting of medical devices like compression garments. The lack of skilled personnel limits effective compression therapy delivery, leading to improper fitting, reduced treatment benefits, and lower patient compliance
- In December 2021, according to a study published National Library of Medecine, an educational nursing intervention significantly improved patient adherence to compression therapy and reduced the recurrence rate of venous leg ulcers. The structured program involved nurse-led training on proper stocking use, skin care, and self-monitoring techniques. Patients receiving this educational support demonstrated higher compliance with wearing compression stockings and experienced fewer ulcer recurrences compared to those who did not receive the intervention
- The effectiveness of compression therapy heavily depends on accurate fitting and patient education, both of which require trained personnel. However, a Europe shortage of specialized healthcare workers, particularly in low-resource settings, continues to hinder proper usage and compliance. This limitation not only compromises therapeutic outcomes but also contributes to patient dissatisfaction and treatment discontinuation, posing a significant barrier to market expansion.
North America Compression Garments and Stockings Market Scope
The North America Compression Garments and Stockings Market is categorized into seven notable segments which are on the basis of product type, compression level, application, material, gender, distribution channel, and end user.
- By Product Type
On the basis of product type, the market is segmented into compression stockings and compression garments. In 2025, the compression stockings segment is expected to dominate the market with a market share of 70.22%, driven by increasing prevalence of chronic venous disorders, rising post-surgical usage, and strong physician recommendations for preventive and therapeutic compression therapy.
The compression stockings segment is anticipated to witness the fastest growth rate of 5.84% from 2025 to 2032, fueled by growing awareness of vein health, expanding aging population, and increasing adoption across both medical and non-medical applications, including sports recovery and occupational wellness.
- Compression Level
On the basis of application, the market is segmented into moderate compression, mild compression, firm compression, and extra-firm compression. In 2025, the moderate compression segment accounted for the largest revenue share of 36.05%, primarily due to the growing prevalence of venous disorders, increasing adoption in post-operative rehabilitation, and its effectiveness in managing chronic conditions such as lymphedema, deep vein thrombosis (DVT), and varicose veins. Moderate compression is also widely preferred by physicians as it balances therapeutic efficacy with patient comfort, making it the most prescribed and commonly used compression level across both preventive and therapeutic applications.
- By Application
On the basis of application, the market is segmented into medical use and non-medical use. The medical use segment held the largest market 60.98% share in 2025, driven by rising incidence of venous disorders, post-surgical recovery needs, and increased clinical adoption of compression therapy for chronic conditions such as lymphedema, DVT, and varicose veins.
The medical use segment is expected to witness the fastest CAGR from 2025 to 2032, driven by increasing demand for compression wear in sports performance, fitness recovery, occupational wellness, and lifestyle-related preventive care.
- By Material
On the basis of material, the market is segmented into nylon and spandex, cotton, microfiber, bamboo fiber, breathable mesh / moisture-wicking fabrics, wool blends, and recycled/organic materials. The nylon and spandex segment held the largest market 31.45% share in 2025, driven by its superior elasticity, durability, and ability to provide consistent compression pressure essential for medical and athletic applications.
The nylon and spandex segment is expected to witness the fastest CAGR from 2025 to 2032, favored for its lightweight nature, excellent stretchability, moisture-wicking capabilities, and enhanced wearer comfort across prolonged usage in both medical and non-medical settings.
- By Gender
On the basis of gender, the market is segmented into women, unisex, and men. The women segment accounted for the largest market 41.84% share in 2025, driven by higher prevalence of varicose veins, pregnancy-related venous issues, and greater adoption of compression wear for both medical and aesthetic purposes.
The women segment is expected to witness the fastest CAGR from 2025 to 2032, driven by rising health awareness, increased participation in fitness activities, and growing demand for stylish, comfortable compression solutions tailored to female users.
- By Distribution Channel
On the basis of distribution channel, the market is segmented into offline and online. The offline segment accounted for the largest market 59.02% share in 2025, driven by strong presence of medical supply stores, pharmacies, and hospital procurement channels offering professional fitting support and immediate product availability.
The offline segment is expected to witness the fastest CAGR from 2025 to 2032, propelled by increasing e-commerce penetration, growing consumer preference for doorstep delivery, availability of a wide product range, and rising digital health awareness.
- By End User
On the basis of end user, the market is segmented into general consumers, healthcare institutions, sports teams and clubs, and corporate wellness programs. The general consumers segment accounted for the largest market 41.30% share in 2025, driven by increasing self-care awareness, rising demand for preventive health solutions, and widespread use of compression wear for everyday comfort and support.
The general consumers segment is expected to witness the fastest CAGR from 2025 to 2032, propelled by growing adoption of compression wear for enhanced athletic performance, muscle recovery, and injury prevention across both amateur and professional athletes.
North America Compression Garments and Stockings Market Regional Analysis
- U.S. dominates the North America Compression Garments and Stockings Market with the largest 78.61% share and is projected to grow at the fastest CAGR of 5.27% in 2025, driven by increasing prevalence of venous disorders, high awareness of compression therapy, and strong demand from both medical and athletic segments
- The country’s rich healthcare infrastructure, favorable reimbursement policies, and rising geriatric population further support market expansion. Additionally, growing fitness trends and preventive wellness awareness contribute to non-medical demand
- U.S. accounted for a substantial share of the North America Compression Garments and Stockings Market in 2025, supported by strong awareness campaigns, preventive healthcare initiatives, and easy access to high-quality compression products through both offline and online distribution channels
Canada North America Compression Garments and Stockings Market Insight
The Canada North America Compression Garments and Stockings Market is witnessing steady growth, driven by the rising prevalence of chronic venous disorders such as varicose veins and deep vein thrombosis (DVT), an aging population, and increased awareness of the benefits of compression therapy. The market benefits from advancements in manufacturing technologies that enhance comfort and effectiveness, as well as growing adoption through retail, online platforms, and healthcare providers. Both male and female consumers across age groups are contributing to growth, with younger demographics increasingly using compression wear for wellness and lifestyle purposes. Looking ahead, the market is expected to expand further due to technological innovations, rising health consciousness, and a shift toward preventive care, making compression garments an essential component of medical, fitness, and everyday wellness solutions in Canada.
North America Compression Garments and Stockings Market Share
The compression garments and stockings industry is primarily led by well-established companies, including:
- 3M (U.S.)
- Cardinal Health (U.S.)
- Sockwell (U.S.)
- Tynor Orthotics Pvt. Ltd. (India)
- Gibaud (France)
- Scholl’s Wellness Co. (U.S.)
- ThermoTek (U.S.)
- Ames Walker (U.S.)
- VIM and VIGR (U.S.)
- Rejuva Health (U.S.)
- Zensah (U.S.)
Latest Developments in North America Compression Garments and Stockings Market
- In January2024 Cardinal Health announced the construction of a new 340,000-square-foot distribution center in Fort Worth, Texas, to support its at-Home Solutions business. The facility will integrate advanced robotics and AI-powered warehouse systems to boost order fulfillment efficiency and safety. It will replace two existing warehouses, expand inventory capacity, and process around 10,000 packages daily. The center is expected to be fully operational by Summer 2025.
- In August2024 Cardinal Health announced plans to open a new 249,000 sq. ft. medical product distribution center in Walton Hills, Ohio, as part of its strategy to expand U.S. warehouse capacity and modernize operations. The facility, set to be operational by spring 2025, will replace the smaller Solon location and incorporate advanced automation and technology to enhance supply chain efficiency and employee safety.
- In November 2024Cardinal Health launched the Kendall SCD SmartFlow Compression System in the U.S., marking the next generation of its Kendall Compression Series. This advanced system features Vascular Refill Detection (VRD) and Patient Sensing technologies, delivering personalized intermittent pneumatic compression to improve blood flow, prevent VTE, and reduce venous stasis symptoms such as pain and swelling. The system aims to enhance both clinical outcomes and caregiver efficiency. An international launch is expected in early 2025.
- In November, 2024Sanyleg announced its participation in ISPO Munich 2024, where it will showcase its Made in Italy graduated compression sports socks. The company also released its first sustainability report, highlighting its commitment to ethical manufacturing, environmental responsibility, and employee well-being.
- In May 2024, Sockwell was featured in Parents.com's list of “The 8 Best Compression Socks for Pregnancy,” alongside top-rated brands like Bombas, Comrad, and Levsox. The article highlighted Sockwell’s expert-recommended design for its comfort, 15–20 mmHg compression, and effectiveness in reducing swelling and easing pregnancy-related discomfort.
SKU-

- Interactive Data Analysis Dashboard
- Company Analysis Dashboard for high growth potential opportunities
- Research Analyst Access for customization & queries
- Competitor Analysis with Interactive dashboard
- Latest News, Updates & Trend analysis
- Harness the Power of Benchmark Analysis for Comprehensive Competitor Tracking
Table of Content
1 INTRODUCTION
1.1 OBJECTIVES OF THE STUDY
1.2 MARKET DEFINITION
1.3 OVERVIEW OF THE NORTH AMERICA COMPRESSION GARMENTS AND STOCKINGS MARKET
1.4 CURRENCY AND PRICING
1.5 LIMITATIONS
1.6 MARKETS COVERED
2 MARKET SEGMENTATION
2.1 MARKETS COVERED
2.2 GEOGRAPHICAL SCOPE
2.3 YEARS CONSIDERED FOR THE STUDY
2.4 DBMR TRIPOD DATA VALIDATION MODEL
2.5 PRIMARY INTERVIEWS WITH KEY OPINION LEADERS
2.6 MULTIVARIATE MODELLING
2.7 PRODUCT TYPE LIFELINE CURVE
2.8 MARKET END USER COVERAGE GRID
2.9 DBMR MARKET POSITION GRID
2.1 VENDOR SHARE ANALYSIS
2.11 SECONDARY SOURCES
2.12 ASSUMPTIONS
3 EXECUTIVE SUMMARY
4 PREMIUM INSIGHTS
4.1 IMPORT EXPORT SCENARIO
4.2 PATENT ANALYSIS –
4.2.1 PATENT QUALITY AND STRENGTH
4.2.2 PATENT FAMILIES
4.2.3 LICENSING AND COLLABORATIONS
4.2.4 COMPETITIVE LANDSCAPE
4.2.5 IP STRATEGY AND MANAGEMENT
4.3 VENDOR SELECTION CRITERIA
4.3.1 QUALITY AND CONSISTENCY OF SUPPLY
4.3.2 RELIABILITY AND TIMELINESS
4.3.3 COST COMPETITIVENESS
4.3.4 TECHNICAL CAPABILITY AND INNOVATION
4.3.5 REGULATORY COMPLIANCE AND SUSTAINABILITY
4.3.6 FINANCIAL STABILITY
4.3.7 CUSTOMER SERVICE AND SUPPORT
4.4 BRAND OUTLOOK
4.5 COMPETITIVE BENCHMARKING ACROSS COMPRESSION LEVEL, FABRIC TYPE, AND DISTRIBUTION CHANNEL
4.5.1 COMPRESSION LEVEL BENCHMARKING
4.5.2 FABRIC TYPE BENCHMARKING
4.5.3 DISTRIBUTION CHANNEL BENCHMARKING
4.5.4 COMPETITIVE INSIGHTS
4.6 CONSUMER BUYING BEHAVIOUR
4.6.1 PROBLEM RECOGNITION AND AWARENESS
4.6.2 INFORMATION SEARCH
4.6.3 EVALUATION OF ALTERNATIVES
4.6.4 PURCHASE DECISION
4.6.5 POST-PURCHASE BEHAVIOUR
4.6.6 DEMOGRAPHIC INSIGHTS
4.6.7 CONCLUSION
4.7 COST ANALYSIS BREAKDOWN
4.7.1 RAW MATERIAL COST DYNAMICS
4.7.2 MANUFACTURING AND PROCESSING COSTS
4.7.3 REGULATORY COMPLIANCE AND CERTIFICATION COSTS
4.7.4 PACKAGING AND DISTRIBUTION EXPENSES
4.7.5 R&D AND TECHNOLOGICAL INNOVATION COSTS
4.7.6 MARKET-BASED PRICE BENCHMARKS
4.7.7 GEOGRAPHICAL VARIATIONS IN COST STRUCTURES
4.7.8 IMPACT ON PROFITABILITY AND STRATEGIC IMPLICATIONS
4.7.9 CONCLUSION
4.8 PROFIT MARGIN SCENARIO
4.8.1 INTRODUCTION TO PROFIT MARGINS IN MEDICAL TEXTILES
4.8.2 COST STRUCTURES AND MARGIN INFLUENCERS
4.8.3 PROFITABILITY BY PRODUCT TYPE
4.8.4 GEOGRAPHICAL MARGIN COMPARISON
4.8.5 PRIVATE LABELS VS. BRANDED PRODUCTS
4.8.6 IMPACT OF REGULATIONS ON PROFIT MARGINS
4.8.7 DIGITAL DISTRIBUTION AND DIRECT-TO-CONSUMER (D2C) PROFITABILITY
4.8.8 CONCLUSION
4.9 END USER EVOLUTION ANALYSIS – NORTH AMERICA COMPRESSION GARMENTS AND STOCKINGS MARKET
4.9.1 CONCLUSION
4.1 IMPACT OF SUSTAINABILITY AND CIRCULAR FASHION INITIATIVES ON PRODUCT DEVELOPMENT
4.10.1 RECYCLABLE FIBERS AND ECO-FRIENDLY MATERIALS
4.10.2 CIRCULAR DESIGN AND EXTENDED PRODUCT LIFE
4.10.3 ECO-COMPLIANT INNOVATIONS IN COMPRESSION TECHNOLOGY
4.10.4 MARKET DRIVERS FOR SUSTAINABILITY IN COMPRESSION WEAR
4.10.5 CHALLENGES IN SUSTAINABLE PRODUCT DEVELOPMENT
4.10.6 CONCLUSION
4.11 INNOVATION TRACKER AND STRATEGIC ANALYSIS
4.11.1 MAJOR DEALS AND STRATEGIC ALLIANCES ANALYSIS
4.11.1.1 Joint Ventures
4.11.1.2 Mergers and Acquisitions
4.11.1.3 Licensing and Partnership
4.11.1.4 Technology Collaborations
4.11.1.5 Strategic Divestments
4.11.2 NUMBER OF PRODUCTS IN DEVELOPMENT
4.11.3 STAGE OF DEVELOPMENT
4.11.4 TIMELINES AND MILESTONES
4.11.5 INNOVATION STRATEGIES AND METHODOLOGIES
4.11.6 RISK ASSESSMENT AND MITIGATION
4.11.7 FUTURE OUTLOOK
4.12 RAW MATERIAL COVERAGE
4.12.1 INTRODUCTION
4.12.2 FOUNDATION OF RAW MATERIAL USE
4.12.3 DEPENDENCE ON SYNTHETIC FIBERS
4.12.4 INTEGRATION OF NATURAL FIBERS
4.12.5 ADOPTION OF TECHNICAL AND FUNCTIONAL TEXTILES
4.12.6 SUSTAINABLE MATERIAL INNOVATIONS
4.12.7 REGULATORY AND QUALITY COMPLIANCE
4.12.8 SUPPLY CHAIN CONSIDERATIONS
4.12.9 LIFECYCLE AND PERFORMANCE ATTRIBUTES
4.12.10 CONCLUSION
4.13 VALUE CHAIN
4.13.1 NORTH AMERICA COMPRESSION GARMENTS AND STOCKINGS MARKET VALUE CHAIN
4.13.2 RAW MATERIAL SOURCING & MANUFACTURING:
4.13.3 PRODUCT DESIGN & COMPONENT MANUFACTURING –
4.13.4 ASSEMBLY, BRANDING & PACKAGING
4.13.5 DISTRIBUTION & END-USE
4.14 SUPPLY CHAIN ANALYSIS
4.14.1 RAW MATERIAL SUPPLIERS
4.14.2 TEXTILE MANUFACTURERS
4.14.3 GARMENT & COMPONENT MANUFACTURERS
4.14.4 DESIGN, TESTING & ASSEMBLY UNITS
4.14.5 DISTRIBUTORS & RETAIL CHANNELS
4.14.6 MEDICAL PROFESSIONALS / PRESCRIBERS
4.14.7 END USERS
4.15 PORTER’S FIVE FORCES
4.15.1 INTENSITY OF COMPETITIVE RIVALRY – MODERATE TO HIGH
4.15.2 BARGAINING POWER OF BUYERS/CONSUMERS (MODERATE TO HIGH)
4.15.3 THREAT OF NEW ENTRANTS (LOW TO MODERATE)
4.15.4 THREAT OF SUBSTITUTES PRODUCTS ( LOW TO MODERATE)
4.15.5 BARGAINING POWER OF SUPPLIERS (MODERATE)
4.16 CLIMATE CHANGE SCENARIO
4.16.1 INTRODUCTION
4.16.2 ENVIRONMENTAL CONCERNS
4.16.3 INDUSTRY RESPONSE
4.16.4 GOVERNMENT’S ROLE
4.16.5 ANALYST RECOMMENDATIONS
4.16.6 CONCLUSION
4.17 INDUSTRY ECOSYSTEM ANALYSIS
4.18 INTRODUCTION
4.18.1 PROMINENT COMPANIES
4.18.2 SMALL & MEDIUM SIZE COMPANIES
4.18.3 END USERS
4.18.4 CONCLUSION
4.19 STRATEGIC INITIATIVE ASSESSMENTS (CORPORATE WELLNESS PARTNERSHIPS, RETAIL COLLABORATIONS, OEM/ODM ARRANGEMENTS) ACROSS KEY GEOGRAPHIES
4.19.1 CORPORATE WELLNESS PARTNERSHIPS: INTEGRATING COMPRESSION SOLUTIONS INTO HOLISTIC HEALTH FRAMEWORKS
4.19.2 RETAIL COLLABORATIONS
4.19.3 OEM/ODM ARRANGEMENTS: COST-OPTIMIZED, CUSTOM-BUILT MANUFACTURING PARTNERSHIPS
4.19.4 GEOGRAPHY-SPECIFIC STRATEGIES
4.19.5 STRATEGIC DECISIONS CROSS-FUNCTIONAL NORTH AMERICA STRATEGY: UNIFYING PARTNERSHIPS FOR MARKET SYNERGY
4.19.6 CONCLUSION
4.2 TECHNOLOGICAL ADVANCEMENTS
4.20.1 TECHNOLOGICAL ADVANCEMENTS IN THE NORTH AMERICA COMPRESSION GARMENTS AND STOCKINGS MARKET
4.20.2 SMART COMPRESSION TEXTILES AND WEARABLE SENSORS
4.20.3 3D KNITTING AND SEAMLESS CONSTRUCTION TECHNOLOGIES
4.20.4 ADVANCED AND FUNCTIONAL MATERIALS
4.20.5 AI-POWERED CUSTOMIZATION AND ON-DEMAND MANUFACTURING
4.20.6 INTEGRATION WITH DIGITAL THERAPEUTICS AND TELEHEALTH
4.20.7 SUSTAINABLE AND ECO-FRIENDLY INNOVATIONS
4.20.8 AUTOMATION AND QUALITY CONTROL IN MANUFACTURING
4.20.9 CONCLUSION
4.21 TARIFFS & IMPACT ON THE NORTH AMERICA COMPRESSION GARMENTS AND STOCKINGS MARKET
4.21.1 OVERVIEW
4.21.2 CURRENT TARIFF RATE (S) IN TOP-5 COUNTRY MARKETS
4.21.3 OUTLOOK: LOCAL PRODUCTION VS. IMPORT RELIANCE
4.21.4 VENDOR SELECTION CRITERIA DYNAMICS
4.21.5 IMPACT ON SUPPLY CHAIN
4.21.5.1 Introduction
4.21.5.2 RAW MATERIAL PROCUREMENT
4.21.5.3 Manufacturing and Production
4.21.5.4 Logistics and Distribution
4.21.5.5 Conclusion
4.21.6 INDUSTRY PARTICIPANTS: PROACTIVE MOVES
4.21.6.1 SUPPLY CHAIN OPTIMIZATION
4.21.6.2 JOINT VENTURE ESTABLISHMENTS
4.21.7 IMPACT ON PRICES
4.21.7.1 Influence of Raw Material and Textile Innovations
4.21.7.2 Technological Advancements and Customization
4.21.7.3 Regulatory Compliance and Quality Standards
4.21.7.4 Logistics, Distribution, and Retail Dynamics
4.21.7.5 Sustainability and Ethical Production
4.21.7.6 Economic and North America Trade Factors
4.21.8 REGULATORY INCLINATION
4.21.8.1 Evolving Classification Standards
4.21.8.2 Compliance and Quality Assurance
4.21.8.3 Cross-Border Challenges
4.21.8.4 Digital Integration and Regulation
4.21.8.5 Geopolitical Situation
4.21.8.6 Trade Partnerships Between the Countries
4.21.8.7 Free Trade Agreements
4.21.8.8 Alliances Establishments
4.21.8.9 Conclusion
4.21.9 STATUS ACCREDITATION (INCLUDING MFTN) IN THE NORTH AMERICA COMPRESSION GARMENTS AND STOCKINGS MARKET
4.21.9.1 Medical Accreditation and Regulatory Compliance
4.21.9.2 Voluntary Certifications and Quality Seals
4.21.9.3 Role of MFTN (Medical Functional Textile Network)
4.21.9.4 Accreditation as a Strategic Differentiator
4.21.9.5 Domestic Course of Correction in the North America Compression Garments and Stockings Market
4.21.9.6 Incentive Schemes to Boost Production Outputs
4.21.9.7 Establishment of Special Economic Zones / Industrial Parks
4.21.9.8 Conclusion
4.22 PRICING ANALYSIS
4.23 PRODUCTION CONSUMPTION ANALYSIS
4.24 COMPANY COMPARATIVE ANALYSIS AND POSITIONING MATRICES FOR LIFESTYLE VS. THERAPEUTIC BRANDS
4.24.1 COMPANY COMPARATIVE ANALYSIS: LIFESTYLE VS. THERAPEUTIC FOCUS
4.24.2 POSITIONING MATRIX INSIGHTS:
4.24.2.1 BAUERFEIND AG
4.24.2.2 3M
4.24.2.3 CARDINAL HEALTH
4.24.2.4 THUASNE
4.24.2.5 LOHMANN & RAUSCHER GMBH & CO. KG
5 REGULATION COVERAGE
5.1 INTRODUCTION
5.2 PRODUCT CODES
5.3 CERTIFIED STANDARDS
5.4 SAFETY STANDARDS
5.5 MATERIAL HANDLING AND STORAGE
5.6 TRANSPORT AND PRECAUTIONS
5.7 HAZARD IDENTIFICATION
5.8 CONCLUSION
6 MARKET OVERVIEW
6.1 DRIVERS
6.1.1 INCREASING OBESITY AND SEDENTARY LIFESTYLES
6.1.2 RISING USE OF COMPRESSION WEAR IN SPORTS RECOVERY
6.1.3 ADVANCEMENTS IN TEXTILE TECHNOLOGY AND MATERIALS
6.1.4 GROWTH OF HOME-BASED AND OUTPATIENT CARE SERVICES
6.2 RESTRAINTS
6.2.1 SHORTAGE OF TRAINED PERSONNEL FOR PROPER FITTING
6.2.2 LIMITED CLINICAL BACKING IN NON-THERAPEUTIC USE CASES
6.3 OPPORTUNITIES
6.3.1 DEMAND FOR SUSTAINABLE AND ECO-FRIENDLY COMPRESSION FABRICS
6.3.2 COLLABORATION WITH FASHION AND WELLNESS BRANDS
6.3.3 GROWING SALES FROM E-COMMERCE SECTOR
6.4 CHALLENGES
6.4.1 LOW AWARENESS AND DIAGNOSTIC ACCESS IN RURAL AREAS
6.4.2 COMPLEX REGULATORY CLASSIFICATION ACROSS MARKETS
7 NORTH AMERICA COMPRESSION GARMENTS AND STOCKINGS MARKET, BY PRODUCT TYPE
7.1 OVERVIEW
7.2 COMPRESSION STOCKINGS
7.3 COMPRESSION GARMENTS
8 NORTH AMERICA COMPRESSION GARMENTS AND STOCKINGS MARKET, BY COMPRESSION LEVEL
8.1 OVERVIEW
8.2 MODERATE COMPRESSION
8.3 MILD COMPRESSION
8.4 FIRM COMPRESSION
8.5 EXTRA-FIRM COMPRESSION
9 NORTH AMERICA COMPRESSION GARMENTS AND STOCKINGS MARKET, BY APPLICATION
9.1 OVERVIEW
9.2 MEDICAL USE
9.3 NON-MEDICAL USE
10 NORTH AMERICA COMPRESSION GARMENTS AND STOCKINGS MARKET, BY MATERIAL
10.1 OVERVIEW
10.2 NYLON & SPANDEX
10.3 COTTON
10.4 MICROFIBER
10.5 BAMBOO FIBER
10.6 BREATHABLE MESH / MOISTURE-WICKING FABRICS
10.7 WOOL BLENDS
10.8 RECYCLED/ORGANIC MATERIALS
11 NORTH AMERICA COMPRESSION GARMENTS AND STOCKINGS MARKET, BY GENDER
11.1 OVERVIEW
11.2 WOMEN
11.3 UNISEX
11.4 MEN
12 NORTH AMERICA COMPRESSION GARMENTS AND STOCKINGS MARKET, BY DISTRIBUTION CHANNEL
12.1 OVERVIEW
12.2 OFFLINE
12.3 ONLINE
13 NORTH AMERICA COMPRESSION GARMENTS AND STOCKINGS MARKET, BY END USER
13.1 OVERVIEW
13.2 GENERAL CONSUMERS
13.3 HEALTHCARE INSTITUTIONS
13.4 SPORTS TEAMS & CLUBS
13.5 CORPORATE WELLNESS PROGRAMS
14 NORTH AMERICA COMPRESSION GARMENTS AND STOCKINGS MARKET, BY REGION
14.1 OVERVIEW
14.2 NORTH AMERICA
14.2.1 U.S.
14.2.2 CANADA
14.2.3 MEXICO
15 NORTH AMERICA COMPRESSION GARMENTS AND STOCKINGS MARKET: COMPANY LANDSCAPE
15.1 COMPANY SHARE ANALYSIS: GLOBAL
16 SWOT ANALYSIS
16.1 SWOT ANALYSIS FOR KEY SEGMENTS BY PRODUCT TYPE
17 DISTRIBUTOR COMPANY PROFILES
17.1 NOVOMED INC PVT. LTD.
17.1.1 COMPANY SNAPSHOT
17.1.2 PRODUCT PORTFOLIO
17.1.3 RECENT DEVELOPMENTS/NEWS
17.2 TS COMPROZONE PVT. LTD.
17.2.1 COMPANY SNAPSHOT
17.2.2 PRODUCT PORTFOLIO
17.2.3 RECENT DEVELOPMENTS/NEWS
17.3 SIMONSEN & WEEL
17.3.1 COMPANY SNAPSHOT
17.3.2 PRODUCT PORTFOLIO
17.3.3 RECENT DEVELOPMENTS/NEWS
17.4 YASHODHAN ENTERPRISE
17.4.1 COMPANY SNAPSHOT
17.4.2 PRODUCT PORTFOLIO
17.4.3 RECENT DEVELOPMENTS/NEWS
17.5 YOGI KRIPA
17.5.1 COMPANY SNAPSHOT
17.5.2 PRODUCT PORTFOLIO
17.5.3 RECENT DEVELOPMENTS/NEWS
18 MANUFACTURERS, COMPANY PROFILE
18.1 BAUERFEIND
18.1.1 COMPANY SNAPSHOT
18.1.2 COMPANY SHARE ANALYSIS
18.1.3 SWOT ANALYSIS
18.1.4 PRODUCT PORTFOLIO
18.1.5 RECENT DEVELOPMENT
18.2 3M
18.2.1 COMPANY SNAPSHOT
18.2.2 REVENUE ANALYSIS
18.2.3 COMPANY SHARE ANALYSIS
18.2.4 SWOT ANALYSIS
18.2.5 PRODUCT PORTFOLIO
18.2.6 RECENT DEVELOPMENTS/NEWS
18.3 CARDINAL HEALTH
18.3.1 COMPANY SNAPSHOT
18.3.2 REVENUE ANALYSIS
18.3.3 COMPANY SHARE ANALYSIS
18.3.4 SWOT ANALYSIS
18.3.5 PRODUCT PORTFOLIO
18.3.6 RECENT DEVELOPMENT
18.4 THUSANE
18.4.1 COMPANY SNAPSHOT
18.4.2 COMPANY SHARE ANALYSIS
18.4.3 SWOT ANALYSIS
18.4.4 PRODUCT PORTFOLIO
18.4.5 RECENT DEVELOPMENT
18.5 LOHMANN & RAUSCHER GMBH & CO. KG
18.5.1 COMPANY SNAPSHOT
18.5.2 COMPANY SHARE ANALYSIS
18.5.3 SWOT ANALYSIS
18.5.4 PRODUCT PORTFOLIO
18.5.5 RECENT DEVELOPMENT
18.6 AMES WALKER
18.6.1 COMPANY SNAPSHOT
18.6.2 PRODUCT PORTFOLIO
18.6.3 RECENT DEVELOPMENTS/NEWS
18.7 CALZIFICIO ZETA SRL
18.7.1 COMPANY SNAPSHOT
18.7.2 PRODUCT PORTFOLIO
18.7.3 RECENT DEVELOPMENT
18.8 CEP
18.8.1 COMPANY SNAPSHOT
18.8.2 PRODUCT PORTFOLIO
18.8.3 RECENT DEVELOPMENT
18.9 COMPRESSANA GMBH
18.9.1 COMPANY SNAPSHOT
18.9.2 PRODUCT PORTFOLIO
18.9.3 RECENT DEVELOPMENT
18.1 GIBAUD
18.10.1 COMPANY SNAPSHOT
18.10.2 PRODUCT PORTFOLIO
18.10.3 RECENT DEVELOPMENT
18.11 GLORIA MED S.P.A.
18.11.1 COMPANY SNAPSHOT
18.11.2 PRODUCT PORTFOLIO
18.11.3 RECENT DEVELOPMENT
18.12 HEINZ SCHIEBLER GMBH & CO KG
18.12.1 COMPANY SNAPSHOT
18.12.2 PRODUCT PORTFOLIO
18.12.3 RECENT DEVELOPMENT
18.13 JUZO
18.13.1 COMPANY SNAPSHOT
18.13.2 PRODUCT PORTFOLIO
18.13.3 RECENT DEVELOPMENT
18.14 MAXWELL INDIA
18.14.1 COMPANY SNAPSHOT
18.14.2 PRODUCT PORTFOLIO
18.14.3 RECENT DEVELOPMENT
18.15 MEDI GMBH & CO. KG
18.15.1 COMPANY SNAPSHOT
18.15.2 PRODUCT PORTFOLIO
18.15.3 RECENT DEVELOPMENT
18.16 NOVAMED
18.16.1 COMPANY SNAPSHOT
18.16.2 PRODUCT PORTFOLIO
18.16.3 RECENT DEVELOPMENT
18.17 REJUVA HEALTH
18.17.1 COMPANY SNAPSHOT
18.17.2 PRODUCT PORTFOLIO
18.17.3 RECENT DEVELOPMENT
18.18 SANYLEG SRL A SOCIO UNICO
18.18.1 COMPANY SNAPSHOT
18.18.2 PRODUCT PORTFOLIO
18.18.3 RECENT DEVELOPMENT
18.19 SCHOLL’S WELLNESS
18.19.1 COMPANY SNAPSHOT
18.19.2 PRODUCT PORTFOLIO
18.19.3 RECENT DEVELOPMENT
18.2 SWISSLASTIC AG ST. GALLEN
18.20.1 COMPANY SNAPSHOT
18.20.2 PRODUCT PORTFOLIO
18.20.3 RECENT DEVELOPMENT
18.21 SIGVARIS GROUP
18.21.1 COMPANY SNAPSHOT
18.21.2 PRODUCT PORTFOLIO
18.21.3 RECENT DEVELOPMENT
18.22 SOCKWELL
18.22.1 COMPANY SNAPSHOT
18.22.2 PRODUCT PORTFOLIO
18.22.3 RECENT DEVELOPMENTS/NEWS
18.23 SURGIWEAR
18.23.1 COMPANY SNAPSHOT
18.23.2 PRODUCT PORTFOLIO
18.23.3 RECENT DEVELOPMENT
18.24 THERMOTEK
18.24.1 COMPANY SNAPSHOT
18.24.2 PRODUCT PORTFOLIO
18.24.3 RECENT DEVELOPMENT
18.25 TYNOR ORTHOTICS PVT. LTD.
18.25.1 COMPANY SNAPSHOT
18.25.2 PRODUCT PORTFOLIO
18.25.3 RECENT DEVELOPMENT
18.26 VIM & VIGR
18.26.1 COMPANY SNAPSHOT
18.26.2 PRODUCT PORTFOLIO
18.26.3 RECENT DEVELOPMENTS/NEWS
18.27 VISSCO NEXT
18.27.1 COMPANY SNAPSHOT
18.27.2 PRODUCT PORTFOLIO
18.27.3 RECENT DEVELOPMENTS/NEWS
18.28 ZENSAH
18.28.1 COMPANY SNAPSHOT
18.28.2 PRODUCT PORTFOLIO
18.28.3 RECENT DEVELOPMENT
19 QUESTIONNAIRE
20 RELATED REPORTS
List of Table
TABLE 1 BRAND OUTLOOK: COMPRESSION STOCKINGS MARKET
TABLE 2 NORTH AMERICA COMPRESSION GARMENTS AND STOCKINGS MARKET, BY PRODUCT TYPE, 2018-2032 (USD THOUSAND)
TABLE 3 NORTH AMERICA COMPRESSION STOCKINGS IN COMPRESSION GARMENTS AND STOCKINGS MARKET, BY REGION, 2018-2032 (USD THOUSAND)
TABLE 4 NORTH AMERICA COMPRESSION STOCKINGS IN COMPRESSION GARMENTS AND STOCKINGS MARKET, BY TYPE, 2018-2032 (USD THOUSAND)
TABLE 5 NORTH AMERICA COMPRESSION SOCKS IN COMPRESSION GARMENTS AND STOCKINGS MARKET, BY TYPE, 2018-2032 (USD THOUSAND)
TABLE 6 NORTH AMERICA WORKWEAR COMPRESSION IN COMPRESSION GARMENTS AND STOCKINGS MARKET, BY TYPE, 2018-2032 (USD THOUSAND)
TABLE 7 NORTH AMERICA INDUSTRIAL WORKERS IN COMPRESSION GARMENTS AND STOCKINGS MARKET, BY TYPE, 2018-2032 (USD THOUSAND)
TABLE 8 NORTH AMERICA HOSPITALITY & RETAIL WORKERS IN COMPRESSION GARMENTS AND STOCKINGS MARKET, BY TYPE, 2018-2032 (USD THOUSAND)
TABLE 9 NORTH AMERICA TRANSPORT & LOGISTICS WORKERS IN COMPRESSION GARMENTS AND STOCKINGS MARKET, BY TYPE, 2018-2032 (USD THOUSAND)
TABLE 10 NORTH AMERICA COMPRESSION GARMENTS IN COMPRESSION GARMENTS AND STOCKINGS MARKET, BY REGION, 2018-2032 (USD THOUSAND)
TABLE 11 NORTH AMERICA COMPRESSION GARMENTS IN COMPRESSION GARMENTS AND STOCKINGS MARKET, BY TYPE, 2018-2032 (USD THOUSAND)
TABLE 12 NORTH AMERICA LOWER BODY GARMENTS IN COMPRESSION GARMENTS AND STOCKINGS MARKET, BY TYPE, 2018-2032 (USD THOUSAND)
TABLE 13 NORTH AMERICA COMPRESSION GARMENTS AND STOCKINGS MARKET, BY COMPRESSION LEVEL, 2018-2032 (USD THOUSAND)
TABLE 14 NORTH AMERICA MODERATE COMPRESSION IN COMPRESSION GARMENTS AND STOCKINGS MARKET, BY REGION, 2018-2032 (USD THOUSAND)
TABLE 15 NORTH AMERICA MILD COMPRESSION IN COMPRESSION GARMENTS AND STOCKINGS MARKET, BY REGION, 2018-2032 (USD THOUSAND)
TABLE 16 NORTH AMERICA FIRM COMPRESSION IN COMPRESSION GARMENTS AND STOCKINGS MARKET, BY REGION, 2018-2032 (USD THOUSAND)
TABLE 17 NORTH AMERICA EXTRA-FIRM COMPRESSION IN COMPRESSION GARMENTS AND STOCKINGS MARKET, BY REGION, 2018-2032 (USD THOUSAND)
TABLE 18 NORTH AMERICA COMPRESSION GARMENTS AND STOCKINGS MARKET, BY APPLICATION, 2018-2032 (USD THOUSAND)
TABLE 19 NORTH AMERICA MEDICAL USE IN COMPRESSION GARMENTS AND STOCKINGS MARKET, BY REGION, 2018-2032 (USD THOUSAND)
TABLE 20 NORTH AMERICA MEDICAL USE IN COMPRESSION GARMENTS AND STOCKINGS MARKET, BY TYPE, 2018-2032 (USD THOUSAND)
TABLE 21 NORTH AMERICA NON-MEDICAL USE IN COMPRESSION GARMENTS AND STOCKINGS MARKET, BY REGION, 2018-2032 (USD THOUSAND)
TABLE 22 NORTH AMERICA NON-MEDICAL USE IN COMPRESSION GARMENTS AND STOCKINGS MARKET, BY TYPE, 2018-2032 (USD THOUSAND)
TABLE 23 NORTH AMERICA OCCUPATIONAL USE / WORKWEAR IN COMPRESSION GARMENTS AND STOCKINGS MARKET, BY TYPE, 2018-2032 (USD THOUSAND)
TABLE 24 NORTH AMERICA COMPRESSION GARMENTS AND STOCKINGS MARKET, BY MATERIAL, 2018-2032 (USD THOUSAND)
TABLE 25 NORTH AMERICA NYLON & SPANDEX IN COMPRESSION GARMENTS AND STOCKINGS MARKET, BY REGION, 2018-2032 (USD THOUSAND)
TABLE 26 NORTH AMERICA COTTON IN COMPRESSION GARMENTS AND STOCKINGS MARKET, BY REGION, 2018-2032 (USD THOUSAND)
TABLE 27 NORTH AMERICA MICROFIBER IN COMPRESSION GARMENTS AND STOCKINGS MARKET, BY REGION, 2018-2032 (USD THOUSAND)
TABLE 28 NORTH AMERICA BAMBOO FIBER IN COMPRESSION GARMENTS AND STOCKINGS MARKET, BY REGION, 2018-2032 (USD THOUSAND)
TABLE 29 NORTH AMERICA BREATHABLE MESH / MOISTURE-WICKING FABRICS IN COMPRESSION GARMENTS AND STOCKINGS MARKET, BY REGION, 2018-2032 (USD THOUSAND)
TABLE 30 NORTH AMERICA WOOL BLENDS IN COMPRESSION GARMENTS AND STOCKINGS MARKET, BY REGION, 2018-2032 (USD THOUSAND)
TABLE 31 NORTH AMERICA RECYCLED/ORGANIC MATERIALS IN COMPRESSION GARMENTS AND STOCKINGS MARKET, BY REGION, 2018-2032 (USD THOUSAND)
TABLE 32 NORTH AMERICA COMPRESSION GARMENTS AND STOCKINGS MARKET, BY GENDER, 2018-2032 (USD THOUSAND)
TABLE 33 NORTH AMERICA WOMEN IN COMPRESSION GARMENTS AND STOCKINGS MARKET, BY REGION, 2018-2032 (USD THOUSAND)
TABLE 34 NORTH AMERICA UNISEX IN COMPRESSION GARMENTS AND STOCKINGS MARKET, BY REGION, 2018-2032 (USD THOUSAND)
TABLE 35 NORTH AMERICA MEN IN COMPRESSION GARMENTS AND STOCKINGS MARKET, BY REGION, 2018-2032 (USD THOUSAND)
TABLE 36 NORTH AMERICA COMPRESSION GARMENTS AND STOCKINGS MARKET, BY DISTRIBUTION CHANNEL, 2018-2032 (USD THOUSAND)
TABLE 37 NORTH AMERICA OFFLINE IN COMPRESSION GARMENTS AND STOCKINGS MARKET, BY REGION, 2018-2032 (USD THOUSAND)
TABLE 38 NORTH AMERICA OFFLINE IN COMPRESSION GARMENTS AND STOCKINGS MARKET, BY TYPE, 2018-2032 (USD THOUSAND)
TABLE 39 NORTH AMERICA ONLINE IN COMPRESSION GARMENTS AND STOCKINGS MARKET, BY REGION, 2018-2032 (USD THOUSAND)
TABLE 40 NORTH AMERICA COMPRESSION GARMENTS AND STOCKINGS MARKET, BY END USER, 2018-2032 (USD THOUSAND)
TABLE 41 NORTH AMERICA GENERAL CONSUMERS IN COMPRESSION GARMENTS AND STOCKINGS MARKET, BY REGION, 2018-2032 (USD THOUSAND)
TABLE 42 NORTH AMERICA GENERAL CONSUMERS IN COMPRESSION GARMENTS AND STOCKINGS MARKET, BY TYPE, 2018-2032 (USD THOUSAND)
TABLE 43 NORTH AMERICA WORKERS IN PHYSICALLY DEMANDING JOBS IN COMPRESSION GARMENTS AND STOCKINGS MARKET, BY TYPE, 2018-2032 (USD THOUSAND)
TABLE 44 NORTH AMERICA HEALTHCARE INSTITUTIONS IN COMPRESSION GARMENTS AND STOCKINGS MARKET, BY REGION, 2018-2032 (USD THOUSAND)
TABLE 45 NORTH AMERICA SPORTS TEAMS & CLUBS IN COMPRESSION GARMENTS AND STOCKINGS MARKET, BY REGION, 2018-2032 (USD THOUSAND)
TABLE 46 NORTH AMERICA CORPORATE WELLNESS PROGRAMS IN COMPRESSION GARMENTS AND STOCKINGS MARKET, BY REGION, 2018-2032 (USD THOUSAND)
TABLE 47 NORTH AMERICA COMPRESSION GARMENTS AND STOCKINGS MARKET, BY REGION, 2018-2032 (USD THOUSAND)
TABLE 48 NORTH AMERICA COMPRESSION GARMENTS AND STOCKINGS MARKET, BY COUNTRY, 2018-2032 (USD THOUSAND)
TABLE 49 NORTH AMERICA COMPRESSION GARMENTS AND STOCKINGS MARKET, BY PRODUCT TYPE, 2018-2032 (USD THOUSAND)
TABLE 50 NORTH AMERICA COMPRESSION STOCKINGS IN COMPRESSION GARMENTS AND STOCKINGS MARKET, BY TYPE, 2018-2032 (USD THOUSAND)
TABLE 51 NORTH AMERICA COMPRESSION SOCKS IN COMPRESSION GARMENTS AND STOCKINGS MARKET, BY TYPE, 2018-2032 (USD THOUSAND)
TABLE 52 NORTH AMERICA WORKWEAR COMPRESSION SOCKS IN COMPRESSION GARMENTS AND STOCKINGS MARKET, BY TYPE, 2018-2032 (USD THOUSAND)
TABLE 53 NORTH AMERICA INDUSTRIAL WORKERS IN COMPRESSION GARMENTS AND STOCKINGS MARKET, BY TYPE, 2018-2032 (USD THOUSAND)
TABLE 54 NORTH AMERICA HOSPITALITY & RETAIL WORKERS IN COMPRESSION GARMENTS AND STOCKINGS MARKET, BY TYPE, 2018-2032 (USD THOUSAND)
TABLE 55 NORTH AMERICA TRANSPORT & LOGISTICS WORKERS IN COMPRESSION GARMENTS AND STOCKINGS MARKET, BY TYPE, 2018-2032 (USD THOUSAND)
TABLE 56 NORTH AMERICA COMPRESSION GARMENTS IN COMPRESSION GARMENTS AND STOCKINGS MARKET, BY TYPE, 2018-2032 (USD THOUSAND)
TABLE 57 NORTH AMERICA LOWER BODY GARMENTS IN COMPRESSION GARMENTS AND STOCKINGS MARKET, BY TYPE, 2018-2032 (USD THOUSAND)
TABLE 58 NORTH AMERICA COMPRESSION GARMENTS AND STOCKINGS MARKET, BY COMPRESSION LEVEL, 2018-2032 (USD THOUSAND)
TABLE 59 NORTH AMERICA COMPRESSION GARMENTS AND STOCKINGS MARKET, BY APPLICATION, 2018-2032 (USD THOUSAND)
TABLE 60 NORTH AMERICA MEDICAL USE IN COMPRESSION GARMENTS AND STOCKINGS MARKET, BY TYPE, 2018-2032 (USD THOUSAND)
TABLE 61 NORTH AMERICA NON-MEDICAL USE IN COMPRESSION GARMENTS AND STOCKINGS MARKET, BY TYPE, 2018-2032 (USD THOUSAND)
TABLE 62 NORTH AMERICA OCCUPATIONAL USE / WORKWEAR IN COMPRESSION GARMENTS AND STOCKINGS MARKET, BY TYPE, 2018-2032 (USD THOUSAND)
TABLE 63 NORTH AMERICA COMPRESSION GARMENTS AND STOCKINGS MARKET, BY MATERIAL, 2018-2032 (USD THOUSAND)
TABLE 64 NORTH AMERICA COMPRESSION GARMENTS AND STOCKINGS MARKET, BY GENDER, 2018-2032 (USD THOUSAND)
TABLE 65 NORTH AMERICA COMPRESSION GARMENTS AND STOCKINGS MARKET, BY DISTRIBUTION CHANNEL, 2018-2032 (USD THOUSAND)
TABLE 66 NORTH AMERICA OFFLINE IN COMPRESSION GARMENTS AND STOCKINGS MARKET, BY TYPE, 2018-2032 (USD THOUSAND)
TABLE 67 NORTH AMERICA COMPRESSION GARMENTS AND STOCKINGS MARKET, BY END USER, 2018-2032 (USD THOUSAND)
TABLE 68 NORTH AMERICA GENERAL CONSUMERS IN COMPRESSION GARMENTS AND STOCKINGS MARKET, BY TYPE, 2018-2032 (USD THOUSAND)
TABLE 69 NORTH AMERICA WORKERS IN PHYSICALLY DEMANDING JOBS IN COMPRESSION GARMENTS AND STOCKINGS MARKET, BY TYPE, 2018-2032 (USD THOUSAND)
TABLE 70 U.S. COMPRESSION GARMENTS AND STOCKINGS MARKET, BY PRODUCT TYPE, 2018-2032 (USD THOUSAND)
TABLE 71 U.S. COMPRESSION STOCKINGS IN COMPRESSION GARMENTS AND STOCKINGS MARKET, BY TYPE, 2018-2032 (USD THOUSAND)
TABLE 72 U.S. COMPRESSION SOCKS IN COMPRESSION GARMENTS AND STOCKINGS MARKET, BY TYPE, 2018-2032 (USD THOUSAND)
TABLE 73 U.S. WORKWEAR COMPRESSION SOCKS IN COMPRESSION GARMENTS AND STOCKINGS MARKET, BY TYPE, 2018-2032 (USD THOUSAND)
TABLE 74 U.S. INDUSTRIAL WORKERS IN COMPRESSION GARMENTS AND STOCKINGS MARKET, BY TYPE, 2018-2032 (USD THOUSAND)
TABLE 75 U.S. HOSPITALITY & RETAIL WORKERS IN COMPRESSION GARMENTS AND STOCKINGS MARKET, BY TYPE, 2018-2032 (USD THOUSAND)
TABLE 76 U.S. TRANSPORT & LOGISTICS WORKERS IN COMPRESSION GARMENTS AND STOCKINGS MARKET, BY TYPE, 2018-2032 (USD THOUSAND)
TABLE 77 U.S. COMPRESSION GARMENTS IN COMPRESSION GARMENTS AND STOCKINGS MARKET, BY TYPE, 2018-2032 (USD THOUSAND)
TABLE 78 U.S. LOWER BODY GARMENTS IN COMPRESSION GARMENTS AND STOCKINGS MARKET, BY TYPE, 2018-2032 (USD THOUSAND)
TABLE 79 U.S. COMPRESSION GARMENTS AND STOCKINGS MARKET, BY COMPRESSION LEVEL, 2018-2032 (USD THOUSAND)
TABLE 80 U.S. COMPRESSION GARMENTS AND STOCKINGS MARKET, BY APPLICATION, 2018-2032 (USD THOUSAND)
TABLE 81 U.S. MEDICAL USE IN COMPRESSION GARMENTS AND STOCKINGS MARKET, BY TYPE, 2018-2032 (USD THOUSAND)
TABLE 82 U.S. NON-MEDICAL USE IN COMPRESSION GARMENTS AND STOCKINGS MARKET, BY TYPE, 2018-2032 (USD THOUSAND)
TABLE 83 U.S. OCCUPATIONAL USE / WORKWEAR IN COMPRESSION GARMENTS AND STOCKINGS MARKET, BY TYPE, 2018-2032 (USD THOUSAND)
TABLE 84 U.S. COMPRESSION GARMENTS AND STOCKINGS MARKET, BY MATERIAL, 2018-2032 (USD THOUSAND)
TABLE 85 U.S. COMPRESSION GARMENTS AND STOCKINGS MARKET, BY GENDER, 2018-2032 (USD THOUSAND)
TABLE 86 U.S. COMPRESSION GARMENTS AND STOCKINGS MARKET, BY DISTRIBUTION CHANNEL, 2018-2032 (USD THOUSAND)
TABLE 87 U.S. OFFLINE IN COMPRESSION GARMENTS AND STOCKINGS MARKET, BY TYPE, 2018-2032 (USD THOUSAND)
TABLE 88 U.S. COMPRESSION GARMENTS AND STOCKINGS MARKET, BY END USER, 2018-2032 (USD THOUSAND)
TABLE 89 U.S. GENERAL CONSUMERS IN COMPRESSION GARMENTS AND STOCKINGS MARKET, BY TYPE, 2018-2032 (USD THOUSAND)
TABLE 90 U.S. WORKERS IN PHYSICALLY DEMANDING JOBS IN COMPRESSION GARMENTS AND STOCKINGS MARKET, BY TYPE, 2018-2032 (USD THOUSAND)
TABLE 91 CANADA COMPRESSION GARMENTS AND STOCKINGS MARKET, BY PRODUCT TYPE, 2018-2032 (USD THOUSAND)
TABLE 92 CANADA COMPRESSION STOCKINGS IN COMPRESSION GARMENTS AND STOCKINGS MARKET, BY TYPE, 2018-2032 (USD THOUSAND)
TABLE 93 CANADA COMPRESSION SOCKS IN COMPRESSION GARMENTS AND STOCKINGS MARKET, BY TYPE, 2018-2032 (USD THOUSAND)
TABLE 94 CANADA WORKWEAR COMPRESSION SOCKS IN COMPRESSION GARMENTS AND STOCKINGS MARKET, BY TYPE, 2018-2032 (USD THOUSAND)
TABLE 95 CANADA INDUSTRIAL WORKERS IN COMPRESSION GARMENTS AND STOCKINGS MARKET, BY TYPE, 2018-2032 (USD THOUSAND)
TABLE 96 CANADA HOSPITALITY & RETAIL WORKERS IN COMPRESSION GARMENTS AND STOCKINGS MARKET, BY TYPE, 2018-2032 (USD THOUSAND)
TABLE 97 CANADA TRANSPORT & LOGISTICS WORKERS IN COMPRESSION GARMENTS AND STOCKINGS MARKET, BY TYPE, 2018-2032 (USD THOUSAND)
TABLE 98 CANADA COMPRESSION GARMENTS IN COMPRESSION GARMENTS AND STOCKINGS MARKET, BY TYPE, 2018-2032 (USD THOUSAND)
TABLE 99 CANADA LOWER BODY GARMENTS IN COMPRESSION GARMENTS AND STOCKINGS MARKET, BY TYPE, 2018-2032 (USD THOUSAND)
TABLE 100 CANADA COMPRESSION GARMENTS AND STOCKINGS MARKET, BY COMPRESSION LEVEL, 2018-2032 (USD THOUSAND)
TABLE 101 CANADA COMPRESSION GARMENTS AND STOCKINGS MARKET, BY APPLICATION, 2018-2032 (USD THOUSAND)
TABLE 102 CANADA MEDICAL USE IN COMPRESSION GARMENTS AND STOCKINGS MARKET, BY TYPE, 2018-2032 (USD THOUSAND)
TABLE 103 CANADA NON-MEDICAL USE IN COMPRESSION GARMENTS AND STOCKINGS MARKET, BY TYPE, 2018-2032 (USD THOUSAND)
TABLE 104 CANADA OCCUPATIONAL USE / WORKWEAR IN COMPRESSION GARMENTS AND STOCKINGS MARKET, BY TYPE, 2018-2032 (USD THOUSAND)
TABLE 105 CANADA COMPRESSION GARMENTS AND STOCKINGS MARKET, BY MATERIAL, 2018-2032 (USD THOUSAND)
TABLE 106 CANADA COMPRESSION GARMENTS AND STOCKINGS MARKET, BY GENDER, 2018-2032 (USD THOUSAND)
TABLE 107 CANADA COMPRESSION GARMENTS AND STOCKINGS MARKET, BY DISTRIBUTION CHANNEL, 2018-2032 (USD THOUSAND)
TABLE 108 CANADA OFFLINE IN COMPRESSION GARMENTS AND STOCKINGS MARKET, BY TYPE, 2018-2032 (USD THOUSAND)
TABLE 109 CANADA COMPRESSION GARMENTS AND STOCKINGS MARKET, BY END USER, 2018-2032 (USD THOUSAND)
TABLE 110 CANADA GENERAL CONSUMERS IN COMPRESSION GARMENTS AND STOCKINGS MARKET, BY TYPE, 2018-2032 (USD THOUSAND)
TABLE 111 CANADA WORKERS IN PHYSICALLY DEMANDING JOBS IN COMPRESSION GARMENTS AND STOCKINGS MARKET, BY TYPE, 2018-2032 (USD THOUSAND)
TABLE 112 MEXICO COMPRESSION GARMENTS AND STOCKINGS MARKET, BY PRODUCT TYPE, 2018-2032 (USD THOUSAND)
TABLE 113 MEXICO COMPRESSION STOCKINGS IN COMPRESSION GARMENTS AND STOCKINGS MARKET, BY TYPE, 2018-2032 (USD THOUSAND)
TABLE 114 MEXICO COMPRESSION SOCKS IN COMPRESSION GARMENTS AND STOCKINGS MARKET, BY TYPE, 2018-2032 (USD THOUSAND)
TABLE 115 MEXICO WORKWEAR COMPRESSION SOCKS IN COMPRESSION GARMENTS AND STOCKINGS MARKET, BY TYPE, 2018-2032 (USD THOUSAND)
TABLE 116 MEXICO INDUSTRIAL WORKERS IN COMPRESSION GARMENTS AND STOCKINGS MARKET, BY TYPE, 2018-2032 (USD THOUSAND)
TABLE 117 MEXICO HOSPITALITY & RETAIL WORKERS IN COMPRESSION GARMENTS AND STOCKINGS MARKET, BY TYPE, 2018-2032 (USD THOUSAND)
TABLE 118 MEXICO TRANSPORT & LOGISTICS WORKERS IN COMPRESSION GARMENTS AND STOCKINGS MARKET, BY TYPE, 2018-2032 (USD THOUSAND)
TABLE 119 MEXICO COMPRESSION GARMENTS IN COMPRESSION GARMENTS AND STOCKINGS MARKET, BY TYPE, 2018-2032 (USD THOUSAND)
TABLE 120 MEXICO LOWER BODY GARMENTS IN COMPRESSION GARMENTS AND STOCKINGS MARKET, BY TYPE, 2018-2032 (USD THOUSAND)
TABLE 121 MEXICO COMPRESSION GARMENTS AND STOCKINGS MARKET, BY COMPRESSION LEVEL, 2018-2032 (USD THOUSAND)
TABLE 122 MEXICO COMPRESSION GARMENTS AND STOCKINGS MARKET, BY APPLICATION, 2018-2032 (USD THOUSAND)
TABLE 123 MEXICO MEDICAL USE IN COMPRESSION GARMENTS AND STOCKINGS MARKET, BY TYPE, 2018-2032 (USD THOUSAND)
TABLE 124 MEXICO NON-MEDICAL USE IN COMPRESSION GARMENTS AND STOCKINGS MARKET, BY TYPE, 2018-2032 (USD THOUSAND)
TABLE 125 MEXICO OCCUPATIONAL USE / WORKWEAR IN COMPRESSION GARMENTS AND STOCKINGS MARKET, BY TYPE, 2018-2032 (USD THOUSAND)
TABLE 126 MEXICO COMPRESSION GARMENTS AND STOCKINGS MARKET, BY MATERIAL, 2018-2032 (USD THOUSAND)
TABLE 127 MEXICO COMPRESSION GARMENTS AND STOCKINGS MARKET, BY GENDER, 2018-2032 (USD THOUSAND)
TABLE 128 MEXICO COMPRESSION GARMENTS AND STOCKINGS MARKET, BY DISTRIBUTION CHANNEL, 2018-2032 (USD THOUSAND)
TABLE 129 MEXICO OFFLINE IN COMPRESSION GARMENTS AND STOCKINGS MARKET, BY TYPE, 2018-2032 (USD THOUSAND)
TABLE 130 MEXICO COMPRESSION GARMENTS AND STOCKINGS MARKET, BY END USER, 2018-2032 (USD THOUSAND)
TABLE 131 MEXICO GENERAL CONSUMERS IN COMPRESSION GARMENTS AND STOCKINGS MARKET, BY TYPE, 2018-2032 (USD THOUSAND)
TABLE 132 MEXICO WORKERS IN PHYSICALLY DEMANDING JOBS IN COMPRESSION GARMENTS AND STOCKINGS MARKET, BY TYPE, 2018-2032 (USD THOUSAND)
List of Figure
FIGURE 1 NORTH AMERICA COMPRESSION GARMENTS AND STOCKINGS MARKET: SEGMENTATION
FIGURE 2 NORTH AMERICA COMPRESSION GARMENTS AND STOCKINGS MARKET: DATA TRIANGULATION
FIGURE 3 NORTH AMERICA COMPRESSION GARMENTS AND STOCKINGS MARKET: DROC ANALYSIS
FIGURE 4 NORTH AMERICA COMPRESSION GARMENTS AND STOCKINGS MARKET: NORTH AMERICA VS REGIONAL MARKET ANALYSIS
FIGURE 5 NORTH AMERICA COMPRESSION GARMENTS AND STOCKINGS MARKET: COMPANY RESEARCH ANALYSIS
FIGURE 6 NORTH AMERICA COMPRESSION GARMENTS AND STOCKINGS MARKET: INTERVIEW DEMOGRAPHICS
FIGURE 7 NORTH AMERICA COMPRESSION GARMENTS AND STOCKINGS MARKET: MULTIVARIATE MODELLING
FIGURE 8 NORTH AMERICA COMPRESSION GARMENTS AND STOCKINGS MARKET: PRODUCT TYPE LIFELINE CURVE
FIGURE 9 NORTH AMERICA COMPRESSION GARMENTS AND STOCKINGS MARKET: MARKET END USER COVERAGE GRID
FIGURE 10 NORTH AMERICA COMPRESSION GARMENTS AND STOCKINGS MARKET: DBMR MARKET POSITION GRID
FIGURE 11 NORTH AMERICA COMPRESSION GARMENTS AND STOCKINGS MARKET: VENDOR SHARE ANALYSIS
FIGURE 12 NORTH AMERICA COMPRESSION GARMENTS AND STOCKINGS MARKET: SEGMENTATION
FIGURE 13 NORTH AMERICA COMPRESSION GARMENTS AND STOCKINGS MARKET: EXECUTIVE SUMMARY
FIGURE 14 NORTH AMERICA COMPRESSION GARMENTS AND STOCKINGS MARKET: STRATEGIC DECISIONS
FIGURE 15 TWO SEGMENTS COMPRISE THE NORTH AMERICA COMPRESSION GARMENTS AND STOCKINGS MARKET, BY PRODUCT TYPE (2024)
FIGURE 16 INCREASING OBESITY AND SEDENTARY LIFESTYLES IS EXPECTED TO DRIVE THE GROWTH OF THE NORTH AMERICA COMPRESSION GARMENTS AND STOCKINGS MARKET FROM 2025 TO 2032
FIGURE 17 THE COMPRESSION STOCKINGS SEGMENT IS EXPECTED TO ACCOUNT FOR THE LARGEST SHARE OF THE NORTH AMERICA COMPRESSION GARMENTS AND STOCKINGS MARKET IN 2025 & 2032
FIGURE 18 IMPORT EXPORT SCENARIO (USD THOUSAND)
FIGURE 19 DISTRIBUTION OF PATENTS BY IPC CODE
FIGURE 20 COUNTRY-WISE PATENT COUNT
FIGURE 21 VENDOR SELECTION CRITERIA
FIGURE 22 NORTH AMERICA GARMENT AND COMPRESSIBLE STOCKING MARKET, 2024-2032, AVERAGE SELLING PRICE (USD/KG)
FIGURE 23 PRODUCTION CONSUMPTION ANALYSIS: NORTH AMERICA GARMENTS AND COMPRESSION STOCKINGS MARKET
FIGURE 24 DROC ANALYSIS
FIGURE 25 NORTH AMERICA COMPRESSION GARMENTS AND STOCKINGS MARKET: BY PRODUCT TYPE, 2024
FIGURE 26 NORTH AMERICA COMPRESSION GARMENTS AND STOCKINGS MARKET: BY PRODUCT TYPE, 2025 TO 2032 (USD THOUSAND)
FIGURE 27 NORTH AMERICA COMPRESSION GARMENTS AND STOCKINGS MARKET: BY PRODUCT TYPE, CAGR (2025- 2032)
FIGURE 28 NORTH AMERICA COMPRESSION GARMENTS AND STOCKINGS MARKET: BY PRODUCT TYPE, LIFELINE CURVE
FIGURE 29 NORTH AMERICA COMPRESSION GARMENTS AND STOCKINGS MARKET: BY COMPRESSION LEVEL, 2024
FIGURE 30 NORTH AMERICA COMPRESSION GARMENTS AND STOCKINGS MARKET: BY COMPRESSION LEVEL, 2025 TO 2032 (USD THOUSAND)
FIGURE 31 NORTH AMERICA COMPRESSION GARMENTS AND STOCKINGS MARKET: BY COMPRESSION LEVEL, CAGR (2025- 2032)
FIGURE 32 NORTH AMERICA COMPRESSION GARMENTS AND STOCKINGS MARKET: BY COMPRESSION LEVEL, LIFELINE CURVE
FIGURE 33 NORTH AMERICA COMPRESSION GARMENTS AND STOCKINGS MARKET: BY APPLICATION, 2024
FIGURE 34 NORTH AMERICA COMPRESSION GARMENTS AND STOCKINGS MARKET: BY APPLICATION, 2025 TO 2032 (USD THOUSAND)
FIGURE 35 NORTH AMERICA COMPRESSION GARMENTS AND STOCKINGS MARKET: BY APPLICATION, CAGR (2025- 2032)
FIGURE 36 NORTH AMERICA COMPRESSION GARMENTS AND STOCKINGS MARKET: BY APPLICATION, LIFELINE CURVE
FIGURE 37 NORTH AMERICA COMPRESSION GARMENTS AND STOCKINGS MARKET: BY MATERIAL, 2024
FIGURE 38 NORTH AMERICA COMPRESSION GARMENTS AND STOCKINGS MARKET: BY MATERIAL, 2025 TO 2032 (USD THOUSAND)
FIGURE 39 NORTH AMERICA COMPRESSION GARMENTS AND STOCKINGS MARKET: BY MATERIAL, CAGR (2025- 2032)
FIGURE 40 NORTH AMERICA COMPRESSION GARMENTS AND STOCKINGS MARKET: BY MATERIAL, LIFELINE CURVE
FIGURE 41 NORTH AMERICA COMPRESSION GARMENTS AND STOCKINGS MARKET: BY GENDER, 2024
FIGURE 42 NORTH AMERICA COMPRESSION GARMENTS AND STOCKINGS MARKET: BY GENDER, 2025 TO 2032 (USD THOUSAND)
FIGURE 43 NORTH AMERICA COMPRESSION GARMENTS AND STOCKINGS MARKET: BY GENDER, CAGR (2025- 2032)
FIGURE 44 NORTH AMERICA COMPRESSION GARMENTS AND STOCKINGS MARKET: BY GENDER, LIFELINE CURVE
FIGURE 45 NORTH AMERICA COMPRESSION GARMENTS AND STOCKINGS MARKET: BY DISTRIBUTION CHANNEL, 2024
FIGURE 46 NORTH AMERICA COMPRESSION GARMENTS AND STOCKINGS MARKET: BY DISTRIBUTION CHANNEL, 2025 TO 2032 (USD THOUSAND)
FIGURE 47 NORTH AMERICA COMPRESSION GARMENTS AND STOCKINGS MARKET: BY DISTRIBUTION CHANNEL, CAGR (2025- 2032)
FIGURE 48 NORTH AMERICA COMPRESSION GARMENTS AND STOCKINGS MARKET: BY DISTRIBUTION CHANNEL, LIFELINE CURVE
FIGURE 49 NORTH AMERICA COMPRESSION GARMENTS AND STOCKINGS MARKET: BY END USER, 2024
FIGURE 50 NORTH AMERICA COMPRESSION GARMENTS AND STOCKINGS MARKET: BY END USER, 2025 TO 2032 (USD THOUSAND)
FIGURE 51 NORTH AMERICA COMPRESSION GARMENTS AND STOCKINGS MARKET: BY END USER, CAGR (2025- 2032)
FIGURE 52 NORTH AMERICA COMPRESSION GARMENTS AND STOCKINGS MARKET: BY END USER, LIFELINE CURVE
FIGURE 53 NORTH AMERICA COMPRESSION GARMENTS AND STOCKINGS MARKET: SNAPSHOT (2024)
FIGURE 54 NORTH AMERICA COMPRESSION GARMENTS AND STOCKINGS MARKET: COMPANY SHARE 2024 (%)
Data collection and base year analysis are done using data collection modules with large sample sizes. The stage includes obtaining market information or related data through various sources and strategies. It includes examining and planning all the data acquired from the past in advance. It likewise envelops the examination of information inconsistencies seen across different information sources. The market data is analysed and estimated using market statistical and coherent models. Also, market share analysis and key trend analysis are the major success factors in the market report. To know more, please request an analyst call or drop down your inquiry.
The key research methodology used by DBMR research team is data triangulation which involves data mining, analysis of the impact of data variables on the market and primary (industry expert) validation. Data models include Vendor Positioning Grid, Market Time Line Analysis, Market Overview and Guide, Company Positioning Grid, Patent Analysis, Pricing Analysis, Company Market Share Analysis, Standards of Measurement, Global versus Regional and Vendor Share Analysis. To know more about the research methodology, drop in an inquiry to speak to our industry experts.
Data Bridge Market Research is a leader in advanced formative research. We take pride in servicing our existing and new customers with data and analysis that match and suits their goal. The report can be customized to include price trend analysis of target brands understanding the market for additional countries (ask for the list of countries), clinical trial results data, literature review, refurbished market and product base analysis. Market analysis of target competitors can be analyzed from technology-based analysis to market portfolio strategies. We can add as many competitors that you require data about in the format and data style you are looking for. Our team of analysts can also provide you data in crude raw excel files pivot tables (Fact book) or can assist you in creating presentations from the data sets available in the report.


