
North America Compression Therapy Market
Market Size in USD Million
 USD
125.04 Million
USD
320.54 Million
2024
2032
USD
125.04 Million
USD
320.54 Million
2024
2032
| 2025 - 2032 | |
| USD 125.04 Million | |
| USD 320.54 Million | |
| % | |
|
Compression Therapy Market Size
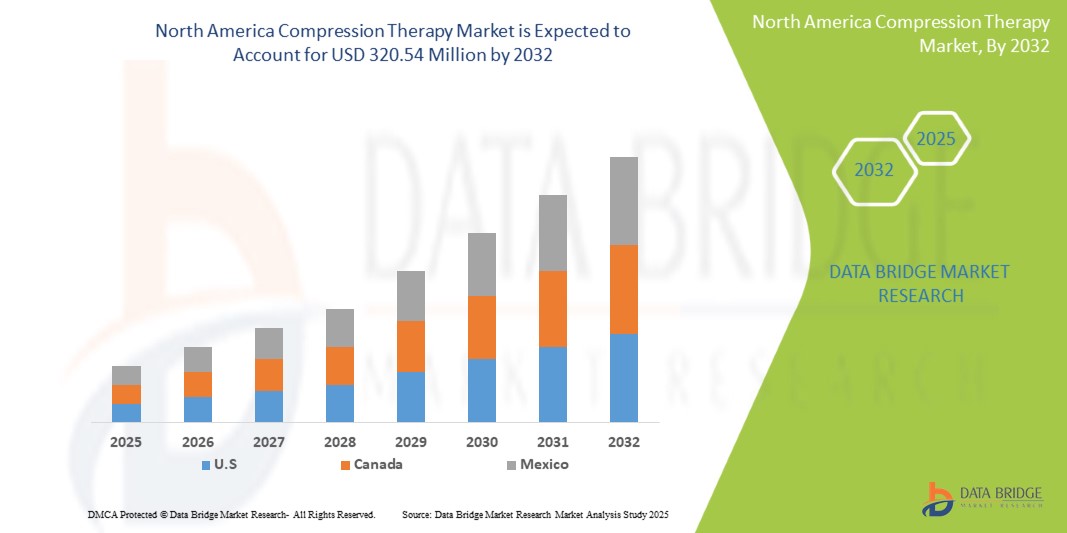
- The North America Compression Therapy Market was valued at USD 125.04 Million in 2024 and is expected to reach USD 320.54 Million by 2032, at a CAGR of 3.8% During the forecast period
- The increasing prevalence of chronic venous disorders, such as chronic venous insufficiency (CVI), varicose veins, and deep vein thrombosis (DVT), which are fueling the demand for effective compression therapy solutions.
North America Compression Therapy Market Analysis
- Compression therapy plays a critical role in the management of various venous and lymphatic conditions, including chronic venous insufficiency (CVI), deep vein thrombosis (DVT), lymphedema, and varicose veins. Compression products—such as bandages, stockings, pneumatic compression devices, and wraps—aid in improving blood circulation, reducing swelling, and preventing the progression of venous disorders. These solutions are widely used across hospitals, rehabilitation centers, home care settings, and specialty clinics.
- The demand for compression therapy in North America is primarily driven by a rising incidence of chronic venous diseases, a growing geriatric population more susceptible to vascular conditions, and increasing awareness about the benefits of early intervention and non-invasive treatment. Additionally, the growing prevalence of obesity and diabetes—both major risk factors for venous insufficiencies—is further fueling market expansion.
- North America is a leading region in the compression therapy market, supported by a well-established healthcare infrastructure, early adoption of advanced medical technologies, and favorable reimbursement policies. The United States holds a dominant share, driven by a large base of vascular disease patients, increasing outpatient procedures, and strong investments in home healthcare and wearable medical devices.
- The U.S. compression therapy market is also shaped by regulatory approvals, including FDA clearances for innovative and user-friendly compression devices. Furthermore, rising healthcare expenditure, growing demand for mobile and portable treatment solutions, and advancements in smart textiles and sensor-based compression garments are enhancing patient compliance and therapeutic outcomes. The market is also witnessing increased uptake of personalized and data-driven therapy approaches, supporting long-term disease management and quality of life improvement.
Report Scope Compression Therapy Market Segmentation
|
Attributes |
Compression Therapy Key Market Insights |
|
Segments Covered |
|
|
Countries Covered |
North America
|
|
Key Market Players |
|
|
Market Opportunities |
|
|
Value Added Data Infosets |
In addition to the insights on market scenarios such as market value, growth rate, segmentation, geographical coverage, and major players, the market reports curated by the Data Bridge Market Research also include import export analysis, production capacity overview, production consumption analysis, price trend analysis, climate change scenario, supply chain analysis, value chain analysis, raw material/consumables overview, vendor selection criteria, PESTLE Analysis, Porter Analysis, and regulatory framework. |
Compression Therapy Market Trends
“Smart Fabrics and Digital Health Integration”
- Advancements in compression therapy technologies—such as smart compression garments, wearable sensors, and digitally controlled pneumatic compression devices—are transforming patient care by enabling real-time monitoring of pressure levels, compliance, and treatment outcomes. These innovations are especially impactful in managing chronic conditions like lymphedema and venous leg ulcers with greater precision and comfort.
- For instance, the U.S. has seen a notable increase in the adoption of intermittent pneumatic compression (IPC) devices and gradient compression garments, bolstered by clinical guidelines recommending their use for DVT prevention in both hospital and at-home care settings
- AI-powered solutions and mobile health apps are increasingly being integrated with compression therapy systems to personalize treatment regimens, track patient adherence, and alert clinicians to early signs of complications. These digital tools are streamlining care coordination, enhancing patient engagement, and driving better long-term outcomes across both clinical and home care settings.
Compression Therapy Market Dynamics
Driver
“Rising Prevalence of Venous Disorders and Technological Advancements in Compression Devices”
- The North America Compression Therapy Market is experiencing significant growth driven by the increasing incidence of chronic venous insufficiency (CVI), varicose veins, lymphedema, and deep vein thrombosis (DVT), particularly among the aging and diabetic populations.
- Technological innovations—such as intermittent pneumatic compression (IPC) devices, gradient compression garments, and smart textiles with integrated sensors—are improving therapeutic outcomes through enhanced comfort, real-time monitoring, and personalized pressure control.
- Government health initiatives in the U.S. and Canada promoting preventive care, early diagnosis of venous diseases, and home-based management of chronic conditions are fueling demand for advanced compression therapy products across healthcare settings.
- The integration of compression therapy devices with digital health platforms and electronic health records (EHRs) is improving treatment compliance, remote monitoring, and patient engagement—thereby accelerating adoption.
For instance,
- According to the American Venous Forum (2024), over 40% of adults in the U.S. are affected by chronic venous disorders, underscoring a critical need for accessible and effective compression therapies.
- In March 2024, 3M Health Care launched a next-generation compression wrap in North America featuring adjustable tension indicators and antimicrobial layers to enhance ease of use and infection control in both clinical and home environments.
- The ongoing focus on non-invasive, cost-effective treatment options and the growing preference for wearable health solutions are further boosting the uptake of advanced compression therapy products across North America.
Opportunity
“Digital Health Integration and Expansion of Home-Based Compression Therapies”
- The shift toward digital healthcare delivery and decentralized patient management is opening new opportunities for the adoption of portable and connected compression therapy solutions in North America.
- Demand is rising for smart compression garments and mobile compression pumps that can be used in home care settings, long-term care facilities, and remote monitoring programs—extending care access to rural and underserved populations.
- The growth of telehealth platforms is driving the development of compression devices that sync with mobile apps, allowing clinicians to remotely monitor therapy adherence, pressure levels, and treatment progress.
For instance,
- In February 2024, the Canadian Agency for Drugs and Technologies in Health (CADTH) highlighted the growing implementation of smart compression therapy tools in community-based lymphedema management programs.
- Companies such as Bio Compression Systems and Tactile Medical have introduced app-enabled IPC devices tailored for home use, offering remote tracking and clinician feedback features.
- Healthcare providers’ focus on reducing hospital readmissions and improving chronic care outcomes is accelerating the adoption of home-based therapy models.
- Additionally, the increasing availability of cloud-based platforms and AI-powered analytics is enabling more precise and personalized compression therapy planning across multi-site healthcare networks.
Restraint/Challenge
“High Product Costs and Limited Reimbursement Coverage”
- A major challenge in the North America Compression Therapy Market is the high cost associated with premium compression products, particularly advanced pneumatic compression devices and smart wearable systems. These require substantial upfront investment, making them less accessible for low-income patients and smaller healthcare providers.
- Reimbursement policies for compression therapy vary significantly across payers and provinces, with limited coverage for certain devices, especially when used in home settings—creating disparities in access and adoption.
For instance,
- According to a 2024 report by the American College of Phlebology, many private insurers in the U.S. do not fully cover smart compression garments or home-use IPC devices unless patients meet strict clinical criteria, delaying early intervention.
- In Canada, provincial variation in lymphedema coverage programs results in inconsistent patient access to therapeutic-grade compression solutions.
- Regulatory compliance with safety and performance standards from bodies like the FDA and Health Canada also adds complexity and time to market entry for new products.
Compression Therapy Market Scope
The market is segmented into four notable segments based on Technique, Product, Application, and end user.
|
Segmentation |
Sub-Segmentation |
|
By Technique |
|
|
By Product
|
|
|
By Application
|
|
|
By End User |
|
In 2025, the o Static Compression Therapy is projected to dominate the market with a largest share in technique segment
The Static Compression Therapy segment is expected to dominate the Compression Therapy Market with the largest share of 37.82% in 2025 due to its high prevalence and demand for precision. This dominance is driven by increasing preference for easy-to-use, cost-effective, and reliable compression solutions for managing conditions such as varicose veins, lymphedema, and chronic venous insufficiency.
The Varicose Vein Treatment is expected to account for the largest share during the forecast period in application market
In 2025, the Varicose Vein Treatment segment is expected to dominate the market with the largest market share of 31.11% due to its high prevalence and demand for precision. This is attributed to to the rising prevalence of varicose veins, especially among the aging and obese population. Increased demand for non-invasive, cost-effective treatment options like compression stockings and wraps is further driving segment growth.
Compression Therapy Market Regional Analysis
“U.S. is the Dominant Country in the Compression Therapy Market”
- The United States dominates the North America Compression Therapy Market, accounting for the largest share due to its well-established healthcare infrastructure, early adoption of innovative medical technologies, and strong presence of key market players specializing in vascular and lymphedema care.
- The high prevalence of venous disorders such as chronic venous insufficiency, varicose veins, and lymphedema—coupled with a growing elderly and diabetic population—is driving increased utilization of both static and dynamic compression therapy solutions across clinical and homecare settings.
- Major companies like 3M Health Care, Tactile Medical, and Bio Compression Systems are headquartered in the U.S., offering a wide range of FDA-approved, technologically advanced compression devices designed to improve therapeutic outcomes and patient adherence.
- Government-led initiatives promoting preventive care, chronic disease management, and home-based treatment—along with favorable reimbursement policies for compression garments and devices—further reinforce the U.S.’s leadership in the North American Compression Therapy Market.
“Canada is Projected to Register the Highest Growth Rate”
- Canada is expected to register the fastest growth in the North America Compression Therapy Market. The country’s publicly funded healthcare system, combined with an increasing emphasis on chronic disease prevention and community-based care, is driving the uptake of compression therapy solutions.
- Strategic investments by provincial health authorities in managing conditions such as lymphedema, venous ulcers, and deep vein thrombosis are accelerating the adoption of both static and dynamic compression therapies. Growing awareness of early intervention and non-invasive treatment options is further supporting demand.
- The expansion of multidisciplinary clinics, rehabilitation centers, and home healthcare services across Canada is creating a robust demand for user-friendly, cost-effective compression products suited for both clinical and at-home use. Collaborations between health ministries, patient advocacy groups, and academic institutions are also fostering research and innovation in compression therapy technologies.
Compression Therapy Market Share
The market competitive landscape provides details by competitor. Details included are company overview, company financials, revenue generated, market potential, investment in research and development, new market initiatives, North America presence, production sites and facilities, production capacities, company strengths and weaknesses, product launch, product width and breadth, application dominance. The above data points provided are only related to the companies' focus related to market.
The Major Market Leaders Operating in the Market Are:
- 3M Health Care (U.S.)
- Tactile Medical (U.S.)
- Bio Compression Systems, Inc. (U.S.)
- Medi USA (Germany/U.S.)
- Sigvaris Group (Switzerland/U.S.)
- ArjoHuntleigh Inc. (Sweden)
- BSN Medical (Essity) (Germany)
- JUZO (Julius Zorn Inc.) (Germany/U.S.)
- Paul Hartmann AG (Germany)
- Thuasne Group (France)
Latest Developments in North America Compression Therapy Market
- In October 2023, Medi GmbH & Co. launched Medi Rehab, a compression stocking available in thigh stocking and calf stocking versions with either open or closed toe. Particularly in the conservative or postoperative treatment of ankle joint injuries or Achilles tendon ruptures, the calf stocking with an open toe makes it easy and comfortable to put on and take off.
SKU-

- Interactive Data Analysis Dashboard
- Company Analysis Dashboard for high growth potential opportunities
- Research Analyst Access for customization & queries
- Competitor Analysis with Interactive dashboard
- Latest News, Updates & Trend analysis
- Harness the Power of Benchmark Analysis for Comprehensive Competitor Tracking
Table of Content
1 INTRODUCTION
1.1 OBJECTIVES OF THE STUDY
1.2 MARKET DEFINITION
1.3 OVERVIEW OF THE NORTH AMERICA COMPRESSION THERAPY MARKET
1.4 LIMITATIONS
1.5 MARKETS COVERED
2 MARKET SEGMENTATION
2.1 MARKETS COVERED
2.2 GEOGRAPHICAL SCOPE
2.3 YEARS CONSIDERED FOR THE STUDY
2.4 CURRENCY AND PRICING
2.5 DBMR TRIPOD DATA VALIDATION MODEL
2.6 MULTIVARIATE MODELLING
2.7 PRIMARY INTERVIEWS WITH KEY OPINION LEADERS
2.8 DBMR MARKET POSITION GRID
2.9 MARKET APPLICATION COVERAGE GRID
2.1 VENDOR SHARE ANALYSIS
2.11 SECONDARY SOURCES
2.12 ASSUMPTIONS
3 EXECUTIVE SUMMARY
4 PREMIUM INSIGHTS
4.1 PESTAL ANALYSIS
4.2 PORTERS FIVE FORCES ANALYSIS
4.3 COST ANALYSIS BREAKDOWN
4.4 HEALTHCARE ECONOMY
4.4.1 HEALTHCARE EXPENDITURE
4.4.2 CAPITAL EXPENDITURE
4.4.3 CAPEX TRENDS
4.4.4 CAPEX ALLOCATION
4.4.5 FUNDING SOURCES
4.4.6 INDUSTRY BENCHMARKS
4.4.7 GDP RATIO IN OVERALL GDP
4.4.8 HEALTHCARE SYSTEM STRUCTURE
4.4.9 GOVERNMENT POLICIES
4.4.10 ECONOMIC DEVELOPMENT
4.5 INDUSTRY INSIGHTS
4.5.1 MICRO AND MACRO ECONOMIC FACTORS
4.5.2 PENETRATION AND GROWTH PROSPECT MAPPING
4.5.3 KEY PRICING STRATEGIES
4.6 INNOVATION TRACKER AND STRATEGIC ANALYSIS
4.6.1 MAJOR DEALS AND STRATEGIC ALLIANCES ANALYSIS
4.6.1.1 JOINT VENTURES
4.6.1.2 MERGERS AND ACQUISITIONS
4.6.1.3 LICENSING AND PARTNERSHIP
4.6.1.4 TECHNOLOGY COLLABORATIONS
4.6.1.5 STRATEGIC DIVESTMENTS
4.6.2 NUMBER OF PRODUCTS IN DEVELOPMENT
4.6.3 STAGE OF DEVELOPMENT
4.6.4 TIMELINES AND MILESTONES
4.6.5 INNOVATION STRATEGIES AND METHODOLOGIES
4.6.6 RISK ASSESSMENT AND MITIGATION
4.6.7 FUTURE OUTLOOK
4.7 OPPORTUNITY MAP ANALYSIS
4.8 PATENT ANALYSIS –
4.8.1 PATENT QUALITY AND STRENGTH
4.8.2 PATENT FAMILIES
4.8.3 LICENSING AND COLLABORATIONS
4.8.4 COMPETITIVE LANDSCAPE
4.8.5 IP STRATEGY AND MANAGEMENT
4.8.6 OTHER OBSERVATIONS
4.9 REIMBURSEMENT FRAMEWORK
4.1 SUPPLY CHAIN ECOSYSTEM
4.10.1 PROMINENT COMPANIES
4.10.2 SMALL & MEDIUM SIZE COMPANIES
4.10.3 END USERS
4.11 TECHNOLOGY ROADMAP
4.12 TARIFFS & IMPACT ON THE MARKET
4.12.1 CURRENT TARIFF RATE(S) IN TOP-5 COUNTRY MARKETS
4.13 OUTLOOK: LOCAL PRODUCTION V/S IMPORT RELIANCE
4.14 VENDOR SELECTION CRITERIA DYNAMICS
4.15 IMPACT ON SUPPLY CHAIN
4.15.1 RAW MATERIAL PROCUREMENT
4.15.2 MANUFACTURING AND PRODUCTION
4.15.3 LOGISTICS AND DISTRIBUTION
4.15.4 PRICE PITCHING AND POSITION OF MARKET
4.16 INDUSTRY PARTICIPANTS: PROACTIVE MOVES
4.16.1 SUPPLY CHAIN OPTIMIZATION
4.16.2 JOINT VENTURE ESTABLISHMENTS
4.17 IMPACT ON PRICES
4.18 REGULATORY INCLINATION
4.18.1 GEOPOLITICAL SITUATION
4.18.2 TRADE PARTNERSHIPS BETWEEN COUNTRIES
4.18.2.1 FREE TRADE AGREEMENTS:
4.18.2.2 ALLIANCES ESTABLISHMENTS:
4.18.3 STATUS ACCREDITATION (INCLUDING MFTN)
4.18.4 DOMESTIC COURSE OF CORRECTION
4.18.4.1 INCENTIVE SCHEMES TO BOOST PRODUCTION OUTPUTS:
4.18.4.2 ESTABLISHMENT OF SPECIAL ECONOMIC ZONES / INDUSTRIAL PARKS:
4.19 PRICE INDEX
5 REGULATORY FRAMEWORK
6 MARKET OVERVIEW
6.1 DRIVERS
6.1.1 RISING PREVALENCE OF CHRONIC VENOUS DISORDERS GLOBALLY
6.1.2 TECHNOLOGICAL ADVANCEMENTS AND PRODUCT INNOVATION
6.1.3 INCREASING SPORTS INJURIES & ACCIDENTS
6.1.4 INCREASING AWARENESS OF THERAPY BENEFITS
6.2 RESTRAINTS
6.2.1 LIMITED REIMBURSEMENT AND INSURANCE COVERAGE
6.2.2 AVAILABILITY OF ALTERNATIVE TREATMENT
6.3 OPPORTUNITIES
6.3.1 GROWTH IN HOME BASED THERAPY
6.3.2 POST-SURGICAL CARE & REHABILITATION
6.3.3 RISING LIFESTYLE-RELATED DISEASES
6.4 CHALLENGES
6.4.1 LACK OF STANDARDIZED THERAPY PROTOCOLS
6.4.2 ENSURING ACCURATE PRODUCT FIT AND CORRECT APPLICATION
7 NORTH AMERICA COMPRESSION THERAPY MARKET, BY PRODUCT TECHNIQUE
7.1 OVERVIEW
7.2 STATIC COMPRESSION THERAPY
7.2.1 COMPRESSION STOCKINGS
7.2.2 COMPRESSION BANDAGES
7.2.3 COMPRESSION SLEEVES
7.2.4 COMPRESSION WRAPS
7.2.5 COMPRESSION GLOVES/GAUNTLETS
7.3 DYNAMIC COMPRESSION THERAPY
7.3.1 PNEUMATIC COMPRESSION DEVICES
7.3.2 ADAPTIVE COMPRESSION THERAPY DEVICES
8 NORTH AMERICA COMPRESSION THERAPY MARKET, BY PRODUCT TYPE
8.1 OVERVIEW
8.2 COMPRESSION BANDAGES
8.2.1 SHORT STRETCH BANDAGES
8.2.2 LONG STRETCH BANDAGES
8.2.3 MULTILAYER COMPRESSION BANDAGES
8.3 COMPRESSION GARMENTS FOR LYMPHEDEMA
8.3.1 LEG GARMENTS
8.3.2 ARM SLEEVES
8.3.3 HAND GLOVES
8.3.4 TORSO/TRUNK GARMENTS
8.3.5 FACE/HEAD GARMENTS
8.4 COMPRESSION STOCKINGS FOR VENOUS DISEASES
8.4.1 BELOW KNEE STOCKINGS
8.4.2 THIGH HIGH STOCKINGS
8.4.3 PANTYHOSE/FULL LEG STOCKINGS
8.4.4 MATERNITY STOCKINGS
8.5 COMPRESSION WRAPS
8.6 PNEUMATIC COMPRESSION DEVICES
8.7 COMPRESSION HOSIERY & GAUNTLETS
9 NORTH AMERICA COMPRESSION THERAPY MARKET, BY APPLICATION
9.1 OVERVIEW
9.2 VARICOSE VEINS
9.3 LYMPHEDEMA
9.4 CHRONIC VENOUS INSUFFICIENCY (CVI)
9.5 DEEP VEIN THROMBOSIS (DVT)
9.6 VENOUS LEG ULCERS
9.7 WOUND CARE
9.8 SPORTS INJURY MANAGEMENT
10 NORTH AMERICA COMPRESSION THERAPY MARKET, BY PATIENT GROUP
10.1 OVERVIEW
10.2 ADULT
10.3 GERIATRIC
10.4 PEDIATRIC
11 NORTH AMERICA COMPRESSION THERAPY MARKET, BY COMPRESSION LEVEL
11.1 OVERVIEW
11.2 MODERATE COMPRESSION
11.3 STRONG COMPRESSION
11.4 MILD COMPRESSION
11.5 VERY STRONG COMPRESSION
12 NORTH AMERICA COMPRESSION THERAPY MARKET, BY DISTRIBUTION CHANNELS
12.1 OVERVIEW
12.2 HOSPITALS
12.2.1 BANDAGES
12.2.2 POST-OPERATIVE COMPRESSION STOCKINGS
12.2.3 PNEUMATIC COMPRESSION DEVICES
12.3 RETAIL PHARMACIES
12.3.1 MILD TO MODERATE COMPRESSION STOCKINGS
12.3.2 COMPRESSION BANDAGES
12.3.3 SLEEVES AND GAUNTLETS
12.4 ECOMMERCE PLATFORMS
12.4.1 COMPRESSION STOCKINGS & GARMENTS
12.4.2 COMPRESSION WRAPS
12.4.3 SLEEVES, GLOVES, AND SOCKS
12.4.4 PORTABLE PNEUMATIC DEVICES
12.5 SPECIALTY CLINICS
12.5.1 HIGH-PRESSURE COMPRESSION GARMENTS
12.5.2 PNEUMATIC COMPRESSION PUMPS
12.5.3 CUSTOM WRAPS
12.6 MEDICAL DEVICE STORES
12.6.1 COMPRESSION STOCKINGS
12.6.2 COMPRESSION BANDAGES
12.6.3 COMPRESSION WRAPS
12.6.4 PNEUMATIC COMPRESSION DEVICES
12.6.5 ADAPTIVE COMPRESSION SYSTEMS
12.7 HOME HEALTHCARE PROVIDERS
12.7.1 COMPRESSION WRAPS
12.7.2 SLEEVES & GARMENTS
12.7.3 BANDAGES
12.7.4 PNEUMATIC PUMPS (PORTABLE)
12.8 NURSING HOMES/LONG-TERM CARE FACILITIES
12.8.1 COMPRESSION WRAPS
12.8.2 SLEEVES AND GAUNTLETS
12.8.3 ADAPTIVE GARMENTS
13 NORTH AMERICA COMPRESSION THERAPY MARKET, BY REGION
13.1 NORTH AMERICA
13.1.1 U.S.
13.1.2 CANADA
13.1.3 MEXICO
14 NORTH AMERICA COMPRESSION THERAPY MARKET: COMPANY LANDSCAPE
14.1 COMPANY SHARE ANALYSIS: NORTH AMERICA
15 SWOT ANALYSIS
16 COMAPANY PROFILES
16.1 SOLVENTUM
16.1.1 COMPANY SNAPSHOT
16.1.2 REVENUE ANALYSIS
16.1.3 COMPANY SHARE ANALYSIS
16.1.4 PRODUCT PORTFOLIO
16.1.5 RECENT DEVELOPMENT
16.2 CARDINAL HEALTH
16.2.1 COMPANY SNAPSHOT
16.2.2 REVENUE ANALYSIS
16.2.3 COMPANY SHARE ANALYSIS
16.2.4 PRODUCT PORTFOLIO
16.2.5 RECENT DEVELOPMENT
16.3 SMITH+NEPHEW
16.3.1 COMPANY SNAPSHOT
16.3.2 REVENUE ANALYSIS
16.3.3 COMPANY SHARE ANALYSIS
16.3.4 PRODUCT PORTFOLIO
16.3.5 RECENT DEVELOPMENT
16.4 ESSITY AKTIEBOLAG (PUBL)
16.4.1 COMPANY SNAPSHOT
16.4.2 REVENUE ANALYSIS
16.4.3 COMPANY SHARE ANALYSIS
16.4.4 PRODUCT PORTFOLIO
16.4.5 RECENT DEVELOPMENT
16.5 PAUL HARTMANN AG
16.5.1 COMPANY SNAPSHOT
16.5.2 REVENUE ANALYSIS
16.5.3 COMPANY SHARE ANALYSIS
16.5.4 PRODUCT PORTFOLIO
16.5.5 RECENT DEVELOPMENT
16.6 ADIDAS AG
16.6.1 COMPANY SNAPSHOT
16.6.2 REVENUE ANALYSIS
16.6.3 PRODUCT PORTFOLIO
16.6.4 RECENT DEVELOPMENT
16.7 AIROS MEDICAL, INC.
16.7.1 COMPANY SNAPSHOT
16.7.2 PRODUCT PORTFOLIO
16.7.3 RECENT DEVELOPMENT
16.8 ARJO
16.8.1 COMPANY SNAPSHOT
16.8.2 REVENUE ANALYSIS
16.8.3 PRODUCT PORTFOLIO
16.8.4 RECENT DEVELOPMENTS
16.9 BAUERFEIND
16.9.1 COMPANY SNAPSHOT
16.9.2 PRODUCT PORTFOLIO
16.9.3 RECENT DEVELOPMENT
16.1 BIOCOMPRESSION SYSTEMS
16.10.1 COMPANY SNAPSHOT
16.10.2 PRODUCT PORTFOLIO
16.10.3 RECENT DEVELOPMENT
16.11 CALZE G.T.S.R.L
16.11.1 COMPANY SNAPSHOT
16.11.2 PRODUCT PORTFOLIO
16.11.3 RECENT DEVELOPMENT
16.12 CONVATEC GROUP PLC
16.12.1 COMPANY SNAPSHOT
16.12.2 PRODUCT PORTFOLIO
16.12.3 RECENT DEVELOPMENT
16.13 ENOVIS CORPORATION
16.13.1 COMPANY SNAPSHOT
16.13.2 REVENUE ANALYSIS
16.13.3 BRAND PORTFOLIO
16.13.4 RECENT DEVELOPMENTS
16.14 GETINGE
16.14.1 COMPANY SNAPSHOT
16.14.2 REVENUE ANALYSIS
16.14.3 PRODUCT PORTFOLIO
16.14.4 RECENT DEVELOPMENT
16.15 HUNTLEIGH HEALTHCARE LIMITED
16.15.1 COMPANY SNAPSHOT
16.15.2 PRODUCT PORTFOLIO
16.15.3 RECENT DEVELOPMENT
16.16 JUZO
16.16.1 COMPANY SNAPSHOT
16.16.2 PRODUCT PORTFOLIO
16.16.3 RECENT DEVELOPMENT
16.17 LOHMANN & RAUSCHER GMBH & CO. KG
16.17.1 COMPANY SNAPSHOT
16.17.2 PRODUCT PORTFOLIO
16.17.3 RECENT DEVELOPMENT
16.18 MCKESSON MEDICAL-SURGICAL INC.
16.18.1 COMPANY SNAPSHOT
16.18.2 REVENUE ANALYSIS
16.18.3 PRODUCT PORTFOLIO
16.18.4 RECENT DEVELOPMENT
16.19 MEDLINE INDUSTRIES, LP
16.19.1 COMPANY SNAPSHOT
16.19.2 PRODUCT PORTFOLIO
16.19.3 RECENT DEVELOPMENTS
16.2 MEDI GMBH & CO. KG
16.20.1 COMPANY SNAPSHOT
16.20.2 PRODUCT PORTFOLIO
16.20.3 RECENT DEVELOPMENT
16.21 MEGO AFEK LTD.
16.21.1 COMPANY SNAPSHOT
16.21.2 PRODUCT PORTFOLIO
16.21.3 RECENT DEVELOPMENT
16.22 MÖLNLYCKE AB
16.22.1 COMPANY SNAPSHOT
16.22.2 PRODUCT PORTFOLIO
16.22.3 RECENT DEVELOPMENT
16.23 NIKE, INC.
16.23.1 COMPANY SNAPSHOT
16.23.2 REVENUE ANALYSIS
16.23.3 PRODUCT PORTFOLIO
16.23.4 RECENT DEVELOPMENT
16.24 OFA BAMBERG GMBH
16.24.1 COMPANY SNAPSHOT
16.24.2 PRODUCT PORTFOLIO
16.24.3 RECENT DEVELOPMENT
16.25 ÖSSUR
16.25.1 COMPANY SNAPSHOT
16.25.2 RECENT FINANCIALS
16.25.3 PRODUCT PORTFOLIO
16.25.4 RECENT DEVELOPMENT
16.26 SIGVARIS GROUP
16.26.1 COMPANY SNAPSHOT
16.26.2 PRODUCT PORTFOLIO
16.26.3 RECENT DEVELOPMENT
16.27 TACTILE MEDICAL
16.27.1 COMPANY SNAPSHOT
16.27.2 REVENUE ANALYSIS
16.27.3 PRODUCT PORTFOLIO
16.27.4 RECENT DEVELOPMENT
16.28 THERMOTEK
16.28.1 COMPANY SNAPSHOT
16.28.2 PRODUCT PORTFOLIO
16.28.3 RECENT DEVELOPMENT
16.29 THUASNE, SAS
16.29.1 COMPANY SNAPSHOT
16.29.2 PRODUCT PORTFOLIO
16.29.3 RECENT DEVELOPMENT
16.3 ZIMMER BIOMET
16.30.1 COMPANY SNAPSHOT
16.30.2 REVENUE ANALYSIS
16.30.3 PRODUCT PORTFOLIO
16.30.4 RECENT DEVELOPMENTS
17 QUESTIONNAIRE
18 RELATED REPORTS
List of Table
TABLE 1 NORTH AMERICA COMPRESSION THERAPY MARKET, BY PRODUCT TECHNIQUE, 2018-2032 (USD THOUSAND)
TABLE 2 NORTH AMERICA STATIC COMPRESSION THERAPY IN COMPRESSION THERAPY MARKET, BY REGION, 2018-2032 (USD THOUSAND)
TABLE 3 NORTH AMERICA STATIC COMPRESSION THERAPY IN COMPRESSION THERAPY MARKET, BY TYPE, 2018-2032 (USD THOUSAND)
TABLE 4 NORTH AMERICA DYNAMIC COMPRESSION THERAPY IN COMPRESSION THERAPY MARKET, BY REGION, 2018-2032 (USD THOUSAND)
TABLE 5 NORTH AMERICA DYNAMIC COMPRESSION THERAPY IN COMPRESSION THERAPY MARKET, BY TYPE, 2018-2032 (USD THOUSAND)
TABLE 6 NORTH AMERICA COMPRESSION THERAPY MARKET, BY PRODUCT TYPE, 2018-2032 (USD THOUSAND)
TABLE 7 NORTH AMERICA COMPRESSION BANDAGES IN COMPRESSION THERAPY MARKET, BY REGION, 2018-2032 (USD THOUSAND)
TABLE 8 NORTH AMERICA COMPRESSION BANDAGES IN COMPRESSION THERAPY MARKET, BY TYPE, 2018-2032 (USD THOUSAND)
TABLE 9 NORTH AMERICA COMPRESSION GARMENTS FOR LYMPHEDEMA IN COMPRESSION THERAPY MARKET, BY REGION, 2018-2032 (USD THOUSAND)
TABLE 10 NORTH AMERICA COMPRESSION GARMENTS FOR LYMPHEDEMA IN COMPRESSION THERAPY MARKET, BY TYPE, 2018-2032 (USD THOUSAND)
TABLE 11 NORTH AMERICA COMPRESSION STOCKINGS FOR VENOUS DISEASES IN COMPRESSION THERAPY MARKET, BY REGION, 2018-2032 (USD THOUSAND)
TABLE 12 NORTH AMERICA COMPRESSION STOCKINGS FOR VENOUS DISEASES IN COMPRESSION THERAPY MARKET, BY TYPE, 2018-2032 (USD THOUSAND)
TABLE 13 NORTH AMERICA COMPRESSION WRAPS IN COMPRESSION THERAPY MARKET, BY REGION, 2018-2032 (USD THOUSAND)
TABLE 14 NORTH AMERICA PNEUMATIC COMPRESSION DEVICES IN COMPRESSION THERAPY MARKET, BY REGION, 2018-2032 (USD THOUSAND)
TABLE 15 NORTH AMERICA COMPRESSION HOSIERY & GAUNTLETS IN COMPRESSION THERAPY MARKET, BY REGION, 2018-2032 (USD THOUSAND)
TABLE 16 NORTH AMERICA COMPRESSION THERAPY MARKET, BY APPLICATION, 2018-2032 (USD THOUSAND)
TABLE 17 NORTH AMERICA VARICOSE VEINS IN COMPRESSION THERAPY MARKET, BY REGION, 2018-2032 (USD THOUSAND)
TABLE 18 NORTH AMERICA LYMPHEDEMA IN COMPRESSION THERAPY MARKET, BY REGION, 2018-2032 (USD THOUSAND)
TABLE 19 NORTH AMERICA CHRONIC VENOUS INSUFFICIENCY (CVI) IN COMPRESSION THERAPY MARKET, BY REGION, 2018-2032 (USD THOUSAND)
TABLE 20 NORTH AMERICA DEEP VEIN THROMBOSIS (DVT) IN COMPRESSION THERAPY MARKET, BY REGION, 2018-2032 (USD THOUSAND)
TABLE 21 NORTH AMERICA VENOUS LEG ULCERS IN COMPRESSION THERAPY MARKET, BY REGION, 2018-2032 (USD THOUSAND)
TABLE 22 NORTH AMERICA WOUND CARE IN COMPRESSION THERAPY MARKET, BY REGION, 2018-2032 (USD THOUSAND)
TABLE 23 NORTH AMERICA SPORTS INJURY MANAGEMENT IN COMPRESSION THERAPY MARKET, BY REGION, 2018-2032 (USD THOUSAND)
TABLE 24 NORTH AMERICA COMPRESSION THERAPY MARKET, BY PATIENT GROUP, 2018-2032 (USD THOUSAND)
TABLE 25 NORTH AMERICA ADULT IN COMPRESSION THERAPY MARKET, BY REGION, 2018-2032 (USD THOUSAND)
TABLE 26 NORTH AMERICA GERIATRIC IN COMPRESSION THERAPY MARKET, BY REGION, 2018-2032 (USD THOUSAND)
TABLE 27 NORTH AMERICA PEDIATRIC IN COMPRESSION THERAPY MARKET, BY REGION, 2018-2032 (USD THOUSAND)
TABLE 28 NORTH AMERICA COMPRESSION THERAPY MARKET, BY COMPRESSION LEVEL, 2018-2032 (USD THOUSAND)
TABLE 29 NORTH AMERICA MODERATE COMPRESSION IN COMPRESSION THERAPY MARKET, BY REGION, 2018-2032 (USD THOUSAND)
TABLE 30 NORTH AMERICA STRONG COMPRESSION IN COMPRESSION THERAPY MARKET, BY REGION, 2018-2032 (USD THOUSAND)
TABLE 31 NORTH AMERICA MILD COMPRESSION IN COMPRESSION THERAPY MARKET, BY REGION, 2018-2032 (USD THOUSAND)
TABLE 32 NORTH AMERICA VERY STRONG COMPRESSION IN COMPRESSION THERAPY MARKET, BY REGION, 2018-2032 (USD THOUSAND)
TABLE 33 NORTH AMERICA COMPRESSION THERAPY MARKET, BY DISTRIBUTION CHANNELS, 2018-2032 (USD THOUSAND)
TABLE 34 NORTH AMERICA HOSPITALS IN COMPRESSION THERAPY MARKET, BY REGION, 2018-2032 (USD THOUSAND)
TABLE 35 NORTH AMERICA HOSPITALS IN COMPRESSION THERAPY MARKET, BY TYPE, 2018-2032 (USD THOUSAND)
TABLE 36 NORTH AMERICA RETAIL PHARMACIES IN COMPRESSION THERAPY MARKET, BY REGION, 2018-2032 (USD THOUSAND)
TABLE 37 NORTH AMERICA RETAIL PHARMACIES IN COMPRESSION THERAPY MARKET, BY TYPE, 2018-2032 (USD THOUSAND)
TABLE 38 NORTH AMERICA ECOMMERCE PLATFORMS IN COMPRESSION THERAPY MARKET, BY REGION, 2018-2032 (USD THOUSAND)
TABLE 39 NORTH AMERICA ECOMMERCE PLATFORMS IN COMPRESSION THERAPY MARKET, BY TYPE, 2018-2032 (USD THOUSAND)
TABLE 40 NORTH AMERICA SPECIALTY CLINICS IN COMPRESSION THERAPY MARKET, BY REGION, 2018-2032 (USD THOUSAND)
TABLE 41 NORTH AMERICA SPECIALTY CLINICS IN COMPRESSION THERAPY MARKET, BY TYPE, 2018-2032 (USD THOUSAND)
TABLE 42 NORTH AMERICA MEDICAL DEVICE STORES IN COMPRESSION THERAPY MARKET, BY REGION, 2018-2032 (USD THOUSAND)
TABLE 43 NORTH AMERICA MEDICAL DEVICE STORES IN COMPRESSION THERAPY MARKET, BY TYPE, 2018-2032 (USD THOUSAND)
TABLE 44 NORTH AMERICA HOME HEALTHCARE PROVIDERS IN COMPRESSION THERAPY MARKET, BY REGION, 2018-2032 (USD THOUSAND)
TABLE 45 NORTH AMERICA HOME HEALTHCARE PROVIDERS IN COMPRESSION THERAPY MARKET, BY TYPE, 2018-2032 (USD THOUSAND)
TABLE 46 NORTH AMERICA NURSING HOMES/LONG-TERM CARE FACILITIES IN COMPRESSION THERAPY MARKET, BY REGION, 2018-2032 (USD THOUSAND)
TABLE 47 NORTH AMERICA NURSING HOMES/LONG-TERM CARE FACILITIES IN COMPRESSION THERAPY MARKET, BY TYPE, 2018-2032 (USD THOUSAND)
TABLE 48 NORTH AMERICA COMPRESSION THERAPY MARKET, BY REGION, 2018-2032 (USD THOUSAND)
TABLE 49 NORTH AMERICA COMPRESSION THERAPY MARKET, BY COUNTRY, 2018-2032 (USD THOUSAND)
TABLE 50 NORTH AMERICA COMPRESSION THERAPY MARKET, BY PRODUCT TECHNIQUE, 2018-2032 (USD THOUSAND)
TABLE 51 NORTH AMERICA STATIC COMPRESSION THERAPY IN COMPRESSION THERAPY MARKET, BY TYPE, 2018-2032 (USD THOUSAND)
TABLE 52 NORTH AMERICA DYNAMIC COMPRESSION THERAPY IN COMPRESSION THERAPY MARKET, BY TYPE, 2018-2032 (USD THOUSAND)
TABLE 53 NORTH AMERICA COMPRESSION THERAPY MARKET, BY PRODUCT TYPE, 2018-2032 (USD THOUSAND)
TABLE 54 NORTH AMERICA COMPRESSION BANDAGES IN COMPRESSION THERAPY MARKET, BY TYPE, 2018-2032 (USD THOUSAND)
TABLE 55 NORTH AMERICA COMPRESSION GARMENTS FOR LYMPHEDEMA IN COMPRESSION THERAPY MARKET, BY TYPE, 2018-2032 (USD THOUSAND)
TABLE 56 NORTH AMERICA COMPRESSION STOCKINGS FOR VENOUS DISEASES IN COMPRESSION THERAPY MARKET, BY TYPE, 2018-2032 (USD THOUSAND)
TABLE 57 NORTH AMERICA COMPRESSION THERAPY MARKET, BY APPLICATION, 2018-2032 (USD THOUSAND)
TABLE 58 NORTH AMERICA COMPRESSION THERAPY MARKET, BY PATIENT GROUP, 2018-2032 (USD THOUSAND)
TABLE 59 NORTH AMERICA COMPRESSION THERAPY MARKET, BY COMPRESSION LEVEL, 2018-2032 (USD THOUSAND)
TABLE 60 NORTH AMERICA COMPRESSION THERAPY MARKET, BY DISTRIBUTION CHANNELS, 2018-2032 (USD THOUSAND)
TABLE 61 NORTH AMERICA HOSPITALS IN COMPRESSION THERAPY MARKET, BY TYPE, 2018-2032 (USD THOUSAND)
TABLE 62 NORTH AMERICA RETAIL PHARMACIES IN COMPRESSION THERAPY MARKET, BY TYPE, 2018-2032 (USD THOUSAND)
TABLE 63 NORTH AMERICA ECOMMERCE PLATFORMS IN COMPRESSION THERAPY MARKET, BY TYPE, 2018-2032 (USD THOUSAND)
TABLE 64 NORTH AMERICA SPECIALTY CLINICS IN COMPRESSION THERAPY MARKET, BY TYPE, 2018-2032 (USD THOUSAND)
TABLE 65 NORTH AMERICA MEDICAL DEVICE STORES IN COMPRESSION THERAPY MARKET, BY TYPE, 2018-2032 (USD THOUSAND)
TABLE 66 NORTH AMERICA HOME HEALTHCARE PROVIDERS IN COMPRESSION THERAPY MARKET, BY TYPE, 2018-2032 (USD THOUSAND)
TABLE 67 NORTH AMERICA NURSING HOMES/LONG-TERM CARE FACILITIES IN COMPRESSION THERAPY MARKET, BY TYPE, 2018-2032 (USD THOUSAND)
TABLE 68 U.S. COMPRESSION THERAPY MARKET, BY PRODUCT TECHNIQUE, 2018-2032 (USD THOUSAND)
TABLE 69 U.S. STATIC COMPRESSION THERAPY IN COMPRESSION THERAPY MARKET, BY TYPE, 2018-2032 (USD THOUSAND)
TABLE 70 U.S. DYNAMIC COMPRESSION THERAPY IN COMPRESSION THERAPY MARKET, BY TYPE, 2018-2032 (USD THOUSAND)
TABLE 71 U.S. COMPRESSION THERAPY MARKET, BY PRODUCT TYPE, 2018-2032 (USD THOUSAND)
TABLE 72 U.S. COMPRESSION BANDAGES IN COMPRESSION THERAPY MARKET, BY TYPE, 2018-2032 (USD THOUSAND)
TABLE 73 U.S. COMPRESSION GARMENTS FOR LYMPHEDEMA IN COMPRESSION THERAPY MARKET, BY TYPE, 2018-2032 (USD THOUSAND)
TABLE 74 U.S. COMPRESSION STOCKINGS FOR VENOUS DISEASES IN COMPRESSION THERAPY MARKET, BY TYPE, 2018-2032 (USD THOUSAND)
TABLE 75 U.S. COMPRESSION THERAPY MARKET, BY APPLICATION, 2018-2032 (USD THOUSAND)
TABLE 76 U.S. COMPRESSION THERAPY MARKET, BY PATIENT GROUP, 2018-2032 (USD THOUSAND)
TABLE 77 U.S. COMPRESSION THERAPY MARKET, BY COMPRESSION LEVEL, 2018-2032 (USD THOUSAND)
TABLE 78 U.S. COMPRESSION THERAPY MARKET, BY DISTRIBUTION CHANNELS, 2018-2032 (USD THOUSAND)
TABLE 79 U.S. HOSPITALS IN COMPRESSION THERAPY MARKET, BY TYPE, 2018-2032 (USD THOUSAND)
TABLE 80 U.S. RETAIL PHARMACIES IN COMPRESSION THERAPY MARKET, BY TYPE, 2018-2032 (USD THOUSAND)
TABLE 81 U.S. ECOMMERCE PLATFORMS IN COMPRESSION THERAPY MARKET, BY TYPE, 2018-2032 (USD THOUSAND)
TABLE 82 U.S. SPECIALTY CLINICS IN COMPRESSION THERAPY MARKET, BY TYPE, 2018-2032 (USD THOUSAND)
TABLE 83 U.S. MEDICAL DEVICE STORES IN COMPRESSION THERAPY MARKET, BY TYPE, 2018-2032 (USD THOUSAND)
TABLE 84 U.S. HOME HEALTHCARE PROVIDERS IN COMPRESSION THERAPY MARKET, BY TYPE, 2018-2032 (USD THOUSAND)
TABLE 85 U.S. NURSING HOMES/LONG-TERM CARE FACILITIES IN COMPRESSION THERAPY MARKET, BY TYPE, 2018-2032 (USD THOUSAND)
TABLE 86 CANADA COMPRESSION THERAPY MARKET, BY PRODUCT TECHNIQUE, 2018-2032 (USD THOUSAND)
TABLE 87 CANADA STATIC COMPRESSION THERAPY IN COMPRESSION THERAPY MARKET, BY TYPE, 2018-2032 (USD THOUSAND)
TABLE 88 CANADA DYNAMIC COMPRESSION THERAPY IN COMPRESSION THERAPY MARKET, BY TYPE, 2018-2032 (USD THOUSAND)
TABLE 89 CANADA COMPRESSION THERAPY MARKET, BY PRODUCT TYPE, 2018-2032 (USD THOUSAND)
TABLE 90 CANADA COMPRESSION BANDAGES IN COMPRESSION THERAPY MARKET, BY TYPE, 2018-2032 (USD THOUSAND)
TABLE 91 CANADA COMPRESSION GARMENTS FOR LYMPHEDEMA IN COMPRESSION THERAPY MARKET, BY TYPE, 2018-2032 (USD THOUSAND)
TABLE 92 CANADA COMPRESSION STOCKINGS FOR VENOUS DISEASES IN COMPRESSION THERAPY MARKET, BY TYPE, 2018-2032 (USD THOUSAND)
TABLE 93 CANADA COMPRESSION THERAPY MARKET, BY APPLICATION, 2018-2032 (USD THOUSAND)
TABLE 94 CANADA COMPRESSION THERAPY MARKET, BY PATIENT GROUP, 2018-2032 (USD THOUSAND)
TABLE 95 CANADA COMPRESSION THERAPY MARKET, BY COMPRESSION LEVEL, 2018-2032 (USD THOUSAND)
TABLE 96 CANADA COMPRESSION THERAPY MARKET, BY DISTRIBUTION CHANNELS, 2018-2032 (USD THOUSAND)
TABLE 97 CANADA HOSPITALS IN COMPRESSION THERAPY MARKET, BY TYPE, 2018-2032 (USD THOUSAND)
TABLE 98 CANADA RETAIL PHARMACIES IN COMPRESSION THERAPY MARKET, BY TYPE, 2018-2032 (USD THOUSAND)
TABLE 99 CANADA ECOMMERCE PLATFORMS IN COMPRESSION THERAPY MARKET, BY TYPE, 2018-2032 (USD THOUSAND)
TABLE 100 CANADA SPECIALTY CLINICS IN COMPRESSION THERAPY MARKET, BY TYPE, 2018-2032 (USD THOUSAND)
TABLE 101 CANADA MEDICAL DEVICE STORES IN COMPRESSION THERAPY MARKET, BY TYPE, 2018-2032 (USD THOUSAND)
TABLE 102 CANADA HOME HEALTHCARE PROVIDERS IN COMPRESSION THERAPY MARKET, BY TYPE, 2018-2032 (USD THOUSAND)
TABLE 103 CANADA NURSING HOMES/LONG-TERM CARE FACILITIES IN COMPRESSION THERAPY MARKET, BY TYPE, 2018-2032 (USD THOUSAND)
TABLE 104 MEXICO COMPRESSION THERAPY MARKET, BY PRODUCT TECHNIQUE, 2018-2032 (USD THOUSAND)
TABLE 105 MEXICO STATIC COMPRESSION THERAPY IN COMPRESSION THERAPY MARKET, BY TYPE, 2018-2032 (USD THOUSAND)
TABLE 106 MEXICO DYNAMIC COMPRESSION THERAPY IN COMPRESSION THERAPY MARKET, BY TYPE, 2018-2032 (USD THOUSAND)
TABLE 107 MEXICO COMPRESSION THERAPY MARKET, BY PRODUCT TYPE, 2018-2032 (USD THOUSAND)
TABLE 108 MEXICO COMPRESSION BANDAGES IN COMPRESSION THERAPY MARKET, BY TYPE, 2018-2032 (USD THOUSAND)
TABLE 109 MEXICO COMPRESSION GARMENTS FOR LYMPHEDEMA IN COMPRESSION THERAPY MARKET, BY TYPE, 2018-2032 (USD THOUSAND)
TABLE 110 MEXICO COMPRESSION STOCKINGS FOR VENOUS DISEASES IN COMPRESSION THERAPY MARKET, BY TYPE, 2018-2032 (USD THOUSAND)
TABLE 111 MEXICO COMPRESSION THERAPY MARKET, BY APPLICATION, 2018-2032 (USD THOUSAND)
TABLE 112 MEXICO COMPRESSION THERAPY MARKET, BY PATIENT GROUP, 2018-2032 (USD THOUSAND)
TABLE 113 MEXICO COMPRESSION THERAPY MARKET, BY COMPRESSION LEVEL, 2018-2032 (USD THOUSAND)
TABLE 114 MEXICO COMPRESSION THERAPY MARKET, BY DISTRIBUTION CHANNELS, 2018-2032 (USD THOUSAND)
TABLE 115 MEXICO HOSPITALS IN COMPRESSION THERAPY MARKET, BY TYPE, 2018-2032 (USD THOUSAND)
TABLE 116 MEXICO RETAIL PHARMACIES IN COMPRESSION THERAPY MARKET, BY TYPE, 2018-2032 (USD THOUSAND)
TABLE 117 MEXICO ECOMMERCE PLATFORMS IN COMPRESSION THERAPY MARKET, BY TYPE, 2018-2032 (USD THOUSAND)
TABLE 118 MEXICO SPECIALTY CLINICS IN COMPRESSION THERAPY MARKET, BY TYPE, 2018-2032 (USD THOUSAND)
TABLE 119 MEXICO MEDICAL DEVICE STORES IN COMPRESSION THERAPY MARKET, BY TYPE, 2018-2032 (USD THOUSAND)
TABLE 120 MEXICO HOME HEALTHCARE PROVIDERS IN COMPRESSION THERAPY MARKET, BY TYPE, 2018-2032 (USD THOUSAND)
TABLE 121 MEXICO NURSING HOMES/LONG-TERM CARE FACILITIES IN COMPRESSION THERAPY MARKET, BY TYPE, 2018-2032 (USD THOUSAND)
List of Figure
FIGURE 1 NORTH AMERICA COMPRESSION THERAPY MARKET: SEGMENTATION
FIGURE 2 NORTH AMERICA COMPRESSION THERAPY MARKET: DATA TRIANGULATION
FIGURE 3 NORTH AMERICA COMPRESSION THERAPY MARKET: DROC ANALYSIS
FIGURE 4 NORTH AMERICA COMPRESSION THERAPY MARKET: NORTH AMERICA VS REGIONAL MARKET ANALYSIS
FIGURE 5 NORTH AMERICA COMPRESSION THERAPY MARKET: COMPANY RESEARCH ANALYSIS
FIGURE 6 NORTH AMERICA COMPRESSION THERAPY MARKET: MULTIVARIATE MODELLING
FIGURE 7 NORTH AMERICA COMPRESSION THERAPY MARKET: INTERVIEW DEMOGRAPHICS
FIGURE 8 NORTH AMERICA COMPRESSION THERAPY MARKET: MARKET POSITION GRID
FIGURE 9 NORTH AMERICA COMPRESSION THERAPY MARKET: MARKET APPLICATION COVERAGE GRID
FIGURE 10 NORTH AMERICA COMPRESSION THERAPY MARKET: VENDOR SHARE ANALYSIS
FIGURE 11 NORTH AMERICA COMPRESSION THERAPY MARKET: SEGMENTATION
FIGURE 12 NORTH AMERICA COMPRESSION THERAPY MARKET: EXECUTIVE SUMMARY
FIGURE 13 NORTH AMERICA COMPRESSION THERAPY MARKET: STRATEGIC DECISIONS
FIGURE 14 RISING PREVALENCE OF CHRONIC VENOUS DISORDERS GLOBALLY IS EXPECTED TO DRIVE THE NORTH AMERICA COMPRESSION THERAPY MARKET IN THE FORECAST PERIOD OF 2025 TO 2032
FIGURE 15 STATIC COMPRESSION THERAPY SEGMENT IS EXPECTED TO ACCOUNT FOR THE LARGEST SHARE OF THE NORTH AMERICA COMPRESSION THERAPY MARKET IN THE FORECAST PERIOD OF 2025 & 2032
FIGURE 16 TWO SEGMENT COMPRISE THE NORTH AMERICA COMPRESSION THERAPY MARKET, BY PRODUCT TECHNIQUE (2024)
FIGURE 17 DISTRIBUTION OF PATENTS BY IPC CODE
FIGURE 18 REGION-WISE DISTRIBUTION OF PATENTS
FIGURE 19 NUMBER OF PATENTS BY APPLICANT
FIGURE 20 ANNUAL PATENT PUBLICATIONS
FIGURE 21 DRIVERS, RESTRAINTS, OPPORTUNITIES, AND CHALLENGES OF THE NORTH AMERICA COMPRESSION THERAPY MARKET
FIGURE 22 NORTH AMERICA COMPRESSION THERAPY MARKET: BY PRODUCT TECHNIQUE, 2024
FIGURE 23 NORTH AMERICA COMPRESSION THERAPY MARKET: BY PRODUCT TECHNIQUE, 2025 TO 2032 (USD THOUSAND)
FIGURE 24 NORTH AMERICA COMPRESSION THERAPY MARKET: BY PRODUCT TECHNIQUE, CAGR (2025-2032)
FIGURE 25 NORTH AMERICA COMPRESSION THERAPY MARKET: BY PRODUCT TECHNIQUE, LIFELINE CURVE
FIGURE 26 NORTH AMERICA COMPRESSION THERAPY MARKET: BY PRODUCT TYPE, 2024
FIGURE 27 NORTH AMERICA COMPRESSION THERAPY MARKET: BY PRODUCT TYPE, 2025 TO 2032 (USD THOUSAND)
FIGURE 28 NORTH AMERICA COMPRESSION THERAPY MARKET: BY PRODUCT TYPE, CAGR (2025-2032)
FIGURE 29 NORTH AMERICA COMPRESSION THERAPY MARKET: BY PRODUCT TYPE, LIFELINE CURVE
FIGURE 30 NORTH AMERICA COMPRESSION THERAPY MARKET: BY APPLICATION, 2024
FIGURE 31 NORTH AMERICA COMPRESSION THERAPY MARKET: BY APPLICATION, 2025 TO 2032 (USD THOUSAND)
FIGURE 32 NORTH AMERICA COMPRESSION THERAPY MARKET: BY APPLICATION, CAGR (2025-2032)
FIGURE 33 NORTH AMERICA COMPRESSION THERAPY MARKET: BY APPLICATION, LIFELINE CURVE
FIGURE 34 NORTH AMERICA COMPRESSION THERAPY MARKET: BY PATIENT GROUP, 2024
FIGURE 35 NORTH AMERICA COMPRESSION THERAPY MARKET: BY PATIENT GROUP, 2025 TO 2032 (USD THOUSAND)
FIGURE 36 NORTH AMERICA COMPRESSION THERAPY MARKET: BY PATIENT GROUP, CAGR (2025-2032)
FIGURE 37 NORTH AMERICA COMPRESSION THERAPY MARKET: BY PATIENT GROUP, LIFELINE CURVE
FIGURE 38 NORTH AMERICA COMPRESSION THERAPY MARKET: BY COMPRESSION LEVEL, 2024
FIGURE 39 NORTH AMERICA COMPRESSION THERAPY MARKET: BY COMPRESSION LEVEL, 2025 TO 2032 (USD THOUSAND)
FIGURE 40 NORTH AMERICA COMPRESSION THERAPY MARKET: BY COMPRESSION LEVEL, CAGR (2025-2032)
FIGURE 41 NORTH AMERICA COMPRESSION THERAPY MARKET: BY COMPRESSION LEVEL, LIFELINE CURVE
FIGURE 42 NORTH AMERICA COMPRESSION THERAPY MARKET: BY DISTRIBUTION CHANNELS, 2024
FIGURE 43 NORTH AMERICA COMPRESSION THERAPY MARKET: BY DISTRIBUTION CHANNELS, 2025 TO 2032 (USD THOUSAND)
FIGURE 44 NORTH AMERICA COMPRESSION THERAPY MARKET: BY DISTRIBUTION CHANNELS, CAGR (2025-2032)
FIGURE 45 NORTH AMERICA COMPRESSION THERAPY MARKET: BY DISTRIBUTION CHANNELS, LIFELINE CURVE
FIGURE 46 NORTH AMERICA COMPRESSION THERAPY MARKET: SNAPSHOT (2024)
FIGURE 47 NORTH AMERICA COMPRESSION THERAPY MARKET: COMPANY SHARE 2024 (%)
Data collection and base year analysis are done using data collection modules with large sample sizes. The stage includes obtaining market information or related data through various sources and strategies. It includes examining and planning all the data acquired from the past in advance. It likewise envelops the examination of information inconsistencies seen across different information sources. The market data is analysed and estimated using market statistical and coherent models. Also, market share analysis and key trend analysis are the major success factors in the market report. To know more, please request an analyst call or drop down your inquiry.
The key research methodology used by DBMR research team is data triangulation which involves data mining, analysis of the impact of data variables on the market and primary (industry expert) validation. Data models include Vendor Positioning Grid, Market Time Line Analysis, Market Overview and Guide, Company Positioning Grid, Patent Analysis, Pricing Analysis, Company Market Share Analysis, Standards of Measurement, Global versus Regional and Vendor Share Analysis. To know more about the research methodology, drop in an inquiry to speak to our industry experts.
Data Bridge Market Research is a leader in advanced formative research. We take pride in servicing our existing and new customers with data and analysis that match and suits their goal. The report can be customized to include price trend analysis of target brands understanding the market for additional countries (ask for the list of countries), clinical trial results data, literature review, refurbished market and product base analysis. Market analysis of target competitors can be analyzed from technology-based analysis to market portfolio strategies. We can add as many competitors that you require data about in the format and data style you are looking for. Our team of analysts can also provide you data in crude raw excel files pivot tables (Fact book) or can assist you in creating presentations from the data sets available in the report.


