
North America Computer Vision Market
Market Size in USD Billion
 USD
3.69 Billion
USD
5.84 Billion
2025
2033
USD
3.69 Billion
USD
5.84 Billion
2025
2033
| 2026 - 2033 | |
| USD 3.69 Billion | |
| USD 5.84 Billion | |
| % | |
|
North America Computer Vision Market Size
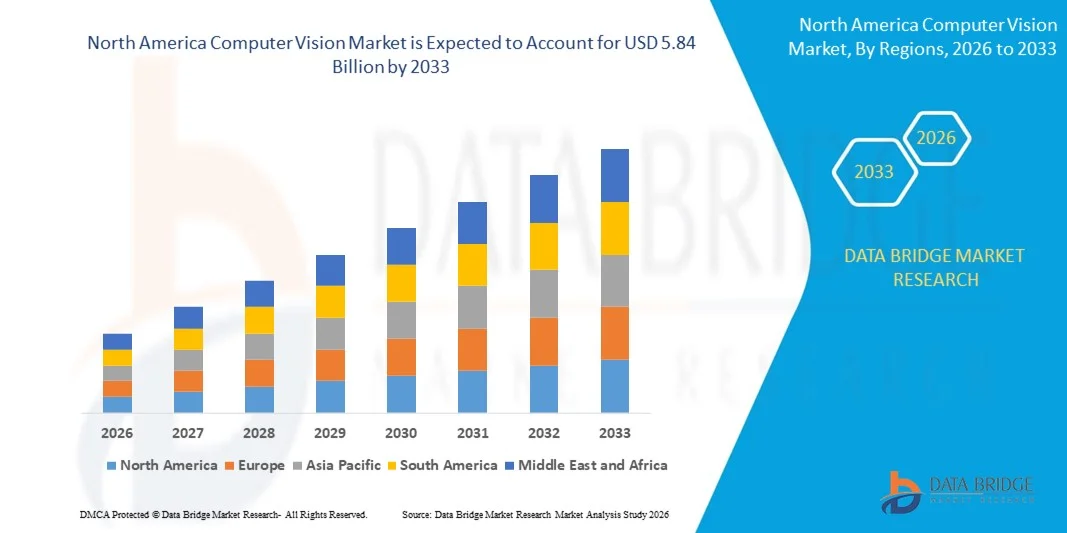
- The North America computer vision market size was valued at USD 3.69 billion in 2025 and is expected to reach USD 5.84 billion by 2033, at a CAGR of 5.90% during the forecast period
- The market growth is largely fuelled by the increasing adoption of artificial intelligence and deep learning technologies to enable automated visual inspection, object detection, and real-time decision-making
- The rising demand for automation to improve operational efficiency, reduce human error, and enhance productivity across industries such as manufacturing, healthcare, and retail is further accelerating market expansion
North America Computer Vision Market Analysis
- The market is witnessing strong momentum driven by the increasing integration of computer vision with advanced AI models, enabling more accurate image recognition, predictive analytics, and intelligent automation
- Organizations are increasingly investing in computer vision solutions to enhance quality control, improve safety, and optimize business processes, which is accelerating technology adoption
- U.S. dominated the computer vision market with the largest revenue share in 2025, driven by the strong presence of leading technology companies and increasing adoption of AI-powered automation solutions
- Canada is expected to witness the highest compound annual growth rate (CAGR) in the North America computer vision market due to increasing government support for AI innovation, growing adoption of advanced analytics technologies, and rising implementation of computer vision solutions across enterprise and industrial applications
- The Hardware segment held the largest market revenue share in 2025 driven by the increasing deployment of cameras, sensors, processors, and edge devices required for image capture and processing. Hardware components form the foundation of computer vision systems, enabling real-time data acquisition and analysis, making them essential for industrial automation and intelligent monitoring applications
Report Scope and North America Computer Vision Market Segmentation
|
Attributes |
North America Computer Vision Key Market Insights |
|
Segments Covered |
|
|
Countries Covered |
North America
|
|
Key Market Players |
|
|
Market Opportunities |
|
|
Value Added Data Infosets |
In addition to the insights on market scenarios such as market value, growth rate, segmentation, geographical coverage, and major players, the market reports curated by the Data Bridge Market Research also include in-depth expert analysis, geographically represented company-wise production and capacity, network layouts of distributors and partners, detailed and updated price trend analysis and deficit analysis of supply chain and demand. |
North America Computer Vision Market Trends
Integration of Computer Vision With Advanced AI and Deep Learning
- The rapid advancement of artificial intelligence and deep learning technologies is significantly shaping the computer vision market, as organizations increasingly adopt intelligent visual recognition systems to automate analysis and decision-making. Computer vision solutions are gaining traction due to their ability to deliver high accuracy in object detection, facial recognition, and pattern analysis, strengthening their adoption across industries such as manufacturing, healthcare, automotive, and retail and encouraging continuous innovation in AI-powered vision models
- Increasing demand for automation, quality inspection, and real-time monitoring has accelerated the adoption of computer vision across industrial and commercial environments. Businesses are actively deploying computer vision to enhance productivity, reduce operational errors, and improve safety and compliance. This trend has also led to collaborations between technology providers and enterprises to develop customized and scalable computer vision solutions that improve operational efficiency and business intelligence
- The growing availability of large visual datasets and improvements in computing power are influencing purchasing decisions, with organizations emphasizing high-performance processing, scalable deployment, and seamless integration with existing digital infrastructure. These factors are helping companies enhance operational visibility and gain competitive advantages, while also driving investments in AI infrastructure and advanced analytics capabilities. Companies are increasingly promoting these capabilities through strategic partnerships and product launches to strengthen their market presence and customer value proposition
- For instance, in 2024, Microsoft and NVIDIA expanded their AI vision platforms by introducing enhanced computer vision tools integrated with deep learning and edge computing capabilities. These solutions were launched to support automated inspection, intelligent surveillance, and real-time analytics across enterprise environments. The platforms were also positioned as scalable and efficient solutions, strengthening customer adoption and long-term engagement
- While adoption of computer vision is increasing, sustained market expansion depends on continuous advancements in algorithm accuracy, cost optimization, and efficient deployment models. Companies are focusing on improving processing speed, reducing hardware dependency, and enhancing model reliability to ensure broader adoption and long-term scalability across industries
North America Computer Vision Market Dynamics
Driver
Growing Adoption of AI-Powered Automation and Intelligent Analytics
- Increasing enterprise demand for automation and intelligent analytics is a major driver for the computer vision market. Organizations are actively deploying computer vision to automate inspection, monitor operations, and improve decision-making accuracy. This trend is also encouraging research and development into advanced AI models that enhance recognition capabilities and support new application areas
- Expanding use of computer vision in applications such as predictive maintenance, quality assurance, and autonomous operations is influencing market growth. Computer vision enables real-time monitoring and precise analysis, helping organizations improve efficiency and reduce operational risks while supporting digital transformation initiatives
- Technology providers and enterprises are actively promoting computer vision solutions through product innovation, platform integration, and strategic collaborations. These efforts are supported by the growing focus on operational efficiency, cost reduction, and intelligent automation, and they also encourage partnerships between AI developers and end users to enhance system performance and scalability
- For instance, in 2023, IBM and Google increased their focus on AI vision technologies by introducing advanced visual inspection and analytics solutions integrated into their AI platforms. This expansion was driven by rising enterprise demand for automation and intelligent monitoring, improving operational efficiency and strengthening customer adoption. Both companies also emphasized scalability and performance improvements to enhance customer satisfaction and long-term value
- Although increasing automation supports market growth, widespread adoption depends on improving affordability, simplifying deployment, and ensuring seamless integration with existing enterprise systems. Continued investment in AI research, infrastructure, and user-friendly platforms will be essential for sustaining long-term market expansion
Restraint/Challenge
High Implementation Cost and Data Privacy Concerns
- The high cost of implementing computer vision systems remains a key challenge, limiting adoption among small and medium-sized organizations. Expenses related to hardware, software development, and system integration contribute to overall implementation costs. In addition, ongoing maintenance and upgrades further increase operational expenditure, affecting adoption rates
- Data privacy and security concerns also restrict market growth, particularly in applications involving facial recognition and surveillance. Organizations must comply with strict data protection regulations and ensure secure data handling, which increases complexity and deployment time. This also creates hesitation among enterprises when adopting computer vision technologies for sensitive applications
- Technical complexity and the requirement for skilled professionals also impact adoption, as computer vision systems require expertise in AI, data science, and system integration. Limited availability of skilled personnel can delay implementation timelines and increase operational costs. Companies must invest in training, talent acquisition, and technical support to ensure successful deployment
- For instance, in 2024, Amazon and Intel reported challenges among enterprise customers related to deployment costs, system integration complexity, and data security compliance when implementing computer vision solutions. These factors affected adoption timelines and increased total cost of ownership, prompting organizations to evaluate deployment strategies more carefully
- Overcoming these challenges will require cost-efficient technologies, secure data management frameworks, and simplified deployment models. Collaboration between technology providers, enterprises, and regulatory bodies can help unlock the long-term growth potential of the global computer vision market. Furthermore, improving affordability, enhancing privacy protection, and developing user-friendly platforms will be essential for widespread adoption
North America Computer Vision Market Scope
The market is segmented on the basis of component, application, vertical, and product.
- By Component
On the basis of component, the North America computer vision market is segmented into Hardware and Software. The Hardware segment held the largest market revenue share in 2025 driven by the increasing deployment of cameras, sensors, processors, and edge devices required for image capture and processing. Hardware components form the foundation of computer vision systems, enabling real-time data acquisition and analysis, making them essential for industrial automation and intelligent monitoring applications.
The Software segment is expected to witness the fastest growth rate from 2026 to 2033, driven by the rising adoption of AI-based vision algorithms and analytics platforms that enable advanced image processing, object recognition, and predictive insights. Software solutions provide flexibility, scalability, and integration with enterprise systems, making them increasingly important as organizations focus on intelligent automation and data-driven decision-making.
- By Application
On the basis of application, the North America computer vision market is segmented into Predictive Maintenance, Identification, Positioning & Guidance, and Quality Assurance & Inspection. The Quality Assurance & Inspection segment held the largest market revenue share in 2025 driven by the growing need for automated inspection systems to improve product quality, reduce defects, and enhance operational efficiency. Computer vision systems enable accurate and consistent inspection, helping organizations minimize human error and ensure compliance with quality standards.
The Predictive Maintenance segment is expected to witness the fastest growth rate from 2026 to 2033, driven by the increasing demand for early detection of equipment faults and performance issues. Computer vision enables continuous monitoring and analysis of machinery conditions, helping organizations reduce downtime, extend equipment lifespan, and improve overall operational reliability.
- By Vertical
On the basis of vertical, the North America computer vision market is segmented into Industrial Vertical and Non-industrial Vertical. The Industrial Vertical segment held the largest market revenue share in 2025 driven by the widespread adoption of computer vision for automation, inspection, and process optimization. Industries are increasingly using computer vision to improve productivity, enhance safety, and maintain consistent production quality, supporting digital transformation initiatives.
The Non-industrial Vertical segment is expected to witness the fastest growth rate from 2026 to 2033, driven by the growing adoption of computer vision in applications such as healthcare imaging, intelligent surveillance, and retail analytics. Increasing demand for automation and real-time visual analysis in service-based industries is contributing to segment growth.
- By Product
On the basis of product, the North America computer vision market is segmented into Smart Camera-based Computer Vision Systems and PC-based Computer Vision Systems. The PC-based Computer Vision Systems segment held the largest market revenue share in 2025 driven by their high processing power, flexibility, and ability to handle complex vision tasks. These systems are widely used in applications requiring advanced analytics, customization, and integration with multiple devices.
The Smart Camera-based Computer Vision Systems segment is expected to witness the fastest growth rate from 2026 to 2033, driven by their compact design, ease of deployment, and integrated processing capabilities. Smart cameras enable real-time image processing without the need for external computing systems, making them suitable for modern automated and edge-based vision applications.
North America Computer Vision Market Regional Analysis
- The U.S. dominated the computer vision market with the largest revenue share in 2025, driven by the strong presence of leading technology companies and increasing adoption of AI-powered automation solutions
- Enterprises in the country highly value the efficiency, scalability, and advanced analytics capabilities offered by computer vision systems, encouraging widespread deployment across multiple industries
- This strong adoption is further supported by high technology investment, advanced IT infrastructure, and growing demand for intelligent automation and real-time data analysis, establishing computer vision as a key technology in digital transformation initiatives
Canada Computer Vision Market Insight
The Canada computer vision market is expected to witness the fastest growth rate from 2026 to 2033, fueled by increasing investment in artificial intelligence and rising adoption of automation technologies. Organizations are actively adopting computer vision to enhance productivity, improve monitoring capabilities, and support intelligent decision-making. The growing focus on innovation, supported by expanding AI research and increasing implementation of advanced analytics solutions, is further accelerating market expansion. In addition, the rising integration of computer vision in enterprise and industrial applications is contributing significantly to market growth.
North America Computer Vision Market Share
The North America computer vision industry is primarily led by well-established companies, including:
- NVIDIA Corporation (U.S.)
- Intel Corporation (U.S.)
- Microsoft Corporation (U.S.)
- International Business Machines Corporation (U.S.)
- Cognex Corporation (U.S.)
- Qualcomm Incorporated (U.S.)
- Advanced Micro Devices, Inc. (U.S.)
- Matterport, Inc. (U.S.)
- Ambarella, Inc. (U.S.)
- Lumentum Holdings Inc. (U.S.)
- Teledyne Technologies Incorporated (U.S.)
- FLIR Systems, Inc. (U.S.)
- OpenText Corporation (Canada)
- Kinaxis Inc. (Canada)
- Vecna Robotics, Inc. (U.S.)
SKU-

- Interactive Data Analysis Dashboard
- Company Analysis Dashboard for high growth potential opportunities
- Research Analyst Access for customization & queries
- Competitor Analysis with Interactive dashboard
- Latest News, Updates & Trend analysis
- Harness the Power of Benchmark Analysis for Comprehensive Competitor Tracking
North America Computer Vision Market, Supply Chain Analysis and Ecosystem Framework
To support market growth and help clients navigate the impact of geopolitical shifts, DBMR has integrated in-depth supply chain analysis into its North America Computer Vision Market research reports. This addition empowers clients to respond effectively to global changes affecting their industries. The supply chain analysis section includes detailed insights such as North America Computer Vision Market consumption and production by country, price trend analysis, the impact of tariffs and geopolitical developments, and import and export trends by country and HSN code. It also highlights major suppliers with data on production capacity and company profiles, as well as key importers and exporters. In addition to research, DBMR offers specialized supply chain consulting services backed by over a decade of experience, providing solutions like supplier discovery, supplier risk assessment, price trend analysis, impact evaluation of inflation and trade route changes, and comprehensive market trend analysis.
Data collection and base year analysis are done using data collection modules with large sample sizes. The stage includes obtaining market information or related data through various sources and strategies. It includes examining and planning all the data acquired from the past in advance. It likewise envelops the examination of information inconsistencies seen across different information sources. The market data is analysed and estimated using market statistical and coherent models. Also, market share analysis and key trend analysis are the major success factors in the market report. To know more, please request an analyst call or drop down your inquiry.
The key research methodology used by DBMR research team is data triangulation which involves data mining, analysis of the impact of data variables on the market and primary (industry expert) validation. Data models include Vendor Positioning Grid, Market Time Line Analysis, Market Overview and Guide, Company Positioning Grid, Patent Analysis, Pricing Analysis, Company Market Share Analysis, Standards of Measurement, Global versus Regional and Vendor Share Analysis. To know more about the research methodology, drop in an inquiry to speak to our industry experts.
Data Bridge Market Research is a leader in advanced formative research. We take pride in servicing our existing and new customers with data and analysis that match and suits their goal. The report can be customized to include price trend analysis of target brands understanding the market for additional countries (ask for the list of countries), clinical trial results data, literature review, refurbished market and product base analysis. Market analysis of target competitors can be analyzed from technology-based analysis to market portfolio strategies. We can add as many competitors that you require data about in the format and data style you are looking for. Our team of analysts can also provide you data in crude raw excel files pivot tables (Fact book) or can assist you in creating presentations from the data sets available in the report.


