
North America Copper Busbar Market
Market Size in USD Billion
 USD
4.64 Billion
USD
7.46 Billion
2024
2032
USD
4.64 Billion
USD
7.46 Billion
2024
2032
| 2025 - 2032 | |
| USD 4.64 Billion | |
| USD 7.46 Billion | |
| % | |
|
North America Copper Busbar Market Size
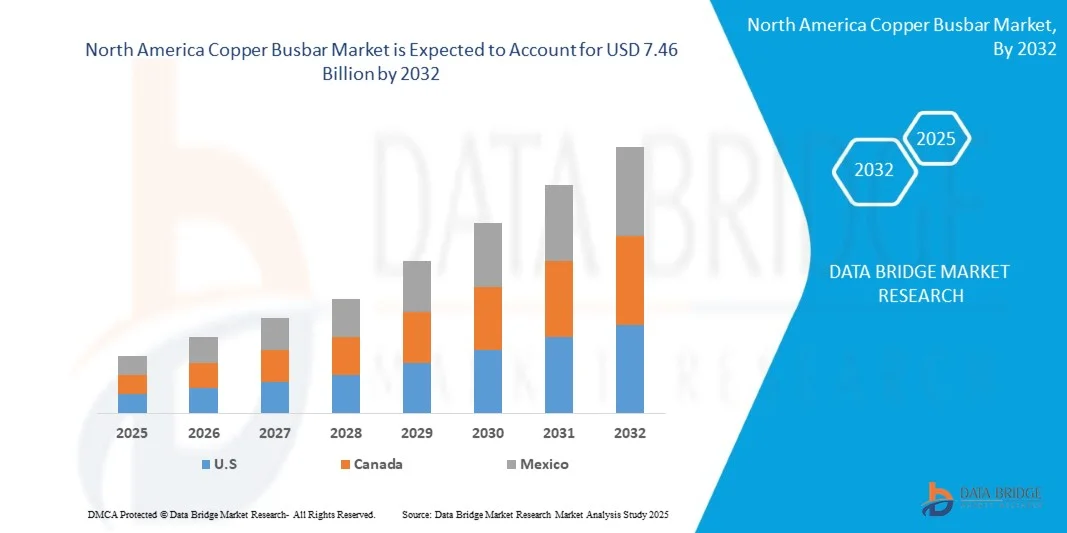
- North America copper busbar market is expected to reach USD 7.46 billion by 2032 from USD 4.64 billion in 2024, growing with a CAGR of 6.3% in the forecast period of 2025 to 2032.
- The North America copper busbar market is experiencing significant growth, driven by increasing demand for efficient power distribution in various sectors, including transmission and distribution utilities, industrial, commercial, and residential applications.
North America Copper Busbar Market Analysis
- The region's focus on upgrading aging electrical infrastructure and the transition to renewable energy sources are further propelling the market. The adoption of advanced technologies, such as smart grids and energy-efficient systems, is also contributing to the rising need for reliable and high-performance busbar solutions, reinforcing copper's dominant position due to its superior electrical conductivity and thermal management properties.
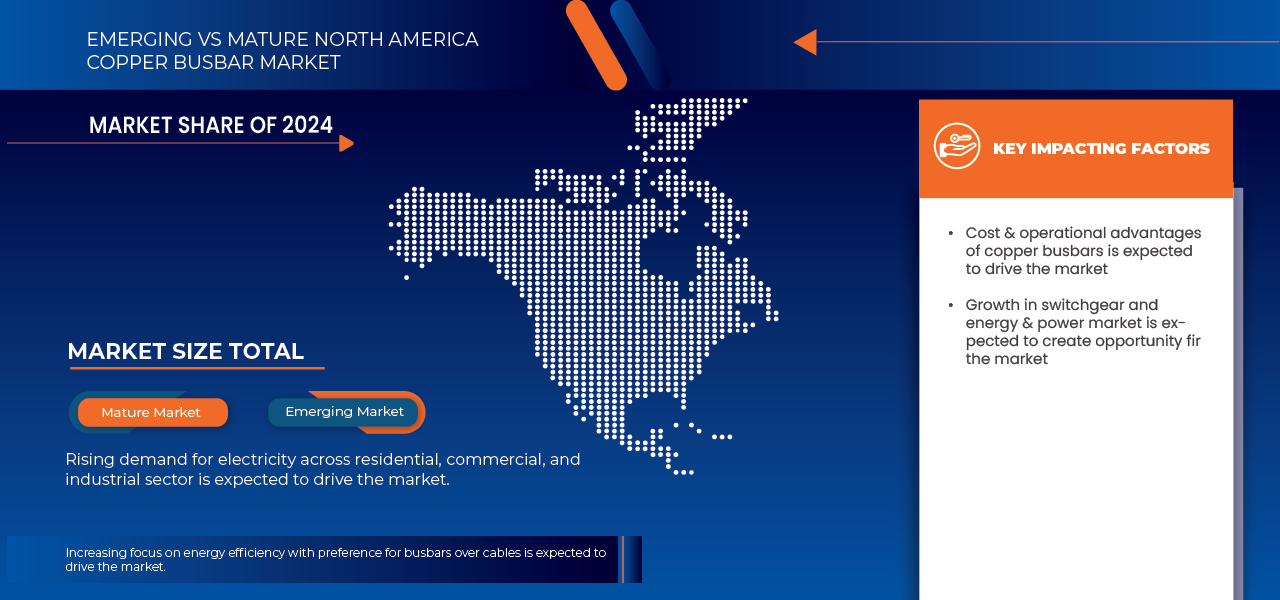
- The increase in focus on energy efficiency with a preference for busbars over cables is expected to drive the overall growth of the market. The fluctuation in raw material prices, especially copper, is expected to restrain the North America copper busbar market.
- The U.S. is expected to be the dominant and fastest-growing country in the North America copper busbar market, holding the largest market share of 72.48% in 2025, due to the presence of major end-use industries, ongoing infrastructure modernization, increased demand for renewable energy integration, and strong investments in power transmission and distribution networks
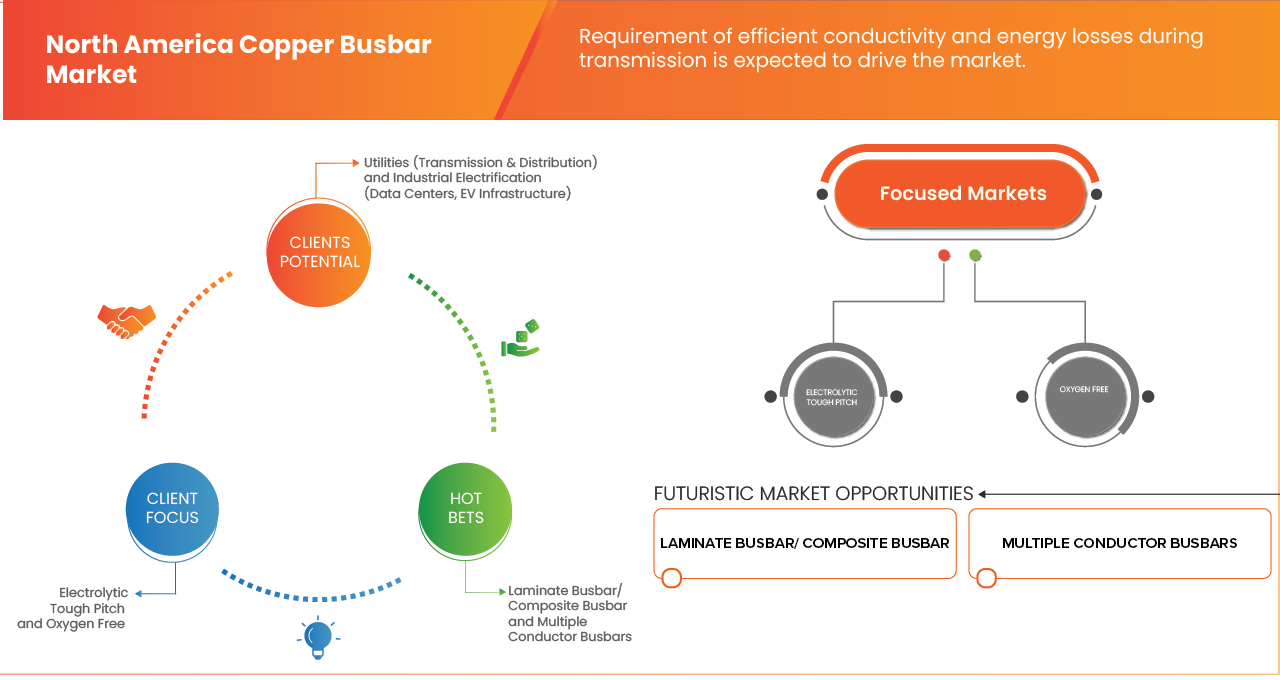
- On the basis of type, the North America copper busbar market is segmented into electrolytic tough pitch, oxygen free, and DHP / DLP. In 2025, the electrolytic tough pitch segment is expected to dominate the market with the market share of 50.28% due to its superior electrical conductivity and cost-effectiveness compared to oxygen-free and DHP/DLP segments, making it ideal for high-efficiency power distribution applications. Additionally, its widespread availability and suitability for standard industrial applications further boost its demand.
- On the basis of sales channel, the North America copper busbar market is segmented into direct channel, and indirect channel. In 2025, direct channel is expected to dominate the market because it allows manufacturers to directly supply copper busbars to end-users, offering better control over pricing, customization, and customer relationships. This streamlined approach reduces intermediaries, leading to improved cost efficiency and faster delivery times.
Report Scope and North America Copper Busbar Market Segmentation
|
Attributes |
North America Copper Busbar Market Key Market Insights |
|
Segments Covered |
|
|
Countries Covered |
|
|
Key Market Players |
|
|
Market Opportunities |
|
|
Value Added Data Infosets |
In addition to the insights on market scenarios such as market value, growth rate, segmentation, geographical coverage, and major players, the market reports curated by the Data Bridge Market Research also include in-depth expert analysis, geographically represented company-wise production and capacity, network layouts of distributors and partners, detailed and updated price trend analysis and deficit analysis of supply chain and demand. |
North America Copper Busbar Market Trends
“Strong shift toward modernization and upgrading of power distribution infrastructure”
- Increasing integration of renewable energy sources like solar and wind requires flexible, resilient grid systems to manage intermittent power supply
- Expansion of Distributed Energy Resources (DERs) and electrification of industries necessitate bidirectional power flow and smart grid upgrades
- Investment in energy storage and grid-scale batteries supports balancing supply and demand, enabling renewable integration
- Efforts focus on strengthening grid resilience against extreme weather, cyber threats, and aging equipment
- Modernization prioritizes demand flexibility, grid optimization, and energy exchange to ensure affordable, reliable, and sustainable power delivery
North America Copper Busbar Market Dynamics
Drivers
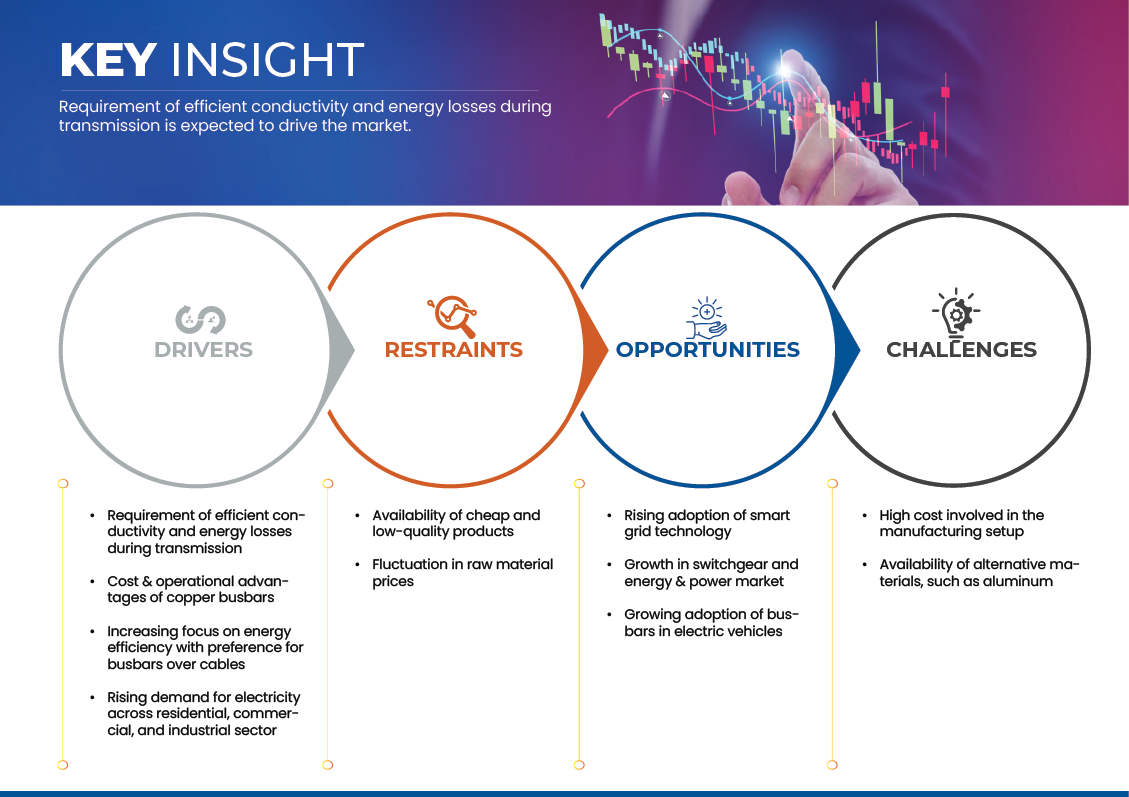
“Requirement of Efficient Conductivity and Energy Losses During Transmission”
- There is a wide usage of power applications that relies on busbars to provide critical interfaces between the power modules. This holds true even as the power, motor, industrial, and automotive industries have evolved over the last few decades. Power modules used for inversion or conversion must become more efficient as industries move toward more electrification in transportation, mobility, and renewable energy. Busing power into and out of the power inversion circuit becomes a critical element that must be incorporated into the overall system design to maximize efficiency.
- Copper busbars are used within electrical installations for distributing power from a supply point to a number of output circuits. They may be used in a variety of configurations ranging from vertical risers, carrying current to each floor of a multi-storey building, to bars used entirely within a distribution panel or within an industrial process. The power distribution based on copper busbar systems are used on large scale and have been accepted more and more due to their flexibility, safety and ability to reduce overall design and integration costs in industrial systems. Moreover, the globalization has prompted industrial control engineers to choose design techniques, electrical components, and industrial integration methods worldwide, based on increasingly complex busbar systems.
- Power modules used for inversion or conversion must become more efficient as industries moving toward more electrification in transportation, mobility, and renewable energy. Moving power into and out of the power inversion circuit becomes a critical element that must be incorporated into the overall system design to maximize efficiency.
- For instance, in January 2025, Natural Resources Canada published updated commentary on copper’s strategic role in electrification and clean-energy infrastructure, noting that the energy transition is expected to increase copper demand because of its essential role in electricity networks and associated hardware.
- Efficient conductivity and minimized energy losses during power transmission are critical requirements as industries increasingly adopt electrification in transportation, mobility, and renewable energy. Copper busbars play a pivotal role in ensuring reliable power distribution due to their high conductivity, flexibility, safety, and cost-effectiveness in industrial and commercial systems. The growing complexity of busbar designs, driven by globalization and advanced industrial integration, underscores their strategic importance.
Opportunities
Rising Adoption of Smart Grid Technology
- The increasing adoption of smart grid technology presents a significant growth opportunity for the North America copper busbar market. Smart grids integrate advanced information and communication technologies across electricity generation, distribution, and consumption, optimizing efficiency, reducing environmental impacts, and enhancing overall reliability. The use of copper busbars in these systems is essential due to copper’s superior electrical conductivity, durability, and resistance to corrosion, making it ideal for handling high currents in power distribution networks.
- Key smart grid components, such as Advanced Metering Infrastructure (AMI), Demand Response (DR), and Plug-in Hybrid Electric Vehicles (PHEV), rely heavily on high-performance copper busbars for efficient energy transmission. AMI systems, which enable real-time communication between consumers and utilities, benefit from copper’s reliability in ensuring consistent power flow. As smart cities and energy-saving initiatives expand, the role of copper busbars in supporting these networks becomes increasingly critical.
- For instance, in August 2024, as reported by Synergy BV, the U.S. power sector underwent a major transformation, driven by decarbonization goals and investments in renewable energy and grid modernization. Utility-scale solar, wind, battery storage, and behind-the-meter distributed energy resources like rooftop solar and residential storage expanded. This shift is expected to boost the demand for copper busbars, essential for efficient power distribution in renewable energy systems
- With the push towards reducing greenhouse gas emissions and adopting cleaner energy sources such as wind, solar, and hydropower, smart grid technology will continue to grow. This growth drives demand for copper busbars in infrastructure, supporting not only energy conservation but also the future electrification of transportation and heating systems. Consequently, the expanding adoption of smart grids is poised to create more opportunities in the copper busbar market for the North America region.
Restraints/ Challenges
Availability of Cheap and Low Quality Products
- The rising competition and stiffness in the market have welcomed many manufacturer and companies that are involving in the copper busbar products. There are many manufacturers that has played an important role in the development of products. As a result, there has been a constant degradation in the quality of material. The manufacturers are making low quality products with less requirement of basic raw material. The companies are investing heavily in product manufacturing with low quality products and raw materials have reduced the overall supply with cheap material used and overall declining the cost price of the products.
- For instance, in July 2025, article published in supply chain connect stated that industry supply-chain commentary noted that procurement teams continue to encounter fake or low-quality components, stating that “fake and conforming parts continue to flood the market
- The increasing availability of cheap and low-quality copper busbar products has emerged as a significant challenge within the market. Intense competition and the entry of numerous manufacturers have led to a decline in product standards, as some companies prioritize cost reduction over quality by using inferior raw materials and simplified production processes.
North America Copper Busbar Market Scope
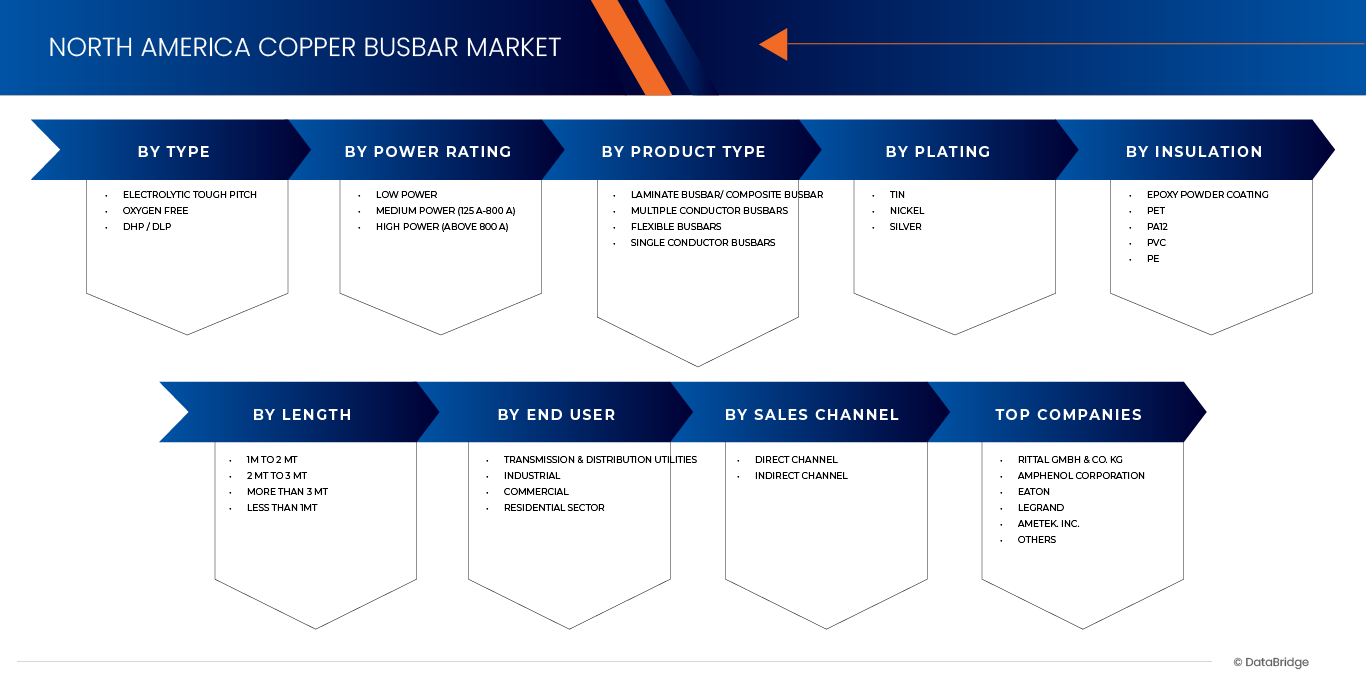
North America copper busbar market is segmented into eight notable segments based on the type, power rating, product type, plating, insulation, length, end-user, and sales channel.
• By Type
On the basis of type, North America copper busbar market is segmented into electrolytic tough pitch, oxygen free and DHP / DLP. In 2025, electrolytic tough pitch segment is expected to dominate the North America copper busbar market with 50.28% market share due to its superior electrical conductivity, durability, and cost-effectiveness.
Electrolytic tough pitch segment in North America copper busbar market is expected to grow with a CAGR of 6.6% in the forecast period of 2025 to 2032 due to the expansion of smart grid and renewable energy infrastructure.
• By Power Rating
On the basis of power rating, North America copper busbar market is segmented low power, medium power (125 A-800 A), and high power (above 800 A). In 2025, low power segment is expected to dominate North America copper busbar market with 47.60% market share due to its ability to offer advantages like reduced space requirements and easier installation compared to traditional wiring systems.
Low power segment in North America copper busbar market is expected to grow with the CAGR of 6.6% in the forecast period of 2025 to 2032 due to increasing demand for efficient and compact power distribution solutions in residential, commercial, and light industrial applications.
• By Product Type
On the basis of product type, North America copper busbar market is segmented laminate busbar/ composite busbar, multiple conductor busbars, flexible busbars and single conductor busbars. In 2025, laminate busbar/ composite busbar segment is expected to dominate the North America copper busbar market with 48.90% market share due to its superior advantages over traditional busbars. Laminated busbars offer enhanced performance attributes such as excellent corrosion resistance, high temperature tolerance, and exceptional electrical conductivity, which makes them highly reliable and efficient for power distribution.
Laminate busbar/ composite busbar segment in North America copper busbar market is expected to grow with the CAGR of 6.6% in the forecast period of 2025 to 2032 due to its advantages in energy efficiency, lightweight design, and superior thermal and electrical performance. .
• By Plating
On the basis of plating, North America copper busbar market is segmented into tin, nickel, and silver. In 2025, tin segment is expected to dominate North America copper busbar market with 47.24% market share due to its ability to offers excellent corrosion resistance and enhances the surface conductivity of copper busbars.
Tin segment in North America copper busbar market is expected to grow with the CAGR of 6.7% in the forecast period of 2025 to 2032 due to its excellent combination of corrosion resistance, electrical conductivity, and thermal stability.
• By Insulation
On the basis of insulation, the North America copper busbar market is segmented into epoxy powder coating, PET, PA12, PVC and PE. In 2025, the epoxy powder coating segment is expected to dominate North America copper busbar market with 40.80% market share, owing to rising adoption of renewable energy systems, increasing industrial automation, and expansion of electric vehicle infrastructure.
Epoxy powder coating segment in North America copper busbar market is expected to grow with a CAGR of 6.8% in the forecast period of 2025 to 2032 due to increasing demand for superior electrical insulation, corrosion resistance, and mechanical strength that epoxy powder coatings provide to copper busbars.
• By Length
On the basis of length, North America copper busbar market is segmented into Less than 1mt, 1m to 2 mt, 2 mt to 3 mt, More than 3 mt. In 2025, 1m to 2 mt segment is expected to dominate North America copper busbar market with 42.52% market share due to its optimal balance of size, capacity, and versatility.
1m to 2 mt segment in North America copper busbar market is expected to grow with the CAGR of 6.9% in the forecast period of 2025 to 2032 due to increasing demand for standardized and versatile copper busbars that fit a wide range of industrial and commercial applications.
• By End User
On the basis of end user, North America copper busbar market is segmented into transmission & distribution utilities, industrial, commercial, residential sector. In 2025, transmission & distribution utilities segment is expected to dominate North America copper busbar market with 40.48% market share as it plays critical role in upgrading and expanding the power grid infrastructure.
Transmission & distribution utilities segment in North America copper busbar market is expected to grow with the CAGR of 6.9% in the forecast period of 2025 to 2032 due to rising adoption of renewable energy sources such as wind and solar power.
- By Sales Channel
On the basis of sales channel, North America copper busbar market is segmented into direct channel, indirect channel. In 2025, direct channel segment is expected to dominate North America copper busbar market with 74.30% market share as it reduces intermediaries, optimizing cost efficiency, improving supply chain reliability, and ensuring timely delivery.
Direct channel coating segment in North America copper busbar market is expected to grow with a CAGR of 6.3% in the forecast period of 2025 to 2032 due to its efficiency and convenience in distributing coated copper busbars directly from manufacturers or suppliers to end users.
North America Copper Busbar Market Regional Analysis
- North America copper busbar market comprises of the countries - U.S., Canada, and Mexico. U.S. is the highest growing country in the North America copper busbar market
- Requirement of efficient conductivity and energy losses during transmission, cost & operational advantages of copper busbars, increasing focus on energy efficiency with preference for busbars over cables, rising demand for electricity across residential, commercial, and industrial sectors are driving the market growth.
U.S. North America Copper Busbar Market Insight
The market in U.S. is projected to expand at a substantial CAGR of 6.6%. The demand for copper busbars in the US is increasing primarily due to the growing need for efficient, safe, and compact power distribution systems across multiple sectors, including commercial, industrial, and utility applications.
Canada North America Copper Busbar Market Insight
The market in Canada is projected to expand at a substantial CAGR of 5.5%. The demand for copper busbars in Canada is increasing due to several key factors. Primarily, the growing focus on renewable energy projects, including solar and wind farms, necessitates efficient and reliable power distribution systems where copper busbars are essential because of their superior conductivity and durability.
Mexico North America Copper Busbar Market Insight
The market in Mexico is projected to expand at a substantial CAGR of 5.0%. The demand for copper busbars in Mexico is increasing primarily due to the growing need for reliable and efficient electrical power distribution systems across multiple sectors such as industrial, commercial, and residential.
North America Copper Busbar Market Share
The North America copper busbar market is primarily led by well-established companies, including:
- American Elements (U.S.)
- SPF America (U.S.)
- Watteredge LLC (U.S.)
- Zhejiang RHI Electric Co.,Ltd (China)
- Fanshun Machinery (China)
- Hubbell (U.S.)
- Lantric Technologies Inc. (U.S.)
- CAPLINQ Corporation (Netherlands)
- Siemens (Germany)
- Mersen Property (France)
- ABB (Switzerland)
- EG Electronics (U.S.)
- Legrand (France)
- Eaton (U.S.)
- AMETEK, Inc. (U.S.)
- Ennovi Holdings Pte. Ltd. (Interplex Holdings) (Singapore)
- Schneider Electric (France)
- Rogers Corporation (U.S.)
- Rittal GmbH & Co. KG (Germany)
- Amphenol Corporation (U.S.)
- MOLEX LLC (U.S.)
Latest Developments in the North America Copper Busbar Market
- In March 2022, Amphenol Corporation announced the launch of high power and low-resistance 3.00 MM busbar connector. The connector is used in an integrated guide system. The connector ensures ultra-low contact resistance and overall improved energy efficiency. This will help the company expand its product portfolio with enhanced products for customers.
- In August 2025, Amphenol Corporation announced a definitive agreement to acquire Trexon for approximately USD1 billion in cash to deliver additional high-technology solutions to customers.
- In May 2025, Lenze and Rittal signed a technology partnership to work together to shape the future of power distribution and drive technology. The combination of RiLineX, as the new standard platform for busbar systems, and Lenze’s market-leading compact inverters provides the basis.
- In February 2022, Rittal GmbH & Co. KG got awarded by the LANline readers as “2021 Supplier of the Year”. This was the fifth time that the company was awarded for this, and through this, the company is aiming to promote its product portfolio in order to boost sales in the copper busbar market.
- In August 2025, Amphenol Corporation announced a definitive agreement to acquire Trexon for approximately USD1 billion in cash to deliver additional high-technology solutions to customers.
- In May 2025, Eaton announced the expansion of its Orchard Park, N.Y., facility to support growing demand for the aerospace mission systems solutions manufactured at the site. The USD18.5 million investment will significantly increase production capacity to serve growing demand by military defense, commercial aerospace, and space customers.
SKU-

- Interactive Data Analysis Dashboard
- Company Analysis Dashboard for high growth potential opportunities
- Research Analyst Access for customization & queries
- Competitor Analysis with Interactive dashboard
- Latest News, Updates & Trend analysis
- Harness the Power of Benchmark Analysis for Comprehensive Competitor Tracking
Table of Content
1 INTRODUCTION
1.1 OBJECTIVES OF THE STUDY
1.2 MARKET DEFINITION
1.3 OVERVIEW OF NORTH AMERICA COPPER BUSBAR MARKET
1.4 CURRENCY AND PRICING
1.5 LIMITATIONS
1.6 MARKETS COVERED
2 MARKET SEGMENTATION
2.1 MARKETS COVERED
2.2 GEOGRAPHICAL SCOPE
2.3 YEARS CONSIDERED FOR THE STUDY
2.4 DBMR TRIPOD DATA VALIDATION MODEL
2.5 PRIMARY INTERVIEWS WITH KEY OPINION LEADERS
2.6 DBMR MARKET POSITION GRID
2.7 VENDOR SHARE ANALYSIS
2.8 MULTIVARIATE MODELING
2.9 TYPE TIMELINE CURVE
2.1 MARKET END USER COVERAGE GRID
2.11 SECONDARY SOURCES
2.12 ASSUMPTIONS
3 EXECUTIVE SUMMARY
4 PREMIUM INSIGHTS
4.1 PORTER’S FIVE FORCE ANALYSIS
4.2 REGULATORY FRAMEWORK
4.3 VALUE CHAIN ANALYSIS
4.4 COMPANY COMPARATIVE ANALYSIS
4.5 IMPORT-EXPORT DATA
4.6 PATENT ANALYSIS
4.7 TECHNOLOGICAL TRENDS
4.8 IMPORT-EXPORT DATA
5 MARKET OVERVIEW
5.1 DRIVERS
5.1.1 REQUIREMENT OF EFFICIENT CONDUCTIVITY AND ENERGY LOSSES DURING TRANSMISSION
5.1.2 COST & OPERATIONAL ADVANTAGES OF COPPER BUSBARS
5.1.3 INCREASING FOCUS ON ENERGY EFFICIENCY WITH PREFERENCE FOR BUSBARS OVER CABLES
5.1.4 RISING DEMAND FOR ELECTRICITY ACROSS RESIDENTIAL, COMMERCIAL, AND INDUSTRIAL SECTOR
5.2 RESTRAINTS
5.2.1 AVAILABILITY OF CHEAP AND LOW QUALITY PRODUCTS
5.2.2 FLUCTUATION IN RAW MATERIAL PRICES
5.3 OPPORTUNITY
5.3.1 RISING ADOPTION OF SMART GRID TECHNOLOGY
5.3.2 GROWTH IN SWITCHGEAR AND ENERGY & POWER MARKET
5.3.3 GROWING ADOPTION OF BUSBARS IN ELECTRIC VEHICLES
5.4 CHALLENGES
5.4.1 HIGH COST INVOLVED IN THE MANUFACTURING SETUP
5.4.2 AVAILABILITY OF ALTERNATIVE MATERIALS, SUCH AS ALUMINUM
6 NORTH AMERICA COPPER BUSBAR MARKET, BY TYPE
6.1 OVERVIEW
6.2 ELECTROLYTIC TOUGH PITCH
6.3 OXYGEN FREE
6.4 DHP / DLP
7 NORTH AMERICA COPPER BUSBAR MARKET, BY POWER RATING
7.1 OVERVIEW
7.2 LOW POWER
7.2.1 LOW POWER, BY TYPE
7.2.1.1 40 TO 60 AMP
7.2.1.2 60 AMP TO 100 AMP
7.2.1.3 100 AMP TO 125 AMP
7.2.1.4 LESS THAN 40 AMP
7.2.2 LOW POWER, BY END USER
7.2.2.1 TRANSMISSION & DISTRIBUTION UTILITIES
7.2.2.2 INDUSTRIAL
7.2.2.3 COMMERCIAL
7.2.2.4 RESIDENTIAL
7.3 MEDIUM POWER (125 A-800 A)
7.3.1 MEDIUM POWER (125 A-800 A), BY TYPE
7.3.1.1 125 AMP TO 200 AMP
7.3.1.2 200 AMP TO 400 AMP
7.3.1.3 400 AMP TO 800 AMP
7.3.2 MEDIUM POWER (125 A-800 A), BY END USER
7.3.2.1 TRANSMISSION & DISTRIBUTION UTILITIES
7.3.2.2 INDUSTRIAL
7.3.2.3 COMMERCIAL
7.3.2.4 RESIDENTIAL
7.4 HIGH POWER (ABOVE 800 A)
7.4.1 HIGH POWER (ABOVE 800 A), BY TYPE
7.4.1.1 800 AMP TO 1,000 AMP
7.4.1.2 1,000 AMP TO 1200 AMP
7.4.2 HIGH POWER (ABOVE 800 A), BY END USER
7.4.2.1 TRANSMISSION & DISTRIBUTION UTILITIES
7.4.2.2 INDUSTRIAL
7.4.2.3 COMMERCIAL
7.4.2.4 RESIDENTIAL
8 NORTH AMERICA COPPER BUSBAR MARKET, BY PRODUCT TYPE
8.1 OVERVIEW
8.2 LAMINATE BUSBAR/ COMPOSITE BUSBAR
8.3 MULTIPLE CONDUCTOR BUSBARS
8.4 FLEXIBLE BUSBARS
8.5 SINGLE CONDUCTOR BUSBARS
9 NORTH AMERICA COPPER BUSBAR MARKET, BY PLATING
9.1 OVERVIEW
9.2 TIN
9.3 NICKEL
9.4 SILVER
10 NORTH AMERICA COPPER BUSBAR MARKET, BY INSULATION
10.1 OVERVIEW
10.2 EPOXY POWDER COATING
10.3 PET
10.4 PA12
10.5 PVC
10.6 PE
11 NORTH AMERICA COPPER BUSBAR MARKET, BY LENGTH
11.1 OVERVIEW
11.2 1M TO 2 MT
11.3 2 MT TO 3 MT
11.4 MORE THAN 3 MT
11.5 LESS THAN 1MT
12 NORTH AMERICA COPPER BUSBAR MARKET, BY END USER
12.1 OVERVIEW
12.2 TRANSMISSION & DISTRIBUTION UTILITIES
12.2.1 BY TYPE
12.2.1.1 RENEWABLE ENERGY
12.2.1.1.1 HYDROELECTRIC POWER
12.2.1.1.2 SOLAR ENERGY
12.2.1.1.3 WIND POWER
12.2.1.1.4 BIOENERGY
12.2.1.1.5 GEOTHERMAL ENERGY
12.2.1.2 SMART GRID
12.2.1.3 MICRO-GRIDS
12.2.1.4 OTHERS
12.2.2 BY CONDUCTOR
12.2.2.1 COPPER
12.2.2.2 ALUMINUM
12.3 INDUSTRIAL
12.3.1 BY TYPE
12.3.1.1 ELECTRIC/HYBRID ELECTRIC VEHICLES (EV/HEV)
12.3.1.1.1 CHARGING STATION
12.3.1.1.2 ELECTRIC CAR BATTERY PACK
12.3.1.1.3 EBUSES
12.3.1.1.4 ETRUCK
12.3.1.1.5 ELECTRIC FORKLIFT
12.3.1.1.6 OTHERS
12.3.1.2 FOOD AND BEVERAGES
12.3.1.3 LOGISTICS
12.3.1.4 TELECOMMUNICATION
12.3.1.5 RAILWAY
12.3.1.6 CHEMICAL
12.3.1.7 OIL AND GAS
12.3.1.8 MINING
12.3.1.9 DATA CENTER
12.3.1.10 OTHERS
12.3.2 BY CONDUCTOR
12.3.2.1 COPPER
12.3.2.2 ALUMINUM
12.4 COMMERCIAL
12.4.1 BY TYPE
12.4.1.1 OFFICES
12.4.1.2 HOSPITALITY
12.4.1.3 RETAILS AND SHOPPING MALLS
12.4.1.4 EDUCATION
12.4.1.5 RECREATIONAL FACILITIES
12.4.1.6 OTHERS
12.4.2 BY CONDUCTOR
12.4.2.1 COPPER
12.4.2.2 ALUMINUM
12.5 RESIDENTIAL SECTOR
12.5.1 COPPER
12.5.2 ALUMINUM
13 NORTH AMERICA COPPER BUSBAR MARKET, BY SALES CHANNEL
13.1 OVERVIEW
13.2 DIRECT CHANNEL
13.3 INDIRECT CHANNEL
14 NORTH AMERICA COPPER BUSBAR MARKET BY COUNTRIES
14.1 NORTH AMERICA
14.1.1 U.S.
14.1.2 CANADA
14.1.3 MEXICO
15 NORTH AMERICA COPPER BUSBAR MARKET
15.1 COMPANY SHARE ANALYSIS: NORTH AMERICA
16 SWOT ANALYSIS
17 COMPANY PROFILE
17.1 RITTAL GMBH & CO. KG
17.1.1 COMPANY SNAPSHOT
17.1.2 PRODUCT PORTFOLIO
17.1.3 RECENT DEVELOPMENTS
17.2 AMPHENOL CORPORATION
17.2.1 COMPANY SNAPSHOT
17.2.2 REVENUE ANALYSIS
17.2.3 PRODUCT PORTFOLIO
17.2.4 RECENT DEVELOPMENTS
17.3 EATON
17.3.1 COMPANY SNAPSHOT
17.3.2 REVENUE ANALYSIS
17.3.3 PRODUCT PORTFOLIO
17.3.4 RECENT DEVELOPMENTS
17.4 LEGRAND
17.4.1 COMPANY SNAPSHOT
17.4.2 REVENUE ANALYSIS
17.4.3 PRODUCT PORTFOLIO
17.4.4 RECENT DEVELOPMENTS
17.5 AMETEK. INC.
17.5.1 COMPANY SNAPSHOT
17.5.2 REVENUE ANALYSIS
17.5.3 PRODUCT PORTFOLIO
17.5.4 RECENT DEVELOPMENTS
17.6 AMERICAN ELEMENTS
17.6.1 COMPANY SNAPSHOT
17.6.2 PRODUCT PORTFOLIO
17.6.3 RECENT DEVELOPMENTS
17.7 ABB
17.7.1 COMPANY SNAPSHOT
17.7.2 REVENUE ANALYSIS
17.7.3 PRODUCT PORTFOLIO
17.7.4 RECENT DEVELOPMENTS
17.8 CAPLINQ CORPORATION
17.8.1 COMPANY SNAPSHOT
17.8.2 PRODUCT PORTFOLIO
17.8.3 RECENT DEVELOPMENTS
17.9 EG ELECTRONICS
17.9.1 COMPANY SNAPSHOT
17.9.2 PRODUCT PORTFOLIO
17.9.3 RECENT DEVELOPMENT
17.1 ENNOVI HOLDINGS PTE. LTD.
17.10.1 COMPANY SNAPSHOT
17.10.2 PRODUCT PORTFOLIO
17.10.3 RECENT DEVELOPMENTS
17.11 FANSHUN MACHINERY
17.11.1 COMPANY SNAPSHOT
17.11.2 PRODUCT PORTFOLIO
17.11.3 RECENT DEVELOPMENTS
17.12 HUBBELL
17.12.1 COMPANY SNAPSHOT
17.12.2 REVENUE ANALYSIS
17.12.3 PRODUCT PORTFOLIO
17.12.4 RECENT DEVELOPMENTS
17.13 LANTRIC TECHNOLOGIES INC.
17.13.1 COMPANY SNAPSHOT
17.13.2 PRODUCT PORTFOLIO
17.13.3 RECENT DEVELOPMENTS
17.14 MERSEN PROPERTY
17.14.1 COMPANY SNAPSHOT
17.14.2 REVENUE ANALYSIS
17.14.3 PRODUCT PORTFOLIO
17.14.4 RECENT DEVELOPMENTS
17.15 METINFO INC.
17.15.1 COMPANY SNAPSHOT
17.15.2 PRODUCT PORTFOLIO
17.15.3 RECENT DEVELOPMENTS
17.16 MOLEX, LLC
17.16.1 COMPANY SNAPSHOT
17.16.2 PRODUCT PORTFOLIO
17.16.3 RECENT DEVELOPMENTS
17.17 ROGERS CORPORATION
17.17.1 COMPANY SNAPSHOT
17.17.2 REVENUE ANALYSIS
17.17.3 PRODUCT PORTFOLIO
17.17.4 RECENT DEVELOPMENTS
17.18 SCHNEIDER ELECTRIC
17.18.1 COMPANY SNAPSHOT
17.18.2 REVENUE ANALYSIS
17.18.3 PRODUCT PORTFOLIO
17.18.4 RECENT DEVELOPMENTSS
17.19 SIEMENS
17.19.1 COMPANY SNAPSHOT
17.19.2 REVENUE ANALYSIS
17.19.3 PRODUCT PORTFOLIO
17.19.4 RECENT DEVELOPMENTS
17.2 SPF AMERICA
17.20.1 COMPANY SNAPSHOT
17.20.2 SERVICE PORTFOLIO
17.20.3 RECENT DEVELOPMENTS
17.21 WATTEREDGE, LLC
17.21.1 COMPANY SNAPSHOT
17.21.2 PRODUCT PORTFOLIO
17.21.3 RECENT DEVELOPMENT
18 QUESTIONNAIRE
19 RELATED REPORTS
List of Table
TABLE 1 EXPORT DATA FOR NORTH AMERICA COPPER BUSBAR MARKET
TABLE 2 IMPORT DATA FOR NORTH AMERICA COPPER BUSBAR MARKET
TABLE 3 EXPORT DATA FOR NORTH AMERICA COPPER BUSBAR MARKET
TABLE 4 IMPORT DATA FOR NORTH AMERICA COPPER BUSBAR MARKET
TABLE 5 NORTH AMERICA COPPER BUSBAR MARKET, BY TYPE, 2022-2032 (USD THOUSAND)
TABLE 6 NORTH AMERICA COPPER BUSBAR MARKET, BY POWER RATING, 2022-2032 (USD THOUSAND)
TABLE 7 NORTH AMERICA LOW POWER IN COPPER BUSBAR MARKET, BY TYPE, 2022-2032 (USD THOUSAND)
TABLE 8 NORTH AMERICA LOW POWER IN COPPER BUSBAR MARKET, BY END USER, 2022-2032 (USD THOUSAND)
TABLE 9 NORTH AMERICA MEDIUM POWER (125 A-800 A) IN COPPER BUSBAR MARKET, BY TYPE, 2022-2032 (USD THOUSAND)
TABLE 10 NORTH AMERICA MEDIUM POWER (125 A-800 A) IN COPPER BUSBAR MARKET, BY END USER, 2022-2032 (USD THOUSAND)
TABLE 11 NORTH AMERICA HIGH POWER (ABOVE 800 A) IN COPPER BUSBAR MARKET, BY TYPE, 2022-2032 (USD THOUSAND)
TABLE 12 NORTH AMERICA HIGH POWER (ABOVE 800 A) IN COPPER BUSBAR MARKET, BY END USER, 2022-2032 (USD THOUSAND)
TABLE 13 NORTH AMERICA COPPER BUSBAR MARKET, BY PRODUCT TYPE, 2022-2032 (USD THOUSAND)
TABLE 14 NORTH AMERICA COPPER BUSBAR MARKET, BY PLATING, 2022-2032 (USD THOUSAND)
TABLE 15 NORTH AMERICA COPPER BUSBAR MARKET, BY INSULATION, 2022-2032 (USD THOUSAND)
TABLE 16 NORTH AMERICA COPPER BUSBAR MARKET, BY LENGTH, 2022-2032 (USD THOUSAND)
TABLE 17 NORTH AMERICA COPPER BUSBAR MARKET, BY END USER, 2022-2032 (USD THOUSAND)
TABLE 18 NORTH AMERICA TRANSMISSION & DISTRIBUTION UTILITIES IN COPPER BUSBAR MARKET, BY TYPE, 2018-2032 (USD THOUSAND)
TABLE 19 NORTH AMERICA RENEWABLE ENERGY IN COPPER BUSBAR MARKET, BY TYPE, 2018-2032 (USD THOUSAND)
TABLE 20 NORTH AMERICA TRANSMISSION & DISTRIBUTION UTILITIES IN COPPER BUSBAR MARKET, BY CONDUCTOR, 2018-2032 (USD THOUSAND)
TABLE 21 NORTH AMERICA INDUSTRIAL IN COPPER BUSBAR MARKET, BY TYPE, 2018-2032 (USD THOUSAND)
TABLE 22 NORTH AMERICA ELECTRIC/HYBRID ELECTRIC VEHICLES (EV/HEV) IN COPPER BUSBAR MARKET, BY TYPE, 2018-2032 (USD THOUSAND)
TABLE 23 NORTH AMERICA INDUSTRIAL IN COPPER BUSBAR MARKET, BY CONDUCTOR, 2018-2032 (USD THOUSAND)
TABLE 24 NORTH AMERICA COMMERCIAL IN COPPER BUSBAR MARKET, BY TYPE, 2018-2032 (USD THOUSAND)
TABLE 25 NORTH AMERICA COMMERCIAL IN COPPER BUSBAR MARKET, BY CONDUCTOR, 2018-2032 (USD THOUSAND)
TABLE 26 NORTH AMERICA RESIDENTIAL IN COPPER BUSBAR MARKET, BY CONDUCTOR, 2018-2032 (USD THOUSAND)
TABLE 27 NORTH AMERICA COPPER BUSBAR MARKET, BY SALES CHANNEL, 2022-2032 (USD THOUSAND)
TABLE 28 NORTH AMERICA COPPER BUSBAR MARKET, BY COUNTRY, 2018-2032 (USD THOUSAND)
TABLE 29 U.S. COPPER BUSBAR MARKET, BY TYPE, 2018-2032 (USD THOUSAND)
TABLE 30 U.S. COPPER BUSBAR MARKET, BY POWER RATING, 2018-2032 (USD THOUSAND)
TABLE 31 U.S. LOW POWER IN COPPER BUSBAR MARKET, BY TYPE, 2018-2032 (USD THOUSAND)
TABLE 32 U.S. LOW POWER IN COPPER BUSBAR MARKET, BY END USER, 2018-2032 (USD THOUSAND)
TABLE 33 U.S. MEDIUM POWER (125 A-800 A) IN COPPER BUSBAR MARKET, BY TYPE, 2018-2032 (USD THOUSAND)
TABLE 34 U.S. MEDIUM POWER (125 A-800 A) IN COPPER BUSBAR MARKET, BY END USER, 2018-2032 (USD THOUSAND)
TABLE 35 U.S. HIGH POWER (ABOVE 800 A) IN COPPER BUSBAR MARKET, BY TYPE, 2018-2032 (USD THOUSAND)
TABLE 36 U.S. HIGH POWER (ABOVE 800 A) IN COPPER BUSBAR MARKET, BY END USER, 2018-2032 (USD THOUSAND)
TABLE 37 U.S. COPPER BUSBAR MARKET, BY PRODUCT TYPE, 2018-2032 (USD THOUSAND)
TABLE 38 U.S. COPPER BUSBAR MARKET, BY PLATING, 2018-2032 (USD THOUSAND)
TABLE 39 U.S. COPPER BUSBAR MARKET, BY INSULATION, 2018-2032 (USD THOUSAND)
TABLE 40 U.S. COPPER BUSBAR MARKET, BY LENGTH, 2018-2032 (USD THOUSAND)
TABLE 41 U.S. COPPER BUSBAR MARKET, BY END USER, 2018-2032 (USD THOUSAND)
TABLE 42 U.S. TRANSMISSION & DISTRIBUTION UTILITIES IN COPPER BUSBAR MARKET, BY TYPE, 2018-2032 (USD THOUSAND)
TABLE 43 U.S. RENEWABLE ENERGY IN COPPER BUSBAR MARKET, BY TYPE, 2018-2032 (USD THOUSAND)
TABLE 44 U.S. TRANSMISSION & DISTRIBUTION UTILITIES IN COPPER BUSBAR MARKET, BY CONDUCTOR, 2018-2032 (USD THOUSAND)
TABLE 45 U.S. INDUSTRIAL IN COPPER BUSBAR MARKET, BY TYPE, 2018-2032 (USD THOUSAND)
TABLE 46 U.S. ELECTRIC/HYBRID ELECTRIC VEHICLES (EV/HEV) IN COPPER BUSBAR MARKET, BY TYPE, 2018-2032 (USD THOUSAND)
TABLE 47 U.S. INDUSTRIAL IN COPPER BUSBAR MARKET, BY CONDUCTOR, 2018-2032 (USD THOUSAND)
TABLE 48 U.S. COMMERCIAL IN COPPER BUSBAR MARKET, BY TYPE, 2018-2032 (USD THOUSAND)
TABLE 49 U.S. COMMERCIAL IN COPPER BUSBAR MARKET, BY CONDUCTOR, 2018-2032 (USD THOUSAND)
TABLE 50 U.S. RESIDENTIAL SECTOR IN COPPER BUSBAR MARKET, BY CONDUCTOR, 2018-2032 (USD THOUSAND)
TABLE 51 U.S. COPPER BUSBAR MARKET, BY SALES CHANNEL, 2018-2032 (USD THOUSAND)
TABLE 52 CANADA COPPER BUSBAR MARKET, BY TYPE, 2018-2032 (USD THOUSAND)
TABLE 53 CANADA COPPER BUSBAR MARKET, BY POWER RATING, 2018-2032 (USD THOUSAND)
TABLE 54 CANADA LOW POWER IN COPPER BUSBAR MARKET, BY TYPE, 2018-2032 (USD THOUSAND)
TABLE 55 CANADA LOW POWER IN COPPER BUSBAR MARKET, BY END USER, 2018-2032 (USD THOUSAND)
TABLE 56 CANADA MEDIUM POWER (125 A-800 A) IN COPPER BUSBAR MARKET, BY TYPE, 2018-2032 (USD THOUSAND)
TABLE 57 CANADA MEDIUM POWER (125 A-800 A) IN COPPER BUSBAR MARKET, BY END USER, 2018-2032 (USD THOUSAND)
TABLE 58 CANADA HIGH POWER (ABOVE 800 A) IN COPPER BUSBAR MARKET, BY TYPE, 2018-2032 (USD THOUSAND)
TABLE 59 CANADA HIGH POWER (ABOVE 800 A) IN COPPER BUSBAR MARKET, BY END USER, 2018-2032 (USD THOUSAND)
TABLE 60 CANADA COPPER BUSBAR MARKET, BY PRODUCT TYPE, 2018-2032 (USD THOUSAND)
TABLE 61 CANADA COPPER BUSBAR MARKET, BY PLATING, 2018-2032 (USD THOUSAND)
TABLE 62 CANADA COPPER BUSBAR MARKET, BY INSULATION, 2018-2032 (USD THOUSAND)
TABLE 63 CANADA COPPER BUSBAR MARKET, BY LENGTH, 2018-2032 (USD THOUSAND)
TABLE 64 CANADA COPPER BUSBAR MARKET, BY END USER, 2018-2032 (USD THOUSAND)
TABLE 65 CANADA TRANSMISSION & DISTRIBUTION UTILITIES IN COPPER BUSBAR MARKET, BY TYPE, 2018-2032 (USD THOUSAND)
TABLE 66 CANADA RENEWABLE ENERGY IN COPPER BUSBAR MARKET, BY TYPE, 2018-2032 (USD THOUSAND)
TABLE 67 CANADA TRANSMISSION & DISTRIBUTION UTILITIES IN COPPER BUSBAR MARKET, BY CONDUCTOR, 2018-2032 (USD THOUSAND)
TABLE 68 CANADA INDUSTRIAL IN COPPER BUSBAR MARKET, BY TYPE, 2018-2032 (USD THOUSAND)
TABLE 69 CANADA ELECTRIC/HYBRID ELECTRIC VEHICLES (EV/HEV) IN COPPER BUSBAR MARKET, BY TYPE, 2018-2032 (USD THOUSAND)
TABLE 70 CANADA INDUSTRIAL IN COPPER BUSBAR MARKET, BY CONDUCTOR, 2018-2032 (USD THOUSAND)
TABLE 71 CANADA COMMERCIAL IN COPPER BUSBAR MARKET, BY TYPE, 2018-2032 (USD THOUSAND)
TABLE 72 CANADA COMMERCIAL IN COPPER BUSBAR MARKET, BY CONDUCTOR, 2018-2032 (USD THOUSAND)
TABLE 73 CANADA RESIDENTIAL SECTOR IN COPPER BUSBAR MARKET, BY CONDUCTOR, 2018-2032 (USD THOUSAND)
TABLE 74 CANADA COPPER BUSBAR MARKET, BY SALES CHANNEL, 2018-2032 (USD THOUSAND)
TABLE 75 MEXICO COPPER BUSBAR MARKET, BY TYPE, 2018-2032 (USD THOUSAND)
TABLE 76 MEXICO COPPER BUSBAR MARKET, BY POWER RATING, 2018-2032 (USD THOUSAND)
TABLE 77 MEXICO LOW POWER IN COPPER BUSBAR MARKET, BY TYPE, 2018-2032 (USD THOUSAND)
TABLE 78 MEXICO LOW POWER IN COPPER BUSBAR MARKET, BY END USER, 2018-2032 (USD THOUSAND)
TABLE 79 MEXICO MEDIUM POWER (125 A-800 A) IN COPPER BUSBAR MARKET, BY TYPE, 2018-2032 (USD THOUSAND)
TABLE 80 MEXICO MEDIUM POWER (125 A-800 A) IN COPPER BUSBAR MARKET, BY END USER, 2018-2032 (USD THOUSAND)
TABLE 81 MEXICO HIGH POWER (ABOVE 800 A) IN COPPER BUSBAR MARKET, BY TYPE, 2018-2032 (USD THOUSAND)
TABLE 82 MEXICO HIGH POWER (ABOVE 800 A) IN COPPER BUSBAR MARKET, BY END USER, 2018-2032 (USD THOUSAND)
TABLE 83 MEXICO COPPER BUSBAR MARKET, BY PRODUCT TYPE, 2018-2032 (USD THOUSAND)
TABLE 84 MEXICO COPPER BUSBAR MARKET, BY PLATING, 2018-2032 (USD THOUSAND)
TABLE 85 MEXICO COPPER BUSBAR MARKET, BY INSULATION, 2018-2032 (USD THOUSAND)
TABLE 86 MEXICO COPPER BUSBAR MARKET, BY LENGTH, 2018-2032 (USD THOUSAND)
TABLE 87 MEXICO COPPER BUSBAR MARKET, BY END USER, 2018-2032 (USD THOUSAND)
TABLE 88 MEXICO TRANSMISSION & DISTRIBUTION UTILITIES IN COPPER BUSBAR MARKET, BY TYPE, 2018-2032 (USD THOUSAND)
TABLE 89 MEXICO RENEWABLE ENERGY IN COPPER BUSBAR MARKET, BY TYPE, 2018-2032 (USD THOUSAND)
TABLE 90 MEXICO TRANSMISSION & DISTRIBUTION UTILITIES IN COPPER BUSBAR MARKET, BY CONDUCTOR, 2018-2032 (USD THOUSAND)
TABLE 91 MEXICO INDUSTRIAL IN COPPER BUSBAR MARKET, BY TYPE, 2018-2032 (USD THOUSAND)
TABLE 92 MEXICO ELECTRIC/HYBRID ELECTRIC VEHICLES (EV/HEV) IN COPPER BUSBAR MARKET, BY TYPE, 2018-2032 (USD THOUSAND)
TABLE 93 MEXICO INDUSTRIAL IN COPPER BUSBAR MARKET, BY CONDUCTOR, 2018-2032 (USD THOUSAND)
TABLE 94 MEXICO COMMERCIAL IN COPPER BUSBAR MARKET, BY TYPE, 2018-2032 (USD THOUSAND)
TABLE 95 MEXICO COMMERCIAL IN COPPER BUSBAR MARKET, BY CONDUCTOR, 2018-2032 (USD THOUSAND)
TABLE 96 MEXICO RESIDENTIAL SECTOR IN COPPER BUSBAR MARKET, BY CONDUCTOR, 2018-2032 (USD THOUSAND)
TABLE 97 MEXICO COPPER BUSBAR MARKET, BY SALES CHANNEL, 2018-2032 (USD THOUSAND)
List of Figure
FIGURE 1 NORTH AMERICA COPPER BUSBAR MARKET: SEGMENTATION
FIGURE 2 NORTH AMERICA COPPER BUSBAR MARKET: DATA TRIANGULATION
FIGURE 3 NORTH AMERICA COPPER BUSBAR MARKET: DROC ANALYSIS
FIGURE 4 NORTH AMERICA COPPER BUSBAR MARKET: NORTH AMERICA VS REGIONS MARKET ANALYSIS
FIGURE 5 NORTH AMERICA COPPER BUSBAR MARKET: COMPANY RESEARCH ANALYSIS
FIGURE 6 NORTH AMERICA COPPER BUSBAR MARKET: INTERVIEW DEMOGRAPHICS
FIGURE 7 NORTH AMERICA COPPER BUSBAR MARKET: DBMR MARKET POSITION GRID
FIGURE 8 NORTH AMERICA COPPER BUSBAR MARKET: VENDOR SHARE ANALYSIS
FIGURE 9 NORTH AMERICA COPPER BUSBAR MARKET: MARKET END USER COVERAGE GRID
FIGURE 10 NORTH AMERICA COPPER BUSBAR MARKET: SEGMENTATION
FIGURE 11 STRATEGIC DECISIONS
FIGURE 12 THREE SEGMENTS COMPRISE THE NORTH AMERICA COPPER BUSBAR MARKET, BY TYPE
FIGURE 13 RISING ADOPTION OF SMART GRID TECHNOLOGY IS EXPECTED TO DRIVE THE NORTH AMERICA COPPER BUSBAR MARKET IN THE FORECAST PERIOD OF 2025 TO 2032
FIGURE 14 ELECTROLYTIC TOUGH PITCH IS EXPECTED TO ACCOUNT FOR THE LARGEST SHARE OF THE NORTH AMERICA COPPER BUSBAR MARKET IN 2024 & 2032
FIGURE 15 VALUE CHAIN FOR NORTH AMERICA COPPER BUSBAR MARKET
FIGURE 16 COMPANY COMPARISON
FIGURE 17 DRIVERS, RESTRAINTS, OPPORTUNITIES AND CHALLENGES OF NORTH AMERICA COPPER BUSBAR MARKET
FIGURE 18 INDUSTRIAL ENERGY CONSUMPTION
FIGURE 19 COPPER PRICE
FIGURE 20 COMMODITY DEMAND CHANGE-100% EV
FIGURE 21 NORTH AMERICA COPPER BUSBAR MARKET: BY TYPE, 2024
FIGURE 22 NORTH AMERICA COPPER BUSBAR MARKET: BY POWER RATING, 2024
FIGURE 23 NORTH AMERICA COPPER BUSBAR MARKET: BY PRODUCT TYPE, 2024
FIGURE 24 NORTH AMERICA COPPER BUSBAR MARKET: BY PLATING, 2024
FIGURE 25 NORTH AMERICA COPPER BUSBAR MARKET: BY INSULATION, 2024
FIGURE 26 NORTH AMERICA COPPER BUSBAR MARKET: BY LENGTH, 2024
FIGURE 27 NORTH AMERICA COPPER BUSBAR MARKET: BY END USER, 2024
FIGURE 28 NORTH AMERICA COPPER BUSBAR MARKET: BY SALES CHANNEL 2024
FIGURE 29 NORTH AMERICA COPPER BUSBAR MARKET SNAPSHOT
FIGURE 30 NORTH AMERICA COPPER BUSBAR MARKET: COMPANY SHARE 2023 (%)
North America Copper Busbar Market, Supply Chain Analysis and Ecosystem Framework
To support market growth and help clients navigate the impact of geopolitical shifts, DBMR has integrated in-depth supply chain analysis into its North America Copper Busbar Market research reports. This addition empowers clients to respond effectively to global changes affecting their industries. The supply chain analysis section includes detailed insights such as North America Copper Busbar Market consumption and production by country, price trend analysis, the impact of tariffs and geopolitical developments, and import and export trends by country and HSN code. It also highlights major suppliers with data on production capacity and company profiles, as well as key importers and exporters. In addition to research, DBMR offers specialized supply chain consulting services backed by over a decade of experience, providing solutions like supplier discovery, supplier risk assessment, price trend analysis, impact evaluation of inflation and trade route changes, and comprehensive market trend analysis.
Data collection and base year analysis are done using data collection modules with large sample sizes. The stage includes obtaining market information or related data through various sources and strategies. It includes examining and planning all the data acquired from the past in advance. It likewise envelops the examination of information inconsistencies seen across different information sources. The market data is analysed and estimated using market statistical and coherent models. Also, market share analysis and key trend analysis are the major success factors in the market report. To know more, please request an analyst call or drop down your inquiry.
The key research methodology used by DBMR research team is data triangulation which involves data mining, analysis of the impact of data variables on the market and primary (industry expert) validation. Data models include Vendor Positioning Grid, Market Time Line Analysis, Market Overview and Guide, Company Positioning Grid, Patent Analysis, Pricing Analysis, Company Market Share Analysis, Standards of Measurement, Global versus Regional and Vendor Share Analysis. To know more about the research methodology, drop in an inquiry to speak to our industry experts.
Data Bridge Market Research is a leader in advanced formative research. We take pride in servicing our existing and new customers with data and analysis that match and suits their goal. The report can be customized to include price trend analysis of target brands understanding the market for additional countries (ask for the list of countries), clinical trial results data, literature review, refurbished market and product base analysis. Market analysis of target competitors can be analyzed from technology-based analysis to market portfolio strategies. We can add as many competitors that you require data about in the format and data style you are looking for. Our team of analysts can also provide you data in crude raw excel files pivot tables (Fact book) or can assist you in creating presentations from the data sets available in the report.


