
North America Crop Protection Products Market
Market Size in USD Billion
 USD
26.22 Billion
USD
38.60 Billion
2024
2032
USD
26.22 Billion
USD
38.60 Billion
2024
2032
| 2025 - 2032 | |
| USD 26.22 Billion | |
| USD 38.60 Billion | |
| % | |
|
North America Crop Protection Products Market Size
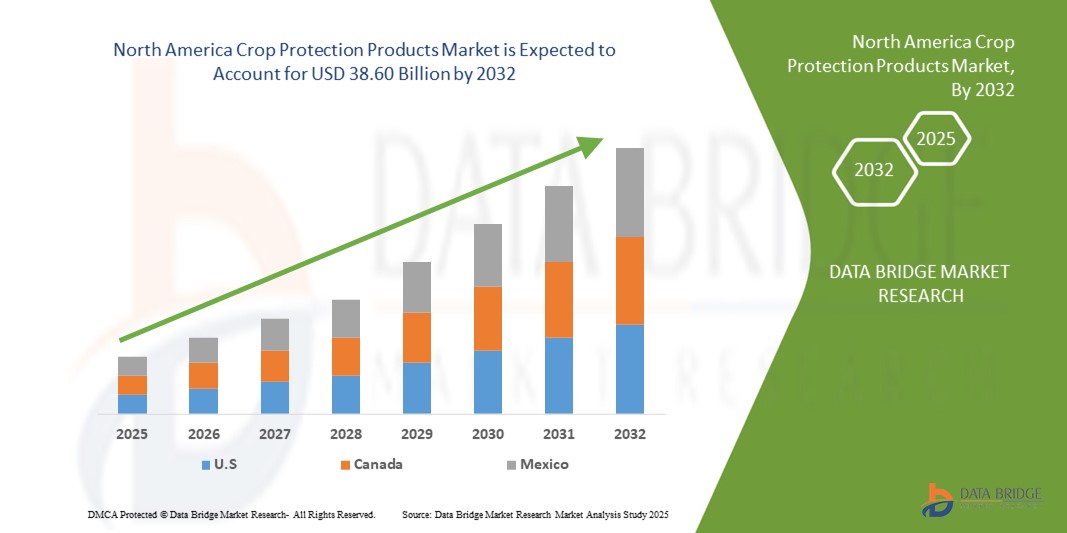
- The North America crop protection products market size was valued at USD 26.22 billion in 2024 and is expected to reach USD 38.60 billion by 2032, at a CAGR of 4.95% during the forecast period
- The market growth is largely fuelled by the increasing need to enhance agricultural productivity, rising demand for food security, and the adoption of advanced farming practices
- The growing pressure to reduce crop losses due to pests, weeds, and diseases, along with the expansion of commercial farming, further supports market expansion
North America Crop Protection Products Market Analysis
- The crop protection products market is experiencing steady growth as farmers and agribusinesses increasingly prioritize effective solutions to safeguard yields and improve quality
- Rising adoption of sustainable and bio-based crop protection alternatives is reshaping the competitive landscape, aligning with stricter regulatory standards and consumer demand for safe agricultural produce
- U.S. crop dominated the North America crop protection products market with the largest revenue share in 2024, fueled by the increasing use of herbicides, insecticides, and fungicides across large-scale commercial farming operations
- Canada is expected to witness the highest compound annual growth rate (CAGR) in the North America crop protection products market due to increasing adoption of sustainable farming practices, rising demand for biopesticides, and expanding use of advanced crop protection technologies to enhance productivity in cereals, grains, and oilseeds
- The Bacillus Thuringiensis (BT) segment held the largest market revenue share in 2024 driven by its broad-spectrum pest control properties and compatibility with sustainable farming practices. BT-based solutions are widely preferred for their efficiency, low environmental impact, and suitability for a variety of crops
Report Scope and North America Crop Protection Products Market Segmentation
|
Attributes |
North America Crop Protection Products Key Market Insights |
|
Segments Covered |
|
|
Countries Covered |
North America
|
|
Key Market Players |
|
|
Market Opportunities |
|
|
Value Added Data Infosets |
In addition to the insights on market scenarios such as market value, growth rate, segmentation, geographical coverage, and major players, the market reports curated by the Data Bridge Market Research also include in-depth expert analysis, pricing analysis, brand share analysis, consumer survey, demography analysis, supply chain analysis, value chain analysis, raw material/consumables overview, vendor selection criteria, PESTLE Analysis, Porter Analysis, and regulatory framework. |
North America Crop Protection Products Market Trends
Rising Adoption of Advanced Crop Protection Solutions
- The growing shift toward advanced crop protection solutions is transforming the agriculture landscape by enabling higher crop yields and reducing losses due to pests, weeds, and diseases. These solutions allow for timely and precise application, improving overall productivity and profitability for farmers. Increasing awareness about crop health and the long-term benefits of modern formulations is further accelerating adoption across diverse farming systems
- The increasing demand for sustainable and bio-based pesticides and herbicides is accelerating adoption of eco-friendly formulations. These products help maintain soil health and reduce environmental impact while ensuring crop protection. Farmers and agribusinesses are increasingly integrating these solutions into long-term crop management strategies, responding to regulatory pressures and consumer preferences for safer produce
- Improved affordability and ease of use of modern crop protection products are encouraging wider adoption among smallholder and commercial farmers. Frequent use supports better crop monitoring and reduces the risk of large-scale losses. Technological advancements, such as pre-measured formulations and smart application devices, are making effective crop protection accessible even in less mechanized farms
- For instance, in recent years, farmers using integrated pest management kits and precision herbicide application tools have reported higher crop quality and reduced chemical wastage. These tools enable targeted action, lower production costs, and enhance long-term soil sustainability. The adoption of these innovations is also fostering knowledge sharing and better compliance with environmental safety standards
- While advanced crop protection products improve yields and efficiency, their success depends on continued innovation, farmer education, and cost-effectiveness. Manufacturers must focus on scalable, safe, and environmentally responsible solutions to fully capitalize on market demand. Collaboration with agricultural extension services and training programs is key to maximizing their effectiveness and long-term market penetration
North America Crop Protection Products Market Dynamics
Driver
Increasing Incidence of Pests, Weeds, and Plant Diseases
- Rising pest and weed infestations, along with plant diseases, are driving the demand for effective crop protection products. Farmers and agribusinesses are prioritizing solutions that minimize yield loss and maintain crop quality. Growing global food demand and the need for consistent supply chains are further intensifying the adoption of protective measures
- Awareness of the financial impact of untreated crop threats, including reduced productivity and revenue loss, is motivating regular use of pesticides, herbicides, and fungicides. Proper crop protection directly supports farm profitability and long-term operational sustainability. Increasing collaborations between agronomists and farmers are helping optimize product selection and timing for maximum efficiency
- Governmental guidelines and agricultural organizations promoting safe and effective crop protection practices are further supporting market growth. Regulatory frameworks encourage integrated pest management and environmentally friendly formulations. Incentives and subsidies for adopting advanced products are also playing a key role in expanding usage among different farm sizes
- For instance, recent agricultural programs have incentivized the use of integrated crop protection solutions, encouraging adoption of both conventional and bio-based products. Training initiatives and awareness campaigns are complementing these programs to ensure proper application and reduce misuse. The result is improved crop health, reduced chemical residues, and enhanced sustainability metrics
- While pest prevalence and regulatory support drive the market, widespread adoption requires proper training, technology integration, and affordable solutions for all types of farmers. Continued investment in digital farming tools and precision agriculture devices further enhances the effectiveness of crop protection strategies. Partnerships with distributors and cooperatives are helping to bridge the gap for smallholder farmers
Restraint/Challenge
High Cost of Advanced Crop Protection Products and Access Limitations
- The high price of advanced crop protection chemicals, formulations, and precision application tools makes them less accessible for small-scale farmers. Premium products are often limited to commercial operations, restricting widespread usage. Cost barriers are particularly significant in regions with lower farm incomes or fragmented distribution networks
- Lack of technical knowledge and training on effective application methods reduces the efficiency of crop protection products, especially among smallholder farmers. Incorrect usage can lead to crop damage, chemical resistance, or environmental hazards. Educating farmers on dosage, timing, and safety protocols is critical to maximizing both productivity and safety
- Supply chain constraints for specialized formulations and equipment further limit availability, leading to suboptimal usage or reliance on traditional methods. Delays in delivery and inconsistent product quality can negatively impact crop cycles. Strengthening logistics, warehousing, and local manufacturing capabilities is essential to overcome these challenges
- For instance, surveys indicate that a significant portion of farmers delay or reduce pesticide applications due to cost or lack of proper guidance, resulting in crop losses. Such gaps highlight the need for affordable, easy-to-use, and widely accessible crop protection solutions. Market stakeholders must develop strategies that combine product innovation with practical deployment models
- While innovation in crop protection continues, addressing affordability, accessibility, and training remains critical. Market players must focus on cost-effective solutions, decentralized distribution, and educational programs to unlock long-term market potential. Collaboration with government agencies, NGOs, and cooperatives can accelerate adoption and improve overall farm productivity
North America Crop Protection Products Market Scope
The market is segmented on the basis of active ingredient, product type, origin, form, application, and crop type.
- By Active Ingredient
On the basis of active ingredient, the North America crop protection products market is segmented into Bacillus Thuringiensis (BT), Azoxystrobin, Bifenthrin, Fludioxonil, Acephate, Boscalid, Bendiocarb, 1-Methylcyclopropene, Calcium Chloride, Daminozide, Benzyl Adenine, and Others. The Bacillus Thuringiensis (BT) segment held the largest market revenue share in 2024 driven by its broad-spectrum pest control properties and compatibility with sustainable farming practices. BT-based solutions are widely preferred for their efficiency, low environmental impact, and suitability for a variety of crops.
The Azoxystrobin segment is expected to witness the fastest growth rate from 2025 to 2032, driven by its high effectiveness against fungal diseases and growing adoption across fruits, vegetables, and cereals. Azoxystrobin formulations are increasingly preferred for their reliability, longer residual activity, and compatibility with integrated pest management programs.
- By Product Type
On the basis of product type, the North America crop protection products market is segmented into Herbicides, Insecticides, Fungicides, Plant Growth Regulators, Acaricides, Fumigants, Nemathists, Spread Adhesives, and Others. The Herbicides segment held the largest market revenue share in 2024 driven by the increasing need for effective weed management and higher crop yields. Herbicides offer precise application, minimize crop damage, and are widely adopted across large-scale cereal and grain production systems.
The Insecticides segment is expected to witness the fastest growth rate from 2025 to 2032, driven by rising pest infestations and the growing importance of crop loss prevention. Advanced insecticide formulations provide targeted action, reduced chemical use, and enhanced crop protection efficiency, increasing adoption among commercial and smallholder farmers.
- By Origin
On the basis of origin, the North America crop protection products market is segmented into Synthetic and Biopesticides. The Synthetic segment held the largest market revenue share in 2024 driven by its broad efficacy, cost-effectiveness, and extensive availability across crop types. Synthetic formulations remain widely adopted for large-scale commercial farming.
The Biopesticides segment is expected to witness the fastest growth rate from 2025 to 2032, driven by increasing demand for eco-friendly and sustainable crop protection solutions. Biopesticides are gaining popularity due to low environmental impact, regulatory compliance, and suitability for organic farming practices.
- By Form
On the basis of form, the North America crop protection products market is segmented into Liquid and Dry. The Liquid segment held the largest market revenue share in 2024 driven by ease of application, faster absorption, and compatibility with automated spraying systems. Liquids are widely used for foliar sprays and post-harvest treatment.
The Dry segment is expected to witness the fastest growth rate from 2025 to 2032, driven by adoption in seed treatment, soil treatment, and precision farming applications. Dry formulations are preferred for their stability, longer shelf life, and suitability for mechanized equipment.
- By Application
On the basis of application, the North America crop protection products market is segmented into Foliar Spray, Seed Treatment, Soil Treatment, Post-Harvest, Chemigation, and Others. The Foliar Spray segment held the largest market revenue share in 2024 driven by its ability to provide rapid and targeted pest and disease control. Foliar sprays are widely adopted for high-value crops due to efficiency and convenience.
The Seed Treatment segment is expected to witness the fastest growth rate from 2025 to 2032, driven by early-stage crop protection needs and increasing adoption in fruits, vegetables, and cereals. Seed treatments help reduce pest attacks, improve germination, and enhance overall crop performance.
- By Crop Type
On the basis of crop type, the North America crop protection products market is segmented into Cereals and Grains, Fruits and Vegetables, Oilseeds and Pulses, Turf and Ornamentals, and Other Crops. The Cereals and Grains segment held the largest market revenue share in 2024 driven by large-scale cultivation and global staple crop demand. These crops require extensive weed and pest management to maintain yields.
The Fruits and Vegetables segment is expected to witness the fastest growth rate from 2025 to 2032, driven by increasing consumption, higher value, and demand for quality and safe produce. Precision crop protection solutions and bio-based products are increasingly adopted in these high-value crops to ensure food safety and yield optimization.
North America Crop Protection Products Market Regional Analysis
- U.S. crop dominated the North America crop protection products market with the largest revenue share in 2024, fueled by the increasing use of herbicides, insecticides, and fungicides across large-scale commercial farming operations
- Farmers are adopting integrated pest management solutions and precision agriculture techniques to improve yield and reduce losses
- Strong research and development by major agrochemical companies, combined with awareness campaigns and regulatory support, is significantly contributing to market growth
Canada Crop Protection Products Market Insight
Canada crop protection products market is expected to witness the fastest growth rate from 2025 to 2032, driven by increasing awareness among farmers about sustainable farming practices and crop disease management. Farmers are adopting integrated pest management and precision agriculture techniques to enhance productivity. Government incentives and programs promoting eco-friendly and high-performance crop protection products are further supporting market growth.
North America Crop Protection Products Market Share
The North America crop protection products industry is primarily led by well-established companies, including:
- Dow AgroSciences (U.S.)
- FMC Corporation (U.S.)
- Corteva Agriscience (U.S.)
- Valent U.S.A. LLC (U.S.)
- Marrone Bio Innovations (U.S.)
- Helena Agri-Enterprises (U.S.)
- Amvac Chemical Corporation (U.S.)
- Gowan Company (U.S.)
- Tessenderlo Kerley, Inc. (U.S.)
- U.S. Borax & Chemicals (U.S.)
Latest Developments in North America Crop Protection Products Market
- In January 2023, Corteva expanded farmer access to its Enlist herbicide system in 2024, enhancing weed management capabilities. This innovative solution offered effective control of resistant weed species while promoting sustainable agricultural practices. By focusing on maximizing crop yields, the Enlist system empowered growers to tackle tough challenges in modern farming efficiently
SKU-

- Interactive Data Analysis Dashboard
- Company Analysis Dashboard for high growth potential opportunities
- Research Analyst Access for customization & queries
- Competitor Analysis with Interactive dashboard
- Latest News, Updates & Trend analysis
- Harness the Power of Benchmark Analysis for Comprehensive Competitor Tracking
North America Crop Protection Products Market, Supply Chain Analysis and Ecosystem Framework
To support market growth and help clients navigate the impact of geopolitical shifts, DBMR has integrated in-depth supply chain analysis into its North America Crop Protection Products Market research reports. This addition empowers clients to respond effectively to global changes affecting their industries. The supply chain analysis section includes detailed insights such as North America Crop Protection Products Market consumption and production by country, price trend analysis, the impact of tariffs and geopolitical developments, and import and export trends by country and HSN code. It also highlights major suppliers with data on production capacity and company profiles, as well as key importers and exporters. In addition to research, DBMR offers specialized supply chain consulting services backed by over a decade of experience, providing solutions like supplier discovery, supplier risk assessment, price trend analysis, impact evaluation of inflation and trade route changes, and comprehensive market trend analysis.
Data collection and base year analysis are done using data collection modules with large sample sizes. The stage includes obtaining market information or related data through various sources and strategies. It includes examining and planning all the data acquired from the past in advance. It likewise envelops the examination of information inconsistencies seen across different information sources. The market data is analysed and estimated using market statistical and coherent models. Also, market share analysis and key trend analysis are the major success factors in the market report. To know more, please request an analyst call or drop down your inquiry.
The key research methodology used by DBMR research team is data triangulation which involves data mining, analysis of the impact of data variables on the market and primary (industry expert) validation. Data models include Vendor Positioning Grid, Market Time Line Analysis, Market Overview and Guide, Company Positioning Grid, Patent Analysis, Pricing Analysis, Company Market Share Analysis, Standards of Measurement, Global versus Regional and Vendor Share Analysis. To know more about the research methodology, drop in an inquiry to speak to our industry experts.
Data Bridge Market Research is a leader in advanced formative research. We take pride in servicing our existing and new customers with data and analysis that match and suits their goal. The report can be customized to include price trend analysis of target brands understanding the market for additional countries (ask for the list of countries), clinical trial results data, literature review, refurbished market and product base analysis. Market analysis of target competitors can be analyzed from technology-based analysis to market portfolio strategies. We can add as many competitors that you require data about in the format and data style you are looking for. Our team of analysts can also provide you data in crude raw excel files pivot tables (Fact book) or can assist you in creating presentations from the data sets available in the report.


