
North America Data Center Busway Market
Market Size in USD Million
 USD
873.32 Million
USD
2,435.83 Million
2025
2033
USD
873.32 Million
USD
2,435.83 Million
2025
2033
| 2026 - 2033 | |
| USD 873.32 Million | |
| USD 2,435.83 Million | |
| % | |
|
What is the North America Data Center Busway Market Size and Growth Rate?
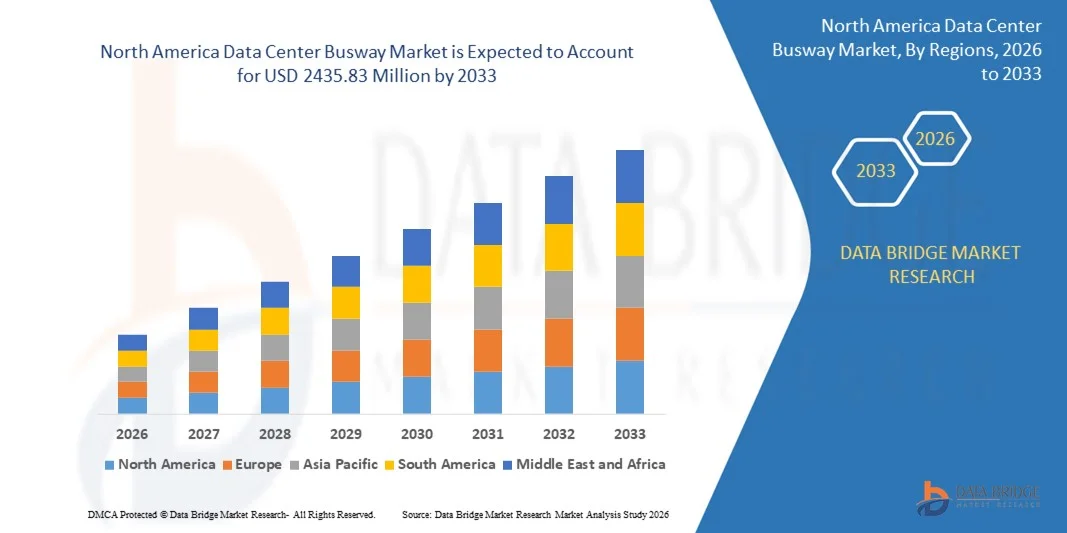
- The North America Data Center Busway market size was valued at USD 873.32 million in 2025 and is expected to reach USD 2435.83 million by 2033, at a CAGR of 13.68% during the forecast period
- This growth is driven by factors such as the increasing adoption of cloud computing, rapid expansion of data centers, and growing emphasis on modular infrastructure
What are the Major Takeaways of Data Center Busway Market?
- The data center busway market is steadily growing due to the increasing need for flexible and reliable power distribution in modern IT infrastructures
- For instance, Equinix expanded its SG5 data center in Singapore in 2024 using advanced busway systems, and Digital Realty integrated similar solutions in its new data center campus in Osaka to support high-capacity power loads
- The shift toward modular and scalable data center designs is driving the adoption of busway systems; for instance, Microsoft’s 2023 data center in Cheyenne, Wyoming, implemented modular busways to enable rapid expansion, and Facebook’s Clonee data center in Ireland used busways to minimize downtime during infrastructure upgrades
- Busways are being preferred over traditional cabling because they reduce cable congestion and improve airflow management in high-density environments
- The U.S. dominated the North America data center busway market with the largest revenue share of 46.8% in 2024, supported by the presence of leading cloud service providers, hyperscale operators, and colocation companies. Massive investments in AI data centers, high-performance computing facilities, and edge infrastructure drive strong demand for high-ampere and modular busway systems
- Canada is witnessing the fastest growth rate of 9.36%, driven by increasing investments in green data centers, government-backed digital infrastructure programs, and expansion of cloud regions by global technology companies
- The Intensive Insulation Plug Busway (CMC) segment dominated the market with a 38.6% share in 2024, driven by its superior insulation performance, compact structure, and high safety standards
Report Scope and Data Center Busway Market Segmentation
|
Attributes |
Data Center Busway Key Market Insights |
|
Segments Covered |
|
|
Countries Covered |
North America
|
|
Key Market Players |
|
|
Market Opportunities |
|
|
Value Added Data Infosets |
In addition to the insights on market scenarios such as market value, growth rate, segmentation, geographical coverage, and major players, the market reports curated by the Data Bridge Market Research also include in-depth expert analysis, pricing analysis, brand share analysis, consumer survey, demography analysis, supply chain analysis, value chain analysis, raw material/consumables overview, vendor selection criteria, PESTLE Analysis, Porter Analysis, and regulatory framework. |
What is the Key Trend in the Data Center Busway Market?
Rising Preference for Plug-and-Play Power Distribution Systems
- Plug-and-play power distribution systems are gaining popularity in data centers for their quick installation and minimal need for complex wiring
- For instance, Digital Realty integrated plug-and-play busway solutions in its Singapore facility to accelerate deployment timelines
- These systems support rapid scalability, allowing data centers to expand or reconfigure power layouts without major downtime
- For instance, Microsoft’s modular data center in Sweden used plug-and-play components to enable seamless upgrades as demand increased
- The modular nature of plug-and-play busways enables hot-swapping, where power units can be added or removed without interrupting ongoing operations, making them ideal for environments that demand high uptime and flexibility
- Data centers benefit from reduced installation time and labor costs when using plug-and-play systems, which is especially valuable during time-sensitive expansions or build-outs
- Many leading manufacturers such as Starline and Schneider Electric are offering advanced plug-and-play busway solutions with integrated safety features and smart monitoring, aligning with the growing demand for user-friendly and efficient power infrastructure in large-scale data centers
What are the Key Drivers of Data Center Busway Market?
- The growing demand for scalable and energy-efficient power distribution is a major driver of the data center busway market, as organizations require flexible infrastructure to meet evolving digital workloads
- Traditional cabling systems often lack the scalability and installation efficiency needed for modern operations, which is why modular busway systems are being adopted for faster, cost-effective power distribution
- For instance, Amazon Web Services in 2023 expanded its data center footprint in Northern Virginia using modular infrastructure, including busway systems, to speed up deployment while optimizing energy efficiency
- Busway systems help reduce cable congestion, enhance airflow, and improve cooling efficiency, which supports sustainability efforts and cuts operational costs
- For instance, Microsoft’s Sweden data center uses streamlined busway systems to maintain sustainable power flow while supporting growing cloud demands
- Major technology providers are now prioritizing power solutions that can scale quickly and reduce downtime, making busway systems a preferred option for hyperscale and enterprise-level data centers
Which Factor is Challenging the Growth of the Data Center Busway Market?
- One of the main challenges in adopting data center busway systems is their high initial cost, which includes equipment, specialized installation, and detailed engineering design that can strain the budgets of small to mid-sized enterprises
- The requirement for custom layouts based on power density, architecture, and operational goals makes these systems complex to design and deploy, especially for facilities that require tailored configurations
- For instance, the deployment of a customized busway in a tier-4 data center operated by Equinix in Singapore involved precision engineering and high-end components to ensure zero downtime and full fault tolerance
- Retrofitting existing data centers presents additional complications due to space limitations and the need to maintain uninterrupted services
- For instance, when a financial institution in London upgraded its legacy facility with busway systems, installation had to be done in phases during off-peak hours to avoid service disruptions
- Although busway systems provide long-term efficiency and maintenance benefits, their steep upfront investment and design complexity continue to act as major restraints for budget-conscious or smaller-scale operations
How is the Data Center Busway Market Segmented?
The market is segmented on the basis of product type, type, implementation, data center type, current ampere, and vertical.
- By Product Type
On the basis of product type, the data center busway market is segmented into Air Splicing Busway (BMC), Intensive Insulation Plug Busway (CMC), High Strength Enclosed Busway (CFW), Power Distribution Units (PDUs), and Others. The Intensive Insulation Plug Busway (CMC) segment dominated the market with a 38.6% share in 2024, driven by its superior insulation performance, compact structure, and high safety standards. These systems are widely adopted in modern data centers due to their efficient power transmission, flexibility in tap-off configurations, and suitability for high-density rack environments. Their modular design supports scalability and simplifies maintenance, making them ideal for enterprise and hyperscale facilities.
The High Strength Enclosed Busway (CFW) segment is projected to witness the fastest CAGR from 2025 to 2032, supported by rising demand for enhanced mechanical durability, higher load capacity, and improved protection in large-scale and mission-critical data centers.
- By Type
On the basis of type, the market is segmented into 3-Phase 4-Wire, 3-Phase 5-Wire, and Others. The 3-Phase 4-Wire segment held the largest market share of 56.8% in 2024, as it remains the standard configuration for efficient and balanced power distribution in most commercial and enterprise data centers. It provides reliable neutral grounding and supports stable load management across server racks and IT equipment. The simplicity, cost-effectiveness, and compatibility with existing electrical infrastructure further contribute to its dominance.
The 3-Phase 5-Wire segment is expected to register the fastest CAGR from 2025 to 2032, driven by increasing adoption in high-density and hyperscale data centers requiring enhanced grounding reliability, improved safety, and support for sensitive IT loads.
- By Implementation
On the basis of implementation, the data center busway market is segmented into Raised Floor and Ceiling Overhead. The Ceiling Overhead segment dominated the market with a 61.3% share in 2024, owing to its flexibility, ease of maintenance, and better airflow management. Overhead systems allow efficient cable routing, simplified scalability, and reduced floor congestion, which is critical in high-density data center environments. This configuration also enhances cooling efficiency and operational safety.
The Raised Floor segment is projected to grow at a steady pace, particularly in legacy and retrofit data centers where existing infrastructure supports underfloor distribution. However, overhead implementation is expected to maintain faster overall expansion due to modern data center design preferences.
- By Data Center Type
On the basis of data center type, the market is segmented into Mid-sized & Enterprise Data Center and Large Data Center. The Large Data Center segment dominated the market with a 64.9% share in 2024, driven by the rapid expansion of hyperscale facilities, cloud service providers, and colocation centers. These facilities require high-capacity, scalable, and efficient power distribution systems to support massive server deployments and high computing workloads.
The Mid-sized & Enterprise Data Center segment is expected to witness the fastest CAGR from 2025 to 2032, fueled by increasing digital transformation among enterprises, rising adoption of edge data centers, and growing investment in private cloud infrastructure.
- By Current Ampere
On the basis of current ampere, the market is segmented into Low and High. The High current segment dominated the market with a 59.4% share in 2024, supported by growing demand for high-power computing, AI workloads, and large-scale cloud infrastructure. Hyperscale data centers require busway systems capable of handling substantial electrical loads efficiently and safely.
The Low current segment is projected to grow at the fastest CAGR from 2025 to 2032, primarily due to rising deployment of modular and edge data centers, which operate at comparatively lower power capacities but require flexible and cost-efficient distribution systems.
- By Vertical
On the basis of vertical, the data center busway market is segmented into Banking, Financial Services and Insurance (BFSI), IT & Telecom, Government & Defence, Healthcare, Retail & E-commerce, Research & Academia, Energy & Utilities, Manufacturing, and Others. The IT & Telecom segment dominated the market with a 41.2% share in 2024, driven by rapid cloud expansion, 5G deployment, data traffic growth, and increasing reliance on digital services. Continuous investments in hyperscale and colocation facilities significantly boost busway adoption.
The Retail & E-commerce segment is expected to register the fastest CAGR from 2025 to 2032, propelled by rising online transactions, digital payment ecosystems, and expansion of regional data centers to support real-time processing and customer data analytics.
Which Region Holds the Largest Share of the Data Center Busway Market?
- The U.S. dominated the North America data center busway market with the largest revenue share of 46.8% in 2024, supported by the presence of leading cloud service providers, hyperscale operators, and colocation companies. Massive investments in AI data centers, high-performance computing facilities, and edge infrastructure drive strong demand for high-ampere and modular busway systems
- Adoption of ceiling overhead installations, scalable plug-in busways, and intelligent power monitoring solutions enhances operational flexibility and efficiency
- Continuous data traffic growth, expansion of 5G networks, and increasing enterprise digital transformation initiatives further strengthen the country’s dominant market position
Canada Data Center Busway Market Insight
Canada is witnessing the fastest growth rate of 9.36%, driven by increasing investments in green data centers, government-backed digital infrastructure programs, and expansion of cloud regions by global technology companies. Rising demand for energy-efficient power distribution systems, coupled with strict environmental regulations, supports adoption of advanced busway solutions. Growth in colocation facilities and edge data centers across major cities enhances the need for flexible and scalable electrical infrastructure. Canada’s focus on renewable energy integration and sustainable data center design positions it as a high-growth market within North America.
Mexico Data Center Busway Market Insight
Mexico is expanding steadily, supported by rising foreign direct investment in digital infrastructure and its strategic role as a nearshore data center hub serving North America. Growth in enterprise IT infrastructure, colocation services, and cloud adoption is increasing demand for reliable and cost-efficient busway systems. Implementation of modular power distribution units, scalable overhead busways, and improved electrical safety systems enhances facility performance. Competitive operational costs and infrastructure modernization initiatives position Mexico as an emerging growth market in the North American Data Center Busway landscape.
Which are the Top Companies in Data Center Busway Market?
The data center busway industry is primarily led by well-established companies, including:
- Texas Instruments Incorporated (U.S.)
- LIHOM XTALS (South Korea)
- Masterclock Inc. (U.S.)
- Renesas Electronics Corporation (Japan)
- Infineon Technologies AG (Germany)
- TXC (Taiwan)
- KYOCERA Corporation (Japan)
- Murata Manufacturing Co., Ltd. (Japan)
- Abracon (U.S.)
- Seiko Epson Corporation (Japan)
- Microchip Technology Inc. (U.S.)
- Rakon Limited (New Zealand)
- NIHON DEMPA KOGYO CO., LTD. (Japan)
- Silicon Laboratories (U.S.)
- SiTime Corp. (U.S.)
- Analog Devices, Inc. (U.S.)
- Vishay Intertechnology, Inc. (U.S.)
What are the Recent Developments in Global Data Center Busway Market?
- In February 2025, Schneider Electric announced the opening of new data center and microgrid testing labs at its Global R&D Center in Massachusetts. This development aims to enhance research and innovation in sustainable energy solutions for data centers and microgrids. The labs will focus on testing advanced power distribution technologies, including energy-efficient systems and renewable integration. The initiative is expected to provide companies with more reliable, sustainable, and scalable energy solutions for their operations. This moves positions Schneider Electric as a leader in advancing energy-efficient infrastructure, impacting the data center market by driving further adoption of green energy technologies and promoting sustainability across industries
- In April 2024, Schneider Electric unveiled the I-Line Track, the next generation of power distribution busway for data centers. This development introduces a more flexible, scalable, and energy-efficient solution for powering data centers, designed to meet the increasing demand for high-performance infrastructure. The I-Line Track allows for quick adjustments to power layouts, making it ideal for rapidly expanding facilities. The system enhances operational efficiency and reduces downtime during installation and upgrades. This innovation is expected to significantly impact the market by driving the adoption of smarter and more adaptable power distribution solutions in data centers globally
- In March 2024, Legrand announced the acquisition of Power Bus Way, a key player in power distribution systems for data centers in North America. This strategic acquisition aims to enhance Legrand's portfolio with advanced busway solutions, positioning the company to better meet the growing demand for energy-efficient and scalable power distribution systems in the data center market. The acquisition will enable Legrand to expand its product offerings and provide more comprehensive solutions to data center operators, driving innovation and supporting the industry's transition to more sustainable energy practices. This move is expected to strengthen Legrand's presence in the North American data center market and contribute to its growth in the global power distribution sector
SKU-

- Interactive Data Analysis Dashboard
- Company Analysis Dashboard for high growth potential opportunities
- Research Analyst Access for customization & queries
- Competitor Analysis with Interactive dashboard
- Latest News, Updates & Trend analysis
- Harness the Power of Benchmark Analysis for Comprehensive Competitor Tracking
Data collection and base year analysis are done using data collection modules with large sample sizes. The stage includes obtaining market information or related data through various sources and strategies. It includes examining and planning all the data acquired from the past in advance. It likewise envelops the examination of information inconsistencies seen across different information sources. The market data is analysed and estimated using market statistical and coherent models. Also, market share analysis and key trend analysis are the major success factors in the market report. To know more, please request an analyst call or drop down your inquiry.
The key research methodology used by DBMR research team is data triangulation which involves data mining, analysis of the impact of data variables on the market and primary (industry expert) validation. Data models include Vendor Positioning Grid, Market Time Line Analysis, Market Overview and Guide, Company Positioning Grid, Patent Analysis, Pricing Analysis, Company Market Share Analysis, Standards of Measurement, Global versus Regional and Vendor Share Analysis. To know more about the research methodology, drop in an inquiry to speak to our industry experts.
Data Bridge Market Research is a leader in advanced formative research. We take pride in servicing our existing and new customers with data and analysis that match and suits their goal. The report can be customized to include price trend analysis of target brands understanding the market for additional countries (ask for the list of countries), clinical trial results data, literature review, refurbished market and product base analysis. Market analysis of target competitors can be analyzed from technology-based analysis to market portfolio strategies. We can add as many competitors that you require data about in the format and data style you are looking for. Our team of analysts can also provide you data in crude raw excel files pivot tables (Fact book) or can assist you in creating presentations from the data sets available in the report.


