
North America Data Center Cooling Market
Market Size in USD Billion
 USD
18.25 Billion
USD
56.62 Billion
2024
2032
USD
18.25 Billion
USD
56.62 Billion
2024
2032
| 2025 - 2032 | |
| USD 18.25 Billion | |
| USD 56.62 Billion | |
| % | |
|
Data Center Cooling Market Analysis
In last few years, data center cooling is being highly deployed by data center operators owing to its numerous characteristics such as cost-effective, energy-efficient, and eco-friendly nature. A rise in the use of 4G LTE networks is being witnessed due to increase in number of data centers. An increase in the number of data centers facilities is favouring the rapid growth data center cooling worldwide. Also, the ongoing shift towards cloud services is generating demand for eco-friendly cooling technology which will boost the demand of the data center cooling
North America Data Center Cooling Market Size
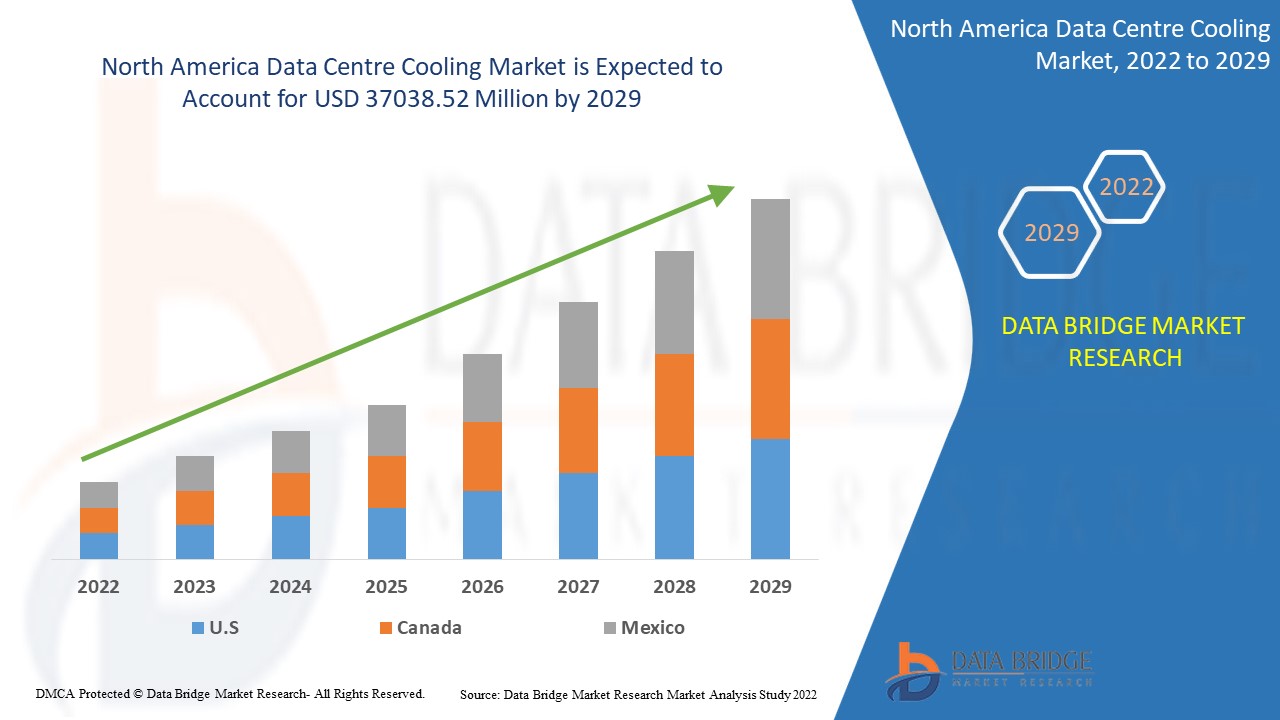
North America data center cooling market size was valued at USD 18.25 billion in 2024 and is projected to reach USD 56.62 billion by 2032, with a CAGR of 15.20% during the forecast period of 2025 to 2032.
Report Scope and Market Segmentation
|
Attributes |
Data Center Cooling Key Market Insights |
|
Segmentation |
|
|
Countries Covered |
U.S., Canada and Mexico |
|
Key Market Players |
Schneider Electric (France), Vertiv Group Corp. (U.S.), STULZ GMBH (Germany), Eaton (U.S.), FUJITSU (Japan), Rittal GmbH & Co. KG (Germany), Daikin Applied (U.S.), Black Box Corporation (U.S.), ALFA LAVAL (Sweden), Nortek Air Solutions, LLC (U.S.), Airedale Air Conditioning (U.K.), 3M (U.S.), Coolcentric (U.S.), Delta Power Solutions (India), and EcoCooling (U.K.) |
|
Market Opportunities |
|
Data Center Cooling Market Definition
The data center cooling is defined as the processes, equipment, collective tools and techniques which helps in ensuring a perfect operating temperature within a data center facility. Data center operators use cooling solutions to maintain a temperature in data centers within a permissible limit. Data centers work proficiently 24/7 to process high chunks of data.
Data Center Cooling Market
Drivers
- Technological innovations
Digitization of customer health records in the form of electronic medical records leads to data increment. The modernization of legacy operating systems and newest medical equipment innovations, such as patient response systems improvements, personnel management, and others, generate a multitude of data that increase the demand for data centers. This need and demand for data centers is expected to boost the demand of the data center cooling and drive the market growth rate.
- Increasing favourable initiatives by governing authorities
The favorable initiatives by governing authorities all over the globe aimed at promoting cloud proliferation are propelling the demand for data centers and consequently creating avenues for the data center cooling market. For instance, the United Arab Emirates (UAE) funded numerous projects related to cloud computing such as Smart Dubai or Smart Abu Dhabi. These projects were targeted at bringing rapid digital transformation among enterprises while favouring the country’s economic growth. Such initiatives by different governments will impel the demand of data center globally, thus flourishing the need for cooling solutions.
Opportunities
- Higher investments associated with digitization
Increasing digitization is helping to create the most significant impact and thus, making huge investments in healthcare technology. For instance, TVM Capital Healthcare in July 2020, increased a second growth capital fund concentrated on investment in the Gulf. This new fund will have a major focus on the GCC, but also Saudi Arabia mainly. The company will look to invest in all ranges of health care, excluding for general hospitals. This has further augmented the generation of data records of patients, which augmented the demand for data center cooling technologies in this region.
Moreover, the requirement for modular data center cooling approach and the emergence of liquid cooling technology increase beneficial opportunities to the major market players during the forecast period of 2025 to 2032.
Restraints
- Issues associated with data center cooling
The requirement of specialized infrastructure and high investment costs are expected to hinder the growth of the data center cooling market. Moreover, issues with cooling during power outage and reduced carbon emissions will act as a biggest challenge to the data center cooling market growth during the forecast period of 2025-2032.
This data center cooling market report provides details of new recent developments, trade regulations, import-export analysis, production analysis, value chain optimization, market share, impact of domestic and localized market players, analyses opportunities in terms of emerging revenue pockets, changes in market regulations, strategic market growth analysis, market size, category market growths, application niches and dominance, product approvals, product launches, geographic expansions, technological innovations in the market. To gain more info on the data center cooling market contact Data Bridge Market Research for an Analyst Brief, our team will help you take an informed market decision to achieve market growth.
Data Center Cooling Market Scope
The data center cooling market is segmented on the basis of type, solutions, service, cooling type and organization size. The growth amongst these segments will help you analyze meagre growth segments in the industries and provide the users with a valuable market overview and market insights to help them make strategic decisions for identifying core market applications.
Type
- Enterprise Data Center
- Edge Data Center
Solutions
- Air Conditioning
- Chilling Units
- Cooling Towers
- Economizer System
- Liquid Cooling System
- Computer Room Air Conditioning (CRAC)
- Computer Room Air Handler CRAH) Control Units
- Others
Service
- Consulting and Training
- Installation and Deployment
- Maintenance And Support
Cooling Type
- Room Based Cooling
- Rack Based Cooling
- Row Based Cooling
Organization Size
- Large Organization
- Small and Medium Organization
Data Center Cooling Market Regional Analysis
The data centre cooling market is analysed and market size insights and trends are provided by country, type, solutions, cooling type, service and organization size as referenced above.
The countries covered in the data centre cooling market report are U.S., Canada and Mexico.
The United States dominates the data centre cooling market due to supporting infrastructure and a strong product offering by solution providers. The North American data centre cooling market is expanding as a result of increased business adoption of IoT technology, which is driving demand for increased data storage and supporting strong network connectivity solutions, which is driving market growth.
The country section of the report also provides individual market impacting factors and changes in market regulation that impact the current and future trends of the market. Data points like down-stream and upstream value chain analysis, technical trends and porter's five forces analysis, case studies are some of the pointers used to forecast the market scenario for individual countries. Also, the presence and availability of North America brands and their challenges faced due to large or scarce competition from local and domestic brands, impact of domestic tariffs and trade routes are considered while providing forecast analysis of the country data.
Data Center Cooling Market Share
The data center cooling market competitive landscape provides details by competitor. Details included are company overview, company financials, revenue generated, market potential, investment in research and development, new market initiatives, Global presence, production sites and facilities, production capacities, company strengths and weaknesses, product launch, product width and breadth, application dominance. The above data points provided are only related to the companies' focus related to data center cooling market.
Data Center Cooling Market Leaders Operating in the Market Are:
- Schneider Electric (France)
- Vertiv Group Corp. (U.S.)
- STULZ GMBH (Germany)
- Eaton (U.S.)
- FUJITSU (Japan)
- Rittal GmbH & Co. KG (Germany)
- Daikin Applied (U.S.)
- Black Box Corporation (U.S.)
- ALFA LAVAL (Sweden)
- Nortek Air Solutions, LLC (U.S.)
- Airedale Air Conditioning (U.K.)
- 3M (U.S.)
- Coolcentric (U.S.)
- Delta Power Solutions (India)
- EcoCooling (U.K.)
Latest Developments in Data Center Cooling Market
- Vertiv Holdings Co. will launch the Vertiv VRC-S in September 2020. The technology is a rack that is integrated with infrastructure support equipment. The product incorporates a rack power distribution unit (rPDU), Vertiv VRC self-contained rack cooling system, and a rack power distribution unit (rPDU) and encloses a standard-sized IT rack.
- In July 2020, Asetek will collaborate with Hewlett Packard Enterprise (HPE). The collaboration aims to deliver premium data centre liquid cooling solutions in HPE Apollo Systems. These systems are density-optimized and high-performance systems aimed at Artificial Intelligence (AI) and high-performance computing (HPC) requirements.
SKU-

- Interactive Data Analysis Dashboard
- Company Analysis Dashboard for high growth potential opportunities
- Research Analyst Access for customization & queries
- Competitor Analysis with Interactive dashboard
- Latest News, Updates & Trend analysis
- Harness the Power of Benchmark Analysis for Comprehensive Competitor Tracking
Data collection and base year analysis are done using data collection modules with large sample sizes. The stage includes obtaining market information or related data through various sources and strategies. It includes examining and planning all the data acquired from the past in advance. It likewise envelops the examination of information inconsistencies seen across different information sources. The market data is analysed and estimated using market statistical and coherent models. Also, market share analysis and key trend analysis are the major success factors in the market report. To know more, please request an analyst call or drop down your inquiry.
The key research methodology used by DBMR research team is data triangulation which involves data mining, analysis of the impact of data variables on the market and primary (industry expert) validation. Data models include Vendor Positioning Grid, Market Time Line Analysis, Market Overview and Guide, Company Positioning Grid, Patent Analysis, Pricing Analysis, Company Market Share Analysis, Standards of Measurement, Global versus Regional and Vendor Share Analysis. To know more about the research methodology, drop in an inquiry to speak to our industry experts.
Data Bridge Market Research is a leader in advanced formative research. We take pride in servicing our existing and new customers with data and analysis that match and suits their goal. The report can be customized to include price trend analysis of target brands understanding the market for additional countries (ask for the list of countries), clinical trial results data, literature review, refurbished market and product base analysis. Market analysis of target competitors can be analyzed from technology-based analysis to market portfolio strategies. We can add as many competitors that you require data about in the format and data style you are looking for. Our team of analysts can also provide you data in crude raw excel files pivot tables (Fact book) or can assist you in creating presentations from the data sets available in the report.


