
North America Digital Mining Market
Market Size in USD Billion
 USD
21.06 Billion
USD
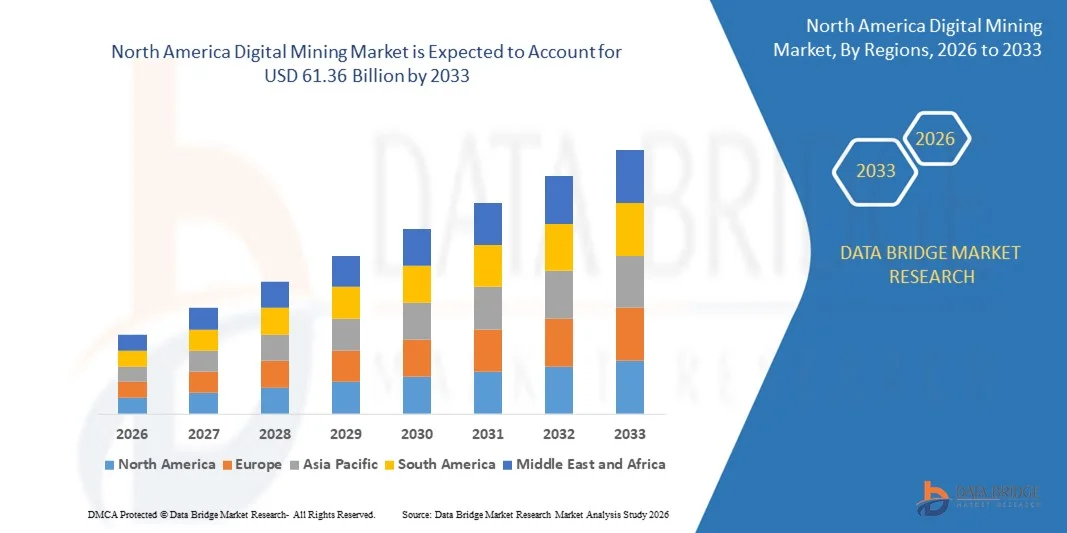
61.36 Billion
2025
2033
USD
21.06 Billion
USD
61.36 Billion
2025
2033
| 2026 - 2033 | |
| USD 21.06 Billion | |
| USD 61.36 Billion | |
| % | |
|
What is the North America Digital Mining Market Size and Growth Rate?
- The North America digital mining market size was valued at USD 21.06 billion in 2025 and is expected to reach USD 61.36 billion by 2033, at a CAGR of 14.3% during the forecast period
- Due to increasing accidents and fatalities, the manufacturers are focusing on the safety concerns and therefore, implementing and installing various safety measures through digital mining to ensure safety of workers, mine plants and environment which is driving the growth of the digital mining market
- Digital mining requires high implementation cost due to which small and medium enterprises hardly afford for their business lines which is restraining the digital mining market growth
What are the Major Takeaways of Digital Mining Market?
- Emergence of internet of things creates need to adopt digital mining which is an opportunity for the growth of the digital mining market
- Adoption of digital mining with lack of technical expertise is a challenge for the digital mining market growth as countries were facing problems of technical skilled labourers due to growing technology and innovation
- U.S. dominated the North America Digital Mining market with an estimated 41.2% revenue share in 2025, driven by strong adoption of digital mining technologies in mineral extraction, oil and gas refining, and chemical processing
- Canada is projected to register the fastest CAGR of around 7.8% during the forecast period, fueled by increasing adoption of digital mining solutions in precious metal extraction, oil sands operations, and industrial minerals
- The Solutions segment dominated the digital mining market with the largest market revenue share of 61.3% in 2024, driven by the growing demand for integrated platforms that provide real-time data, automation, and analytics to optimize mining operations
Report Scope and Digital Mining Market Segmentation
|
Attributes |
Digital Mining Key Market Insights |
|
Segments Covered |
|
|
Countries Covered |
North America
|
|
Key Market Players |
|
|
Market Opportunities |
|
|
Value Added Data Infosets |
In addition to the insights on market scenarios such as market value, growth rate, segmentation, geographical coverage, and major players, the market reports curated by the Data Bridge Market Research also include in-depth expert analysis, pricing analysis, brand share analysis, consumer survey, demography analysis, supply chain analysis, value chain analysis, raw material/consumables overview, vendor selection criteria, PESTLE Analysis, Porter Analysis, and regulatory framework. |
What is the Key Trend in the Digital Mining Market?
AI-Powered Automation and Real-Time Data Transforming Mining Operations
- A significant and accelerating trend in the global digital mining market is the integration of Artificial Intelligence (AI), automation, and real-time data analytics, revolutionizing operational efficiency, safety, and resource optimization in mining
- For instance, companies such as Caterpillar and Komatsu are leveraging AI-powered autonomous haul trucks and drilling systems that improve productivity, reduce operational costs, and enhance safety by minimizing human involvement in hazardous mining tasks
- AI and machine learning are enabling predictive maintenance, anomaly detection, and optimization of equipment performance, significantly reducing downtime and unplanned failures across mining operations
- The integration of digital mining platforms with IoT sensors, advanced telemetry, and AI-driven control centers provides mining companies with real-time visibility into production, equipment health, and environmental conditions
- This trend is fundamentally reshaping expectations for mining operations by offering safer, more efficient, and data-driven decision-making environments. As a result, companies such as Hexagon AB and ABB are developing AI-enabled digital mining solutions with features such as autonomous fleet management, real-time monitoring, and predictive analytics
- The demand for digital mining solutions that enhance operational efficiency, improve safety, and support sustainability goals is rapidly growing across the mining sector, driven by the need to optimize resource extraction in increasingly complex and remote environments
What are the Key Drivers of Digital Mining Market?
- The rising need for operational efficiency, workforce safety, and environmental sustainability in the mining sector is a primary driver for the accelerated adoption of Digital Mining technologies
- For instance, in February 2024, Sandvik AB launched advanced autonomous drilling solutions, enabling mining operations to improve productivity while reducing human exposure to high-risk environments—demonstrating the market's focus on safety and automation
- As resource deposits become harder to access and extraction costs rise, mining companies are adopting digital mining platforms that leverage real-time data, AI, and automation to optimize processes, maximize output, and reduce operational costs
- Moreover, the growing emphasis on sustainable mining practices is encouraging the use of digital mining technologies to monitor environmental impact, reduce emissions, and improve resource efficiency
- The ability to remotely control operations, monitor equipment health, and utilize predictive analytics enhances operational uptime and minimizes unplanned disruptions, making Digital Mining an essential component for modern mining operations
- The rising adoption of IoT, AI, and autonomous equipment, combined with increasing digital literacy and supportive government initiatives in the mining sector, further contributes to the growth of the digital mining market globally
Which Factor is Challenging the Growth of the Digital Mining Market?
- Concerns surrounding cybersecurity risks, high capital investment requirements, and limited digital infrastructure in developing regions pose significant challenges to the broader adoption of digital mining technologies
- For instance, high-profile cyber incidents targeting critical infrastructure have raised awareness about the vulnerability of connected mining systems to cyberattacks, data breaches, and operational disruptions
- Addressing these concerns through robust cybersecurity frameworks, secure network protocols, and real-time threat detection is crucial for building trust among mining companies adopting digital mining solutions
- In addition, the high upfront costs associated with implementing AI, IoT, and automation technologies, combined with the need for specialized technical expertise, can be a barrier, particularly for small- and mid-sized mining operations
- The digital divide in emerging mining regions, where internet connectivity and digital infrastructure remain underdeveloped, further limits the scalability of advanced Digital Mining solutions
- Overcoming these challenges will require increased investment in cybersecurity, workforce training, partnerships between technology providers and mining companies, and the development of more accessible and scalable digital mining platforms to support long-term market growth
How is the Digital Mining Market Segmented?
The market is segmented on the basis of type, components, metal type, mining type, technology, and application.
- By Type
On the basis of type, the digital mining market is segmented into Solutions and Services. The Solutions segment dominated the digital mining market with the largest market revenue share of 61.3% in 2024, driven by the growing demand for integrated platforms that provide real-time data, automation, and analytics to optimize mining operations. Mining companies are increasingly investing in comprehensive digital solutions to improve efficiency, reduce downtime, and enhance safety.
The Services segment is expected to witness the fastest growth rate of 19.4% from 2025 to 2032, fueled by the rising need for consulting, system integration, maintenance, and support services to ensure smooth deployment and management of digital mining technologies. As digital adoption accelerates, service providers play a crucial role in facilitating end-to-end digital transformation in mining operations.
- By Components
On the basis of components, the digital mining market is segmented into Smart Sensors, Autonomous Operations, 3D Printing, Connected Worker, Remote Operations Center, Asset Cyber Security, Integrated Platforms, and Advanced Analytics. The Smart Sensors segment held the largest market revenue share in 2024, driven by their critical role in monitoring equipment, environmental conditions, and operational performance in real-time.
The Autonomous Operations segment is projected to witness the fastest CAGR from 2025 to 2032, as mining companies increasingly adopt self-operating vehicles, drilling equipment, and robotic systems to enhance safety, productivity, and reduce labor dependency, especially in hazardous environments.
- By Metal Type
On the basis of metal type, the digital mining market is segmented into Iron and Ferro Alloys, Non-Ferrous Metals, and Precious Metals. The Iron and Ferro Alloys segment dominated the market with the largest revenue share of 47.6% in 2024, owing to the high demand for these materials in construction, automotive, and industrial sectors, making their extraction a key focus for digital optimization.
The Precious Metals segment is anticipated to experience the fastest growth during the forecast period, driven by increasing global demand for gold, silver, and platinum group metals, along with the rising use of digital solutions to improve efficiency and sustainability in precious metal mining operations.
- By Mining Type
On the basis of mining type, the digital mining market is segmented into Surface Mining and Underground Mining. The Surface Mining segment accounted for the largest market revenue share of 68.9% in 2024, driven by the relatively lower operational complexity, cost-effectiveness, and high volume of mineral extraction possible with surface mining methods.
The Underground Mining segment is expected to witness the fastest CAGR from 2025 to 2032, fueled by the increasing exploration of deep mineral reserves, especially for high-value resources, and the need for advanced digital technologies to enhance safety and operational efficiency in complex underground environments.
- By Technology
On the basis of technology, the digital mining market is segmented into Automation and Robotics, Internet Of Things (IoT), Big Data Analytics, Real-Time Analytics, Artificial Intelligence and Machine Learning, Geographic Information Systems, Automated Drones, Cybersecurity, Blockchain, Virtual Reality and Augmented Reality, and Others. The Internet of Things (IoT) segment dominated the market with the largest revenue share of 26.8% in 2024, driven by the widespread deployment of IoT sensors and connected devices for real-time monitoring and operational optimization.
The Artificial Intelligence and Machine Learning segment is anticipated to grow at the fastest CAGR during the forecast period, supported by increasing use of AI-driven predictive analytics, autonomous equipment, and advanced decision-making tools that enhance productivity, safety, and cost-efficiency in mining operations.
- By Application
On the basis of application, the digital mining market is segmented into Maintenance Planning, Frontline Mobility Solutions, Geo-Fencing Safety, and Others. The Maintenance Planning segment held the largest market revenue share of 39.5% in 2024, as mining companies prioritize predictive maintenance strategies to reduce equipment downtime, extend asset lifespan, and optimize operations.
The Geo-Fencing Safety segment is projected to experience the fastest growth rate from 2025 to 2032, driven by the increasing need to enhance worker safety through location-based alerts, restricted zone enforcement, and real-time tracking in hazardous mining environments.
Which Region Holds the Largest Share of the Digital Mining Market?
- U.S. dominated the North America Digital Mining market with an estimated 41.2% revenue share in 2025, driven by strong adoption of digital mining technologies in mineral extraction, oil and gas refining, and chemical processing. The country’s advanced industrial infrastructure, presence of major mining and chemical corporations, and continuous investments in automation, predictive maintenance, and smart mining platforms strengthen its market leadership
- High concentration of R&D centers, collaboration between technology providers, mining operators, and software solution companies, and continuous innovation in AI-driven analytics, IoT-based monitoring, and cloud-enabled mining platforms further reinforce the U.S.’s dominance in North America’s Digital Mining market
- Growing focus on environmental compliance, sustainable mining practices, and implementation of Industry 4.0 solutions across extraction, beneficiation, and processing units supports long-term growth in the U.S. and neighboring North American countries
Canada Digital Mining Market Insight
Canada is projected to register the fastest CAGR of around 7.8% during the forecast period, fueled by increasing adoption of digital mining solutions in precious metal extraction, oil sands operations, and industrial minerals. Investments in autonomous equipment, predictive maintenance, and digital monitoring systems are driving rapid market expansion.
Mexico Digital Mining Market Insight
Mexico is witnessing steady growth in the Digital Mining market, supported by rising demand for smart monitoring of mining operations, automation of ore processing, and operational efficiency initiatives. Focus on compliance with environmental standards, modernization of mining infrastructure, and adoption of IoT and cloud-based analytics continues to boost market development.
Which are the Top Companies in Digital Mining Market?
The digital mining industry is primarily led by well-established companies, including:
- ABB (Switzerland)
- Siemens (Germany)
- Rockwell Automation, Inc. (U.S.)
- SAP SE (Germany)
- Wipro Limited (India)
- Wencomine (a subsidiary of Hitachi Construction Machinery Co., Ltd.) (Japan)
- Cisco (U.S.)
- Caterpillar (U.S.)
- General Electric (U.S.)
- Sandvik AB (Sweden)
- Hexagon AB (a subsidiary of HEXAGON) (Sweden)
- IBM Corporation (U.S.)
- Hatch Ltd. (Canada)
- Wabtec Corporation (U.S.)
- Komatsu Mining Corp. (a subsidiary of Komatsu Ltd.) (U.S.)
- Accenture (Ireland)
- Trimble Inc. (U.S.)
- Schneider Electric (France)
- BENTLEY SYSTEMS, INCORPORATED (U.S.)
- Tech Mahindra Limited (India)
What are the Recent Developments in Global Smart Shelf Management Market?
- In June 2022, Metso Outotec collaborated with Dynamox to integrate its condition monitoring platform into mining processes, extending the solution to its equipment base for improved operational efficiency. Dynamox contributes to developing user-friendly and sustainable digital solutions, advancing mining with AI and analytics
- In May 2022, Epiroc launched the Boomer S10 S, a drilling equipment enhancing mine development productivity with near-surgical precision. Offering up to 25% more efficiency than traditional jumbos, it brings significant cost savings, revolutionizing mining operations
- In October 2020, SAP SE launched SAP S/4HANA Cloud, a platform fostering innovation across industries and business lines, supporting intelligent enterprise solutions. This move strengthens SAP's product portfolio, aiding market growth with new features and enhancements
- In June 2020, Wencomine collaborated with Oxbotica to develop an open autonomy solution for mining, allowing customers to integrate various open standards-based vehicles into their operations. This collaboration enhances Wencomine's offerings, fostering market growth through versatile and adaptable solutions
- In April 2020, Cisco announced its intent to acquire Fluidmesh Networks, LLC, a provider of wireless backhaul systems. This acquisition aims to leverage Fluidmesh's solutions for improving safety and reducing costs in mission-critical applications such as mines, enhancing Cisco's market offerings
SKU-

- Interactive Data Analysis Dashboard
- Company Analysis Dashboard for high growth potential opportunities
- Research Analyst Access for customization & queries
- Competitor Analysis with Interactive dashboard
- Latest News, Updates & Trend analysis
- Harness the Power of Benchmark Analysis for Comprehensive Competitor Tracking
Data collection and base year analysis are done using data collection modules with large sample sizes. The stage includes obtaining market information or related data through various sources and strategies. It includes examining and planning all the data acquired from the past in advance. It likewise envelops the examination of information inconsistencies seen across different information sources. The market data is analysed and estimated using market statistical and coherent models. Also, market share analysis and key trend analysis are the major success factors in the market report. To know more, please request an analyst call or drop down your inquiry.
The key research methodology used by DBMR research team is data triangulation which involves data mining, analysis of the impact of data variables on the market and primary (industry expert) validation. Data models include Vendor Positioning Grid, Market Time Line Analysis, Market Overview and Guide, Company Positioning Grid, Patent Analysis, Pricing Analysis, Company Market Share Analysis, Standards of Measurement, Global versus Regional and Vendor Share Analysis. To know more about the research methodology, drop in an inquiry to speak to our industry experts.
Data Bridge Market Research is a leader in advanced formative research. We take pride in servicing our existing and new customers with data and analysis that match and suits their goal. The report can be customized to include price trend analysis of target brands understanding the market for additional countries (ask for the list of countries), clinical trial results data, literature review, refurbished market and product base analysis. Market analysis of target competitors can be analyzed from technology-based analysis to market portfolio strategies. We can add as many competitors that you require data about in the format and data style you are looking for. Our team of analysts can also provide you data in crude raw excel files pivot tables (Fact book) or can assist you in creating presentations from the data sets available in the report.


