
North America Digital Signage Software Market
Market Size in USD Billion
 USD
3.28 Billion
USD
8.19 Billion
2025
2033
USD
3.28 Billion
USD
8.19 Billion
2025
2033
| 2026 - 2033 | |
| USD 3.28 Billion | |
| USD 8.19 Billion | |
| % | |
|
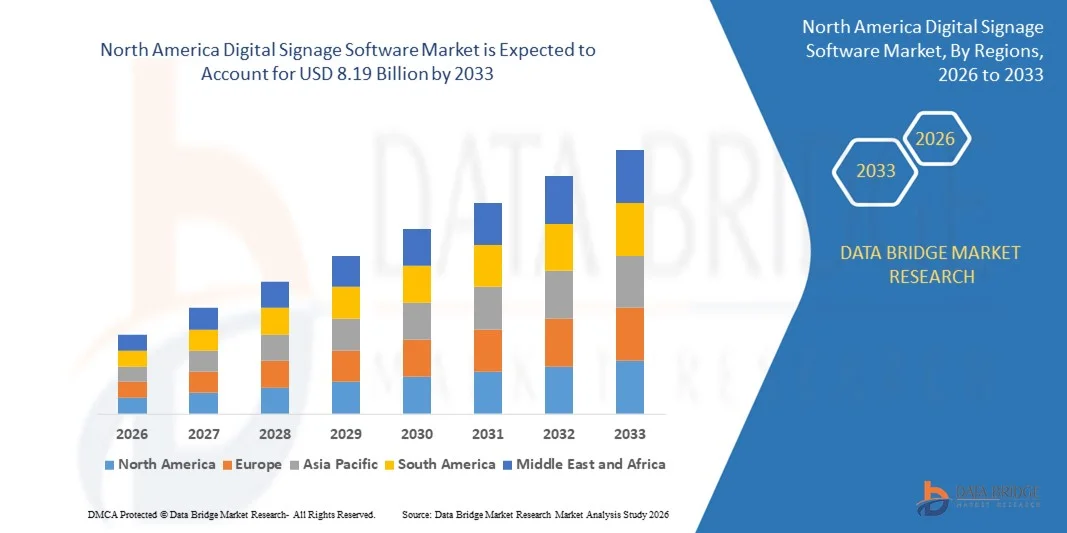
North America Digital Signage Software Market Size
- The North America digital signage software market size was valued at USD 3.28 billion in 2025 and is expected to reach USD 8.19 billion by 2033, at a CAGR of 12.1% during the forecast period
- The market growth is largely fueled by the rising adoption of cloud-enabled display management platforms and the rapid expansion of digital advertising networks across retail, transportation, and corporate environments, driving stronger demand for automated, real-time content delivery solutions
- Furthermore, increasing end-user expectations for dynamic, data-driven, and remotely manageable communication systems is positioning digital signage software as a core component of modern customer engagement strategies, leading to accelerated integration across commercial and public infrastructure
North America Digital Signage Software Market Analysis
- Digital signage software, which enables centralized control, scheduling, and distribution of multimedia content across digital displays, is becoming essential for businesses aiming to enhance audience engagement through visually rich and context-aware communication
- The escalating demand for digital signage software is primarily fueled by the expansion of programmatic digital out-of-home advertising, the rise of interactive and sensor-based displays, and the shift toward cloud-based CMS platforms that offer scalability, automation, and advanced analytics
- U.S. dominated the digital signage software market in 2025, due to its strong base of technology adopters, extensive commercial infrastructure, and high penetration of cloud-enabled media management platforms
- Canada is expected to be the fastest growing country in the digital signage software market during the forecast period due to increasing modernization of retail environments, rising adoption of cloud-based CMS platforms, and strong government focus on smart infrastructure
- Solution segment dominated the market with a market share of 68.9% in 2025, due to its central role in managing content scheduling, remote display control, and multi-device integration, which are essential for enterprises scaling their visual communication networks. Organizations rely heavily on comprehensive software platforms to streamline content workflows and improve customer engagement in high-traffic environments. Strong demand also comes from retail and transportation sectors that prioritize advanced features such as analytics dashboards, real-time content updates, and automated campaign management
Report Scope and Digital Signage Software Market Segmentation
|
Attributes |
Digital Signage Software Key Market Insights |
|
Segments Covered |
|
|
Countries Covered |
North America
|
|
Key Market Players |
|
|
Market Opportunities |
|
|
Value Added Data Infosets |
In addition to the market insights such as market value, growth rate, market segments, geographical coverage, market players, and market scenario, the market report curated by the Data Bridge Market Research team includes in-depth expert analysis, import/export analysis, pricing analysis, production consumption analysis, and pestle analysis. |
North America Digital Signage Software Market Trends
Growing Deployment of Cloud-Based Digital Signage Software
- The increasing shift toward cloud-based digital signage software is a major trend driving market expansion as businesses prioritize scalable, remotely manageable, and cost-efficient platforms for content delivery. Cloud deployment is enabling organizations to update displays across multiple locations in real time, strengthening operational agility and responsiveness.
- For instance, Samsung’s MagicINFO Cloud provides centralized content control and automated updates, allowing enterprises to manage thousands of displays without on-site servers. This instance showcases how cloud ecosystems reduce IT burden while improving efficiency for large digital signage networks.
- The trend is further supported by the rising need for consistent and synchronized content delivery across retail stores, transportation hubs, and corporate environments, where cloud platforms offer superior uptime and flexibility
- The ability of cloud-based systems to integrate with data-driven content sources such as live dashboards, social media feeds, and advertising analytics is also improving user engagement. These advantages are accelerating the transition from traditional on-premise software toward cloud architectures, ultimately positioning cloud-based digital signage solutions as the preferred choice for long-term digital transformation strategies.
- Cloud-enabled signage networks are increasingly becoming the backbone of modern communication infrastructures, and this shift is expected to continue strengthening as organizations seek high performance, automation, and centralized control in their digital display ecosystems
North America Digital Signage Software Market Dynamics
Driver
Rising Demand for Real-Time and Dynamic Content Management
- The rising emphasis on delivering real-time, dynamic, and context-driven content is a significant driver fueling the digital signage software market as businesses aim to enhance customer engagement through responsive visual communication. Modern signage platforms allow instantaneous content updates, enabling retailers, transportation operators, and corporate users to display timely information that aligns with audience behavior and environmental conditions.
- For instance, Scala’s digital signage solutions enable enterprises to update promotional content across multiple locations instantly, helping brands maintain relevance in fast-changing environments. Such instances demonstrate how dynamic content automation strengthens communication efficiency for various industries.
- The growing need for data-integrated content such as inventory-based promotions, live analytics, and automated scheduling is further increasing demand for advanced signage software
- Organizations are utilizing real-time dashboards and AI-driven triggers to create more personalized experiences for viewers, which enhances brand interaction. As sectors such as retail, hospitality, and transportation continue digital modernization, the ability to manage dynamic content centrally is becoming essential for operational and marketing effectiveness
- The overall shift toward intelligent, adaptive display systems is solidifying real-time content management as a core market growth catalyst
Restraint/Challenge
High Initial Integration Costs and Technical Complexity
- High initial integration costs and the technical complexity associated with implementing digital signage software present a significant challenge for market growth. Many organizations must invest in compatible hardware, content management platforms, networking infrastructure, and IT expertise, which can create financial and operational barriers.
- For instance, businesses adopting advanced video walls or interactive display networks often face elevated costs due to specialized installation requirements and multi-system integration involving vendors such as LG and Panasonic. This instance highlights how deployment complexity can hinder adoption, especially for mid-sized enterprises.
- The need for skilled personnel to manage software configurations, content scheduling, and ongoing maintenance further increases operational complexity
- Smaller businesses may struggle to sustain the technical demands associated with large-scale signage networks. Integration with legacy systems can also create compatibility challenges that slow down implementation timelines. Despite the benefits of digital signage, these cost and complexity concerns can deter broad adoption in cost-sensitive sectors
- Addressing these barriers through simplified deployment models and cost-efficient solutions will remain critical for long-term market expansion
North America Digital Signage Software Market Scope
The market is segmented on the basis of offering, deployment model, type, operating device, pricing model, application, and end-user.
- By Offering
On the basis of offering, the digital signage software market is segmented into solution and services. The solution segment dominated the market with the largest share of 68.9% in 2025 due to its central role in managing content scheduling, remote display control, and multi-device integration, which are essential for enterprises scaling their visual communication networks. Organizations rely heavily on comprehensive software platforms to streamline content workflows and improve customer engagement in high-traffic environments. Strong demand also comes from retail and transportation sectors that prioritize advanced features such as analytics dashboards, real-time content updates, and automated campaign management.
The services segment is projected to witness the fastest growth from 2026 to 2033 as businesses increasingly outsource technical support, content design, and deployment management to specialized providers. Growing complexity in networked display infrastructures encourages companies to rely on service vendors for installation, maintenance, and long-term monitoring. This shift is supported by rising adoption among small and mid-sized businesses that require expert assistance without building in-house technical teams.
- By Deployment Model
On the basis of deployment model, the market is segmented into cloud and on-premise. The cloud segment dominated in 2025 due to its scalability, lower upfront costs, and ability to support multi-location content synchronization across wide networks. Enterprises prefer cloud-based platforms for centralized control, automatic software updates, and seamless remote troubleshooting. The shift toward distributed workforces and expanding retail chains further strengthens cloud adoption because organizations need consistent control over dispersed display systems.
The on-premise segment is expected to witness the fastest growth from 2026 to 2033, supported by industries that require heightened security and local data governance. Sectors such as banking, defense, and government prioritize on-premise deployment to maintain strict control over internal servers and sensitive content assets. Advances in secure local network management and customizable features also make on-premise systems increasingly attractive for organizations seeking tailored, self-managed infrastructure.
- By Type
On the basis of type, the market is segmented into proprietary and standard. The proprietary segment dominated in 2025 because vendors offer tightly integrated ecosystems with enhanced reliability, consistent updates, and specialized features designed for complex deployments. Large enterprises often choose proprietary systems to ensure stable performance, premium support, and compatibility with vendor-specific hardware ecosystems. This preference is reinforced by the need for robust security protocols that reduce vulnerabilities across networked displays.
The standard segment is anticipated to record the fastest growth from 2026 to 2033 as market demand shifts toward cost-effective, interoperable solutions that integrate easily with third-party hardware and open-source platforms. Businesses increasingly seek flexible systems enabling them to scale without vendor lock-in, especially in dynamic retail and hospitality environments. The expanding adoption of open standards also encourages faster innovation and broader ecosystem participation.
- By Operating Device
On the basis of operating device, the digital signage software market is segmented into smartphone, MAC, and Windows. The Windows segment dominated in 2025 due to its long-standing presence in enterprise environments and compatibility with a wide range of media players and display controllers. Businesses value Windows-based systems for their stability, familiar interface, and extensive software library supporting heavy content playback. The large installed base of Windows devices across corporate and institutional settings strengthens this leadership.
The smartphone segment is expected to witness the fastest growth from 2026 to 2033, driven by increasing use of mobile-based control dashboards, remote monitoring apps, and BYOD-friendly management tools. Smartphones allow quick content adjustments and real-time troubleshooting without requiring dedicated workstations. The convenience and portability of mobile interfaces make them ideal for decentralized teams, franchise operators, and field technicians.
- By Pricing Model
On the basis of pricing model, the market is segmented into free and subscription-based. The subscription-based segment dominated in 2025 owing to strong enterprise demand for ongoing feature updates, cloud hosting, analytics tools, and dedicated technical support. Businesses prefer predictable monthly or annual fees that align with operational budgets while ensuring continuous access to advanced capabilities. This model also supports scalability, enabling companies to expand display networks without major one-time expenses.
The free segment is projected to experience the fastest growth from 2026 to 2033 as small businesses, startups, and individual users adopt entry-level digital signage solutions with basic content control. Free platforms appeal to cost-sensitive users seeking simple setup and lightweight functionality for small-scale advertising or internal communication. Rising demand for low-cost experimentation also contributes to the expansion of this category.
- By Application
On the basis of application, the market is segmented into indoor advertisement and outdoor advertisement. The indoor advertisement segment dominated in 2025 because shopping malls, retail stores, airports, and corporate buildings increasingly deploy dynamic displays to improve visitor engagement and optimize promotional messaging. Indoor environments benefit from controlled lighting, longer viewer dwell times, and higher content visibility, making software-driven digital displays more impactful. Growth in retail digitization continues to strengthen this segment’s position.
The outdoor advertisement segment is expected to witness the fastest growth from 2026 to 2033 as brands expand their DOOH campaigns and invest in weather-resistant, high-brightness display networks. Advanced software enables real-time updates, geotargeted content, and programmatic ad buying, enhancing campaign performance in public environments. Expanding smart city initiatives and transportation hubs further accelerate outdoor digital signage adoption.
- By End-User
On the basis of end-user, the market is segmented into industrial, commercial, government, infrastructural, and institutional. The commercial segment dominated in 2025 driven by strong adoption across retail, hospitality, and transportation, where digital displays improve customer experience and streamline promotional strategies. Businesses rely on advanced software platforms for content automation, multi-location synchronization, and interactive advertising. This segment also benefits from rapid expansion of experiential marketing initiatives.
The infrastructural segment is projected to register the fastest growth from 2026 to 2033 as airports, metro stations, and public transport networks increasingly deploy digital signage for real-time information delivery. Infrastructure operators prioritize robust software capable of managing high volumes of dynamic content, emergency alerts, and passenger communication. Rising investment in modernizing public utilities supports widespread software upgrades throughout transportation corridors.
North America Digital Signage Software Market Regional Analysis
- U.S. dominated the digital signage software market with the largest revenue share in 2025, driven by its strong base of technology adopters, extensive commercial infrastructure, and high penetration of cloud-enabled media management platforms
- Widespread digital transformation across retail, transportation, hospitality, and corporate sectors, combined with heavy investments in real-time content automation and analytics-driven signage networks, reinforces the U.S. position as the leading regional market
- The presence of major digital signage software providers, continuous upgrades in advertising technologies, and the expanding use of data-driven display solutions for brand engagement ensure that the U.S. maintains its dominant role during the forecast period. Growing demand for interactive in-store experiences and rising adoption of AI-supported content personalization further strengthen market growth across major metropolitan regions
Canada Digital Signage Software Market Insight
Canada is projected to register the fastest CAGR in the North America digital signage software market from 2026 to 2033, supported by increasing modernization of retail environments, rising adoption of cloud-based CMS platforms, and strong government focus on smart infrastructure. Canadian businesses are rapidly shifting toward dynamic, automated, and energy-efficient display solutions to enhance customer engagement and improve operational efficiency. The growing popularity of digital menu boards, corporate communication displays, and transit information systems is boosting software demand nationwide. Partnerships between Canadian integrators and global digital signage software vendors, along with expansion of 4K/8K display networks, reinforce Canada’s emergence as the fastest-growing market in the region.
Mexico Digital Signage Software Market Insight
Mexico is expected to grow steadily from 2026 to 2033, driven by expanding retail modernization, increasing investment in digital advertising, and rising adoption of signage networks across transportation hubs and hospitality sectors. Growing urbanization, strengthening broadband penetration, and rising focus on customer-centric digital communication are supporting consistent software adoption. The presence of regional system integrators, coupled with growing deployments in shopping malls, quick-service restaurants, and corporate offices, is improving market accessibility. Mexico’s gradual transition toward cloud-based content management and remote display monitoring continues to support steady growth across the forecast period.
North America Digital Signage Software Market Share
The digital signage software industry is primarily led by well-established companies, including:
- Panasonic Corporation (Japan)
- LG Display Co., Ltd (South Korea)
- HannStar Display Corporation (Taiwan)
- AU Optronics Corp. (Taiwan)
- Chi Mei Corporation. (Taiwan)
- SAMSUNG (South Korea)
- SHARP CORPORATION (Japan)
- Schneider Electric (France)
- Siemens (Germany)
- Mitsubishi Electric Corporation (Japan)
- SONY INDIA. (India)
- FUJITSU (Japan)
- Chunghwa Picture Tubes, LTD. (Taiwan)
Latest Developments in North America Digital Signage Software Market
- In October 2025, SpinetiX introduced its cloud-native SpinetiX HUB platform which transformed how enterprises manage digital signage networks through unified hardware, content, and user-level control. This development streamlined deployment and monitoring for large organisations reducing technical complexity and accelerating adoption of centrally managed signage systems. The platform’s ability to integrate seamlessly with existing infrastructures strengthened SpinetiX’s market penetration among corporates and institutions
- In August 2025, Navori Labs acquired Signagelive which strengthened its influence in the digital signage software landscape by creating one of the largest independent CMS-focused ecosystems. This development enhanced the company’s ability to deliver scalable, API-driven, and data-intelligent signage platforms, enabling businesses to manage multi-location networks with higher operational efficiency and improved content automation. The consolidation also expanded customer reach and positioned the combined entity as a stronger competitor in enterprise-grade deployments
- In May 2022, Google expanded its Privacy Sandbox initiative which influenced the digital signage software market by promoting more privacy-centric data usage and reducing dependency on third-party tracking. This shift encouraged signage software providers to adapt their audience-targeting tools toward compliant, contextual, and behaviour-based models, improving long-term market trust and regulatory alignment
- In August 2021, Amazon Advertising broadened its Sponsored Display offering which elevated capabilities for targeted, behaviour-driven advertising displayed across digital signage networks. This expansion allowed signage operators and advertisers to deliver more personalised campaigns based on shopping behaviour and product interactions enhancing relevance and strengthening digital signage as a measurable advertising channel
- In July 2020, LG launched its LSAA LED signage series which impacted the market by introducing one of the most advanced modular LED display systems with cable-less block assembly. This development enabled faster installation, improved visual performance, and enhanced integration flexibility which boosted demand among enterprises, transportation hubs, and retailers seeking premium digital signage solutions
SKU-

- Interactive Data Analysis Dashboard
- Company Analysis Dashboard for high growth potential opportunities
- Research Analyst Access for customization & queries
- Competitor Analysis with Interactive dashboard
- Latest News, Updates & Trend analysis
- Harness the Power of Benchmark Analysis for Comprehensive Competitor Tracking
Data collection and base year analysis are done using data collection modules with large sample sizes. The stage includes obtaining market information or related data through various sources and strategies. It includes examining and planning all the data acquired from the past in advance. It likewise envelops the examination of information inconsistencies seen across different information sources. The market data is analysed and estimated using market statistical and coherent models. Also, market share analysis and key trend analysis are the major success factors in the market report. To know more, please request an analyst call or drop down your inquiry.
The key research methodology used by DBMR research team is data triangulation which involves data mining, analysis of the impact of data variables on the market and primary (industry expert) validation. Data models include Vendor Positioning Grid, Market Time Line Analysis, Market Overview and Guide, Company Positioning Grid, Patent Analysis, Pricing Analysis, Company Market Share Analysis, Standards of Measurement, Global versus Regional and Vendor Share Analysis. To know more about the research methodology, drop in an inquiry to speak to our industry experts.
Data Bridge Market Research is a leader in advanced formative research. We take pride in servicing our existing and new customers with data and analysis that match and suits their goal. The report can be customized to include price trend analysis of target brands understanding the market for additional countries (ask for the list of countries), clinical trial results data, literature review, refurbished market and product base analysis. Market analysis of target competitors can be analyzed from technology-based analysis to market portfolio strategies. We can add as many competitors that you require data about in the format and data style you are looking for. Our team of analysts can also provide you data in crude raw excel files pivot tables (Fact book) or can assist you in creating presentations from the data sets available in the report.


