
North America Electrical Steel Market
Market Size in USD Billion
 USD
4.22 Billion
USD
6.94 Billion
2024
2032
USD
4.22 Billion
USD
6.94 Billion
2024
2032
| 2025 - 2032 | |
| USD 4.22 Billion | |
| USD 6.94 Billion | |
| % | |
|
Electrical Steel Market Size
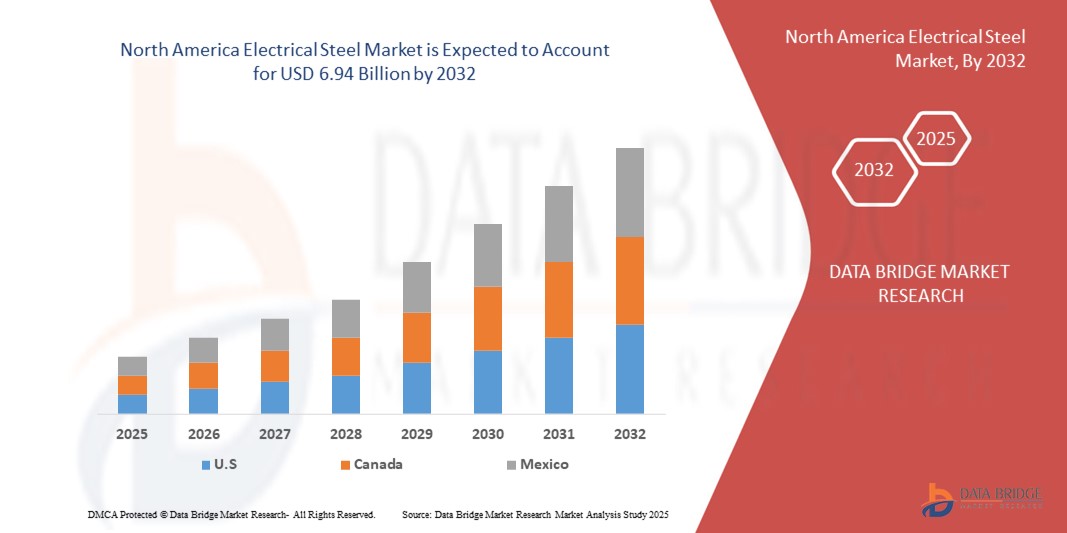
- The North America electrical steel market size was valued at USD 4.22 billion in 2024 and is expected to reach USD 6.94 billion by 2032, at a CAGR of 6.4% during the forecast period
- The market growth is primarily driven by increasing demand for energy-efficient electrical equipment, advancements in electric vehicle (EV) production, and the expansion of renewable energy infrastructure
- In addition, the rising focus on reducing core losses in transformers and motors, coupled with technological advancements in electrical steel manufacturing, is accelerating market adoption across various industries
Electrical Steel Market Analysis
- Electrical steel, known for its high magnetic permeability and low core losses, is a critical material used in the production of motors, transformers, and power generators, supporting energy efficiency and performance in electrical systems
- The growing demand for electrical steel is fueled by the rapid expansion of the automotive sector, particularly in electric vehicles, and the increasing deployment of renewable energy sources such as wind and solar power
- Canada dominated the North America electrical steel market with the largest revenue share of 45.12% in 2024, driven by its robust energy and power sector, significant investments in renewable energy, and a well-established manufacturing base
- The U.S. is expected to be the fastest-growing country in the North America electrical steel market during the forecast period, propelled by the rising adoption of electric vehicles, government incentives for clean energy, and innovations in electrical steel applications
- The Non-Grain Oriented Electrical Steel segment dominated the largest market revenue share of 56.49% in 2023, driven by its versatile applications in electric motors, generators, and household appliances, particularly in the U.S., where demand for electric vehicles (EVs) and energy-efficient devices is surging
Report Scope and Electrical Steel Market Segmentation
|
Attributes |
Electrical Steel Key Market Insights |
|
Segments Covered |
|
|
Countries Covered |
North America
Europe
Asia-Pacific
Middle East and Africa
South America
|
|
Key Market Players |
|
|
Market Opportunities |
|
|
Value Added Data Infosets |
In addition to the insights on market scenarios such as market value, growth rate, segmentation, geographical coverage, and major players, the market reports curated by the Data Bridge Market Research also include import export analysis, production capacity overview, production consumption analysis, price trend analysis, climate change scenario, supply chain analysis, value chain analysis, raw material/consumables overview, vendor selection criteria, PESTLE Analysis, Porter Analysis, and regulatory framework. |
Electrical Steel Market Trends
“Increasing Integration of Advanced Materials and Manufacturing Technologies”
- The North America electrical steel market is experiencing a significant trend toward the integration of advanced materials and innovative manufacturing technologies
- These advancements, such as improved alloy formulations and enhanced processing techniques such as thin slab casting and continuous annealing, optimize magnetic properties, including high permeability and low core losses
- Advanced electrical steel solutions enable more efficient energy conversion, reducing energy losses in applications such as transformers and electric motors.
- For instance, manufacturers are developing high-grade non-grain oriented electrical steel (NGOES) with superior magnetic properties to meet the demands of high-performance electric vehicle (EV) motors and renewable energy systems
- This trend enhances the efficiency and sustainability of electrical steel applications, making them increasingly attractive to industries such as automotive and energy
- New insulating coatings and varnishes with improved thermal and electrical properties are being developed to further reduce core losses and enhance the performance of electrical steel laminations
Electrical Steel Market Dynamics
Driver
“Rising Demand for Electric Vehicles and Renewable Energy Infrastructure”
- The growing consumer and industrial demand for electric vehicles (EVs) and renewable energy sources, such as wind and solar power, is a major driver for the North America electrical steel market
- Electrical steel is critical for manufacturing energy-efficient transformers, motors, and generators, which are essential components in EVs and renewable energy systems
- Government mandates, particularly in Canada and the U.S., promoting energy efficiency and sustainable energy solutions, are accelerating the adoption of electrical steel
- The proliferation of smart grid technologies and the modernization of electrical infrastructure in North America further support the expansion of electrical steel applications, enabling efficient power distribution and transmission
- Automakers and energy companies are increasingly incorporating high-performance electrical steel, such as NGOES, to meet stringent efficiency standards and enhance system performance
- Canada dominates the market due to its leadership in renewable energy adoption and infrastructure development, while the U.S. is the fastest-growing country, driven by robust EV production and power generation advancements
Restraint/Challenge
“High Production Costs and Supply Chain Volatility”
- The significant initial investment required for producing high-quality electrical steel, including advanced manufacturing equipment and raw materials such as ferrosilicon, poses a barrier to market growth, particularly in cost-sensitive regions
- The complexity of producing thin-gauge electrical steel with precise magnetic properties increases production costs, which can deter adoption in some applications
- Supply chain disruptions, such as fluctuations in raw material availability and prices, further complicate production and impact market stability
- In addition, concerns over environmental regulations and compliance with sustainability standards add complexity to manufacturing processes, increasing operational costs
- These factors can limit market expansion, particularly in emerging applications where cost sensitivity is a significant concern
- Despite these challenges, ongoing advancements in manufacturing efficiency and recycling methods are helping to mitigate some of these constraints, aligning with North America’s focus on sustainability
Electrical Steel market Scope
The market is segmented on the basis of type, thickness, core losses, flux density, application, and end-user.
- By Type
On the basis of type, the North America electrical steel market is segmented into Non-Grain Oriented Electrical Steel (NGOES) and Grain Oriented Electrical Steel (GOES). The Non-Grain Oriented Electrical Steel segment dominated the largest market revenue share of 56.49% in 2023, driven by its versatile applications in electric motors, generators, and household appliances, particularly in the U.S., where demand for electric vehicles (EVs) and energy-efficient devices is surging. Its isotropic magnetic properties make it ideal for rotating machinery, enhancing efficiency and performance.
The Grain Oriented Electrical Steel segment is expected to witness the fastest growth rate of 6.7% from 2025 to 2032, fueled by increasing demand for energy-efficient transformers in power distribution networks. Technological advancements in GOES, such as improved magnetic properties and reduced core losses, further drive its adoption in high-performance applications such as large transformers and generators.
- By Thickness
On the basis of thickness, the North America electrical steel market is segmented into 0.23 MM, 0.27 MM, 0.30 MM, 0.35 MM, 0.5 MM, 0.65 MM, and others. The 0.23 MM segment is expected to dominate with a market share of 42.52% in 2024, owing to its widespread use in small transformers, motors, and household appliances such as refrigerators and air conditioners, where superior efficiency in reducing core losses is critical.
The 0.30 MM segment is anticipated to experience the fastest growth rate of 7.2% from 2025 to 2032, driven by increasing demand in the automotive industry, particularly for electric vehicle motors, where this thickness offers a balance of magnetic performance and mechanical strength.
- By Core Losses
On the basis of core losses, the North America electrical steel market is segmented into Less than 0.9 W/KG, 0.90 W/KG to 0.99 W/KG, 1.00 W/KG to 1.29 W/KG, 1.30 W/KG to 1.39 W/KG, and Above 1.39 W/KG. The Less than 0.9 W/KG segment is expected to hold the largest market share of 43.14% in 2024, as low core loss electrical steel is critical for high-efficiency applications such as transformers and EV motors, aligning with the region’s focus on energy efficiency and sustainability.
The 0.90 W/KG to 0.99 W/KG segment is projected to grow rapidly from 2025 to 2032, driven by its use in cost-effective, high-performance motors and generators, particularly in Canada’s renewable energy sector, where energy-efficient materials are in high demand.
- By Flux Density
On the basis of flux density, the North America electrical steel market is segmented into Above 1.76 Tesla, 1.73 Tesla to 1.76 Tesla, 1.69 Tesla to 1.73 Tesla, 1.65 Tesla to 1.69 Tesla, and Less than 1.65 Tesla. The Above 1.76 Tesla segment is expected to dominate with a market share of 605.04% in 2024, driven by its critical role in power generation industries, particularly in the U.S., where high flux density materials are used in advanced transformers and generators to support grid modernization.
The 1.73 Tesla to 1.76 Tesla segment is expected to witness significant growth from 2025 to 2032, as it caters to the growing demand for efficient electrical steel in EV motors and renewable energy applications, where high magnetic performance is essential.
- By Application
On the basis of application, the North America electrical steel market is segmented into Motors, Transformers, Power Generators, Inductors, Electrical Ballasts, Battery, Convertors, Shunt Reactors, Wound Cores, and Others. The Motors segment held the largest market share of 245.23% in 2023, driven by the rising adoption of electric vehicles and industrial automation, particularly in the U.S., where electrical steel enhances motor efficiency by minimizing energy losses.
The Transformers segment is anticipated to grow at the fastest rate of 7.1% from 2025 to 2032, fueled by increasing investments in grid modernization and renewable energy projects, especially in Canada, where high-efficiency transformers are critical for integrating wind, solar, and hydroelectric power.
- By End-User
On the basis of end-user, the North America electrical steel market is segmented into Energy and Power, Engineering, Automotive, Building and Construction, Household Appliances, and Others. The Energy and Power segment dominated with a market share of 35% in 2023, driven by the extensive use of electrical steel in transformers and generators for power generation and distribution, particularly in Canada’s renewable energy sector.
The Automotive segment is expected to witness the fastest growth rate of 7.9% from 2025 to 2032, propelled by the surging production of electric vehicles in the U.S., where electrical steel is essential for high-efficiency motors and other electrified components, aligning with the region’s push for sustainable mobility.
Electrical Steel Market Regional Analysis
- Canada dominated the North America electrical steel market with the largest revenue share of 45.12% in 2024, driven by its robust energy and power sector, significant investments in renewable energy, and a well-established manufacturing base
- The U.S. is expected to be the fastest-growing country in the North America electrical steel market during the forecast period, propelled by the rising adoption of electric vehicles, government incentives for clean energy, and innovations in electrical steel applications
U.S. Electrical Steel Market Insight
The U.S. is the fastest-growing country in the North America electrical steel market, fuelled by strong demand in the automotive sector, particularly for EV motors, and growing investments in renewable energy infrastructure. The trend towards energy efficiency and increasing regulations promoting sustainable materials further boost market expansion. Automakers’ growing use of electrical steel in high-performance motors complements aftermarket sales, creating a diverse product ecosystem.
Canada Electrical Steel Market Insight
Canada dominated the North America electrical steel market with the highest revenue share of 78.9% in 2024, driven by its advanced energy and power sector and increasing adoption of electrical steel in transformers and motors. The focus on upgrading outdated electrical infrastructure and rising demand for energy-efficient solutions encourage market growth. Strong domestic manufacturing and government initiatives promoting clean energy further enhance market penetration.
Electrical Steel Market Share
The electrical steel industry is primarily led by well-established companies, including:
- ArcelorMittal (Luxembourg)
- Cleveland-Cliffs Inc. (U.S.)
- Nippon Steel Corporation (Japan)
- POSCO (South Korea)
- Voestalpine AG (Austria)
- Thyssenkrupp AG (Germany)
- JFE Steel Corporation (Japan)
- United States Steel Corporation (U.S.)
- Aperam (Luxembourg)
- Baosteel Group Corporation (China)
- Tata Steel (India)
- AK Steel (U.S.)
- NLMK Group (Russia)
- Steel Authority of India Limited (India)
- Cogent Power Limited (U.K.)
What are the Recent Developments in North America Electrical Steel Market?
- In April 2024, ArcelorMittal revealed plans to build a USD 1.2 billion advanced manufacturing facility in Calvert, Alabama, dedicated to producing 150,000 metric tons of non-grain-oriented electrical steel (NOES) annually. This specialty steel is vital for electric vehicle (EV) motors, generators, and renewable energy systems. The initiative addresses a critical gap in the U.S. supply chain, reducing reliance on imports and supporting the Biden administration’s net-zero emissions goals. Backed by the U.S. Department of Energy, the project received $280.5 million in investment tax credits under the Inflation Reduction Act’s 48C program, recognizing electrical steel as a critical material for clean energy technologies
- In December 2023, Nippon Steel Corporation, via its subsidiary NIPPON STEEL NORTH AMERICA, INC., announced the acquisition of United States Steel Corporation (U.S. Steel) for USD 14.9 billion, marking one of the largest foreign takeovers in U.S. manufacturing history. The deal, finalized in June 2025, positions Nippon Steel as a dominant player in North America’s steel market, particularly in the production of electrical steel—a critical material for EV motors, transformers, and renewable energy systems
- In October 2023, United States Steel Corporation (U.S. Steel) inaugurated a new non-grain-oriented (NGO) electrical steel production line at its Big River Steel facility in Osceola, Arkansas. With an annual capacity of 200,000 metric tons, this line is the largest of its kind in the U.S., surpassing other domestic producers in volume. The facility utilizes up to 90% recycled scrap steel, reducing carbon emissions by 70–80% compared to traditional methods. The line produces InduX™, a steel grade essential for EV motors, generators, and renewable energy systems, reinforcing U.S. Steel’s role in advancing clean energy infrastructure
- In May 2023, JFE Shoji Power Canada, a division of JFE Holdings, announced a major expansion initiative in collaboration with strategic partners to meet surging demand for electrical steel components used in power and distribution transformers. The company committed to significant investments in new machinery and workforce development, aiming to boost production capacity by at least 40% for distribution transformer cores and more than double for large power transformer cores by the end of 2023. This move supports the rapid growth of clean energy infrastructure across North America, including grid modernization and electrification efforts
- In January 2023, Cleveland-Cliffs Inc. introduced the MOTOR-MAX® product line—high-frequency non-oriented electrical steels (HF NOES) engineered for EV traction motors, generators, and other rotating equipment. These steels are optimized for low core loss and high energy efficiency at frequencies above 60 Hz, making them ideal for electric vehicles and renewable energy systems. As the only U.S.-based producer of automotive-quality electrical steels, Cleveland-Cliffs designed MOTOR-MAX to support domestic manufacturing, reduce supply chain risks, and lower greenhouse gas emissions through electric arc furnace (EAF) production using recycled materials
SKU-

- Interactive Data Analysis Dashboard
- Company Analysis Dashboard for high growth potential opportunities
- Research Analyst Access for customization & queries
- Competitor Analysis with Interactive dashboard
- Latest News, Updates & Trend analysis
- Harness the Power of Benchmark Analysis for Comprehensive Competitor Tracking
Table of Content
1 INTRODUCTION
1.1 OBJECTIVES OF THE STUDY
1.2 MARKET DEFINITION
1.3 OVERVIEW OF NORTH AMERICA ELECTRICAL STEEL MARKET
1.4 LIMITATIONS
1.5 MARKETS COVERED
2 MARKET SEGMENTATION
2.1 MARKETS COVERED
2.2 GEOGRAPHICAL SCOPE
2.3 YEARS CONSIDERED FOR THE STUDY
2.4 CURRENCY AND PRICING
2.5 DBMR TRIPOD DATA VALIDATION MODEL
2.6 MULTIVARIATE MODELLING
2.7 PRIMARY INTERVIEWS WITH KEY OPINION LEADERS
2.8 DBMR MARKET POSITION GRID
2.9 MARKET APPLICATION COVERAGE GRID
2.1 VENDOR SHARE ANALYSIS
2.11 SECONDARY SOURCES
2.12 ASSUMPTIONS
3 EXECUTIVE SUMMARY
4 PREMIUM INSIGHTS
4.1 PESTLE ANALYSIS
4.1.1 POLITICAL FACTORS:
4.1.2 ECONOMIC FACTORS:
4.1.3 SOCIAL FACTORS:
4.1.4 TECHNOLOGICAL FACTORS:
4.1.5 LEGAL FACTORS:
4.1.6 ENVIRONMENTAL FACTORS:
4.2 PORTER’S FIVE FORCES
4.2.1 THREAT OF NEW ENTRANTS (LOW)
4.2.2 THREAT OF SUBSTITUTES (MODERATE)
4.2.3 BARGAINING POWER OF BUYERS (HIGH)
4.2.4 BARGAINING POWER OF SUPPLIERS (MODERATE)
4.2.5 COMPETITIVE RIVALRY (HIGH)
4.3 VENDOR SELECTION CRITERIA
4.4 TECHNOLOGICAL ADVANCEMENT BY MANUFACTURERS
4.4.1 HIGH-PERMEABILITY GRADES:
4.4.2 NANO-CRYSTALLINE AND AMORPHOUS ALLOYS:
4.4.3 LASER SCRIBING TECHNOLOGY:
4.4.4 ADVANCED COATING TECHNIQUES:
4.4.5 3D PRINTING AND ADDITIVE MANUFACTURING:
4.4.6 DIGITAL TWIN TECHNOLOGY:
4.4.7 AI AND MACHINE LEARNING IN QUALITY CONTROL:
4.4.8 IMPROVED RECYCLING PROCESSES:
4.5 RAW MATERIAL PRODUCTION COVERAGE
5 REGULATION COVERAGE
6 MARKET OVERVIEW
6.1 DRIVERS
6.1.1 RISE IN DEMAND FOR SUSTAINABLE ENERGY SOURCES SUCH AS WIND AND HYDROPOWER
6.1.2 INCREASING DEMAND FOR STEEL IN MOTORS OF HYBRID/ELECTRICAL VEHICLES
6.1.3 RISING DEMAND OF THE HIGH PERMEABILITY GRADES ALLOY CORE AND WEIGHT REDUCTION MATERIALS IN THE POWER INDUSTRY
6.1.4 GAIN IN POPULARITY OF NON GRAIN ORIENTED ELECTRICAL STEEL IN HOUSEHOLD APPLIANCES
6.2 RESTRAINTS
6.2.1 DISTORTION IN PROPERTIES OF ELECTRICAL STEEL DUE TO TEMPERATURE VARIATIONS
6.2.2 IMPROPER AND INADEQUATE ELECTRONICS WASTE DISPOSAL SYSTEMS
6.3 OPPORTUNITIES
6.3.1 GROWTH IN APPLICATION OF ELECTRIC VEHICLES
6.3.2 INCREASING DEMAND FOR ELECTRICAL STEEL IN ENERGY STORAGE SYSTEMS
6.3.3 RISE IN STRINGENT ENVIRONMENT REGULATIONS AIMED FOR REDUCING GREENHOUSE GASES EMISSION
6.4 CHALLENGES
6.4.1 THE TENDENCY OF STEEL TO CORRODE OVER TIME ON EXPOSURE TO MOISTURE AND AIR
6.4.2 FLUCTUATION IN RAW MATERIAL PRICES
7 NORTH AMERICA ELECTRICAL STEEL MARKET, BY TYPE
7.1 OVERVIEW
7.2 NON-GRAIN ORIENTED ELECTRICAL STEEL
7.2.1 NON-GRAIN ORIENTED ELECTRICAL STEEL, BY TYPE
7.2.2 NON-GRAIN ORIENTED ELECTRICAL STEEL, BY CATEGORY
7.3 GRAIN ORIENTED ELECTRICAL STEEL
7.3.1 GRAIN ORIENTED ELECTRICAL STEEL, BY TYPE
8 NORTH AMERICA ELECTRICAL STEEL MARKET, BY THICKNESS
8.1 OVERVIEW
8.2 0.23 MM
8.3 0.27 MM
8.4 0.30 MM
8.5 0.35 MM
8.6 0.5 MM
8.7 0.65 MM
8.8 OTHERS
9 NORTH AMERICA ELECTRICAL STEEL MARKET, BY CORE LOSSES
9.1 OVERVIEW
9.2 LESS THAN 0.9 W/KG
9.3 0.90 W/KG TO 0.99 W/KG
9.4 1.00 W/KG TO 1.29 W/KG
9.5 1.30 W/KG TO 1.39 W/KG
9.6 ABOVE 1.39 W/KG
10 NORTH AMERICA ELECTRICAL STEEL MARKET, BY FLUX DENSITY
10.1 OVERVIEW
10.2 ABOVE 1.76 TESLA
10.3 1.73 TESLA TO 1.76 TESLA
10.4 1.69 TESLA TO 1.73 TESLA
10.5 1.65 TESLA TO 1.69 TESLA
10.6 LESS THAN 1.65 TESLA
11 NORTH AMERICA ELECTRICAL STEEL MARKET, BY END-USER
11.1 OVERVIEW
11.2 ENERGY AND POWER
11.3 ENGINEERING
11.4 AUTOMOTIVE
11.5 BUILDING AND CONSTRUCTION
11.6 HOUSEHOLD APPLIANCES
11.7 OTHERS
12 NORTH AMERICA ELECTRICAL STEEL MARKET, BY APPLICATION
12.1 OVERVIEW
12.2 MOTORS
12.2.1 MOTORS, BY PRODUCT TYPE
12.2.2 MOTORS, BY CATEGORY
12.3 TRANSFORMERS
12.3.1 TRANSFORMERS, BY PRODUCT TYPE
12.3.2 TRANSFORMERS, BY APPLICATION
12.4 POWER GENERATORS
12.4.1 POWER GENERATORS, BY PRODUCT TYPE
12.4.2 POWER GENERATORS, BY APPLICATION
12.5 INDUCTORS
12.5.1 INDUCTORS, BY PRODUCT TYPE
12.6 ELECTRICAL BALLASTS
12.6.1 ELECTRICAL BALLASTS, BY PRODUCT TYPE
12.7 BATTERY
12.7.1 BATTERY, BY PRODUCT TYPE
12.8 CONVERTORS
12.8.1 CONVERTORS, BY PRODUCT TYPE
12.9 SHUNT REACTORS
12.9.1 SHUNT REACTORS, BY PRODUCT TYPE
12.1 WOUND CORES
12.10.1 WOUND CORES, BY PRODUCT TYPE
12.11 OTHERS
12.11.1 OTHERS, BY PRODUCT TYPE
13 NORTH AMERICA ELECTRICAL STEEL MARKET, BY COUNTRY
13.1 NORTH AMERICA
13.1.1 U.S.
13.1.2 CANADA
13.1.3 MEXICO
14 NORTH AMERICA ELECTRICAL STEEL MARKET : COMPANY LANDSCAPE
14.1 COMPANY SHARE ANALYSIS: NORTH AMERICA
15 SWOT ANALYSIS
16 COMPANY PROFILES
16.1 CLEVELAND-CLIFFS INC.
16.1.1 COMPANY SNAPSHOT
16.1.2 REVENUE ANALYSIS
16.1.3 PRODUCT PORTFOLIO
16.1.4 RECENT DEVELOPMENTS
16.2 JFE STEEL CORPORATION.
16.2.1 COMPANY SNAPSHOT
16.2.2 PRODUCT PORTFOLIO
16.2.3 RECENT DEVELOPMENTS
16.3 ARCELORMITTAL
16.3.1 COMPANY SNAPSHOT
16.3.2 REVENUE ANALYSIS
16.3.3 PRODUCT PORTFOLIO
16.3.4 1.3.3RECENT DEVELOPMENTS
16.4 VOESTALPINE AG
16.4.1 COMPANY SNAPSHOT
16.4.2 REVENUE ANALYSIS
16.4.3 PRODUCT PORTFOLIO
16.4.4 RECENT DEVELOPMENTS
16.5 THYSSENKRUPP AG
16.5.1 COMPANY SNAPSHOT
16.5.2 REVENUE ANALYSIS
16.5.3 PRODUCT PORTFOLIO
16.5.4 RECENT DEVELOPMENTS
16.6 BAOSTEEL CO., LTD.
16.6.1 COMPANY SNAPSHOT
16.6.2 PRODUCT PORTFOLIO
16.6.3 RECENT DEVELOPMENTS
16.7 C.D. WÄLZHOLZ GMBH & CO. KG
16.7.1 COMPANY SNAPSHOT
16.7.2 PRODUCT PORTFOLIO
16.7.3 RECENT DEVELOPMENTS
16.8 NIPPON STEEL CORPORATION
16.8.1 COMPANY SNAPSHOT
16.8.2 REVENUE ANALYSIS
16.8.3 PRODUCT PORTFOLIO
16.8.4 RECENT DEVELOPMENTS
16.9 POSCO
16.9.1 COMPANY SNAPSHOT
16.9.2 REVENUE ANALYSIS
16.9.3 PRODUCT PORTFOLIO
16.9.4 RECENT DEVELOPMENTS
16.1 TC METAL
16.10.1 COMPANY SNAPSHOT
16.10.2 PRODUCT PORTFOLIO.
16.10.3 RECENT DEVELOPMENTS
16.11 TEMPEL (A SUBSIDIARY OF WORTHINGTON STEEL )
16.11.1 COMPANY SNAPSHOT
16.11.2 PRODUCT PORTFOLIO
16.11.3 RECENT DEVELOPMENTS
17 QUESTIONNAIRE
18 RELATED REPORTS
List of Table
TABLE 1 REGULATION COVERAGE
TABLE 2 NEW MODEL ANNOUNCEMENT OF ELECTRICAL CARS
TABLE 3 NORTH AMERICA ELECTRICAL STEEL MARKET, BY PRODUCT TYPE, 2022-2031 (USD MILLION)
TABLE 4 NORTH AMERICA ELECTRICAL STEEL MARKET, BY PRODUCT TYPE, 2022-2031 (MILLION TONS)
TABLE 5 NORTH AMERICA NON-GRAIN ORIENTED ELECTRICAL STEEL IN ELECTRICAL STEEL MARKET, BY TYPE, 2022-2031 (USD MILLION)
TABLE 6 NORTH AMERICA NON-GRAIN ORIENTED ELECTRICAL STEEL IN ELECTRICAL STEEL MARKET, BY CATEGORY, 2022-2031 (USD MILLION)
TABLE 7 NORTH AMERICA GRAIN ORIENTED ELECTRICAL STEEL IN ELECTRICAL STEEL MARKET, BY TYPE, 2022-2031 (USD MILLION)
TABLE 8 NORTH AMERICA ELECTRICAL STEEL MARKET, BY THCIKNESS, 2022-2031 (USD MILLION)
TABLE 9 NORTH AMERICA ELECTRICAL STEEL MARKET, BY CORE LOSSES, 2022-2031 (USD MILLION)
TABLE 10 NORTH AMERICA ELECTRICAL STEEL MARKET, BY FLUX DENSITY, 2022-2031 (USD MILLION)
TABLE 11 NORTH AMERICA ELECTRICAL STEEL MARKET, BY END-USER, 2022-2031 (USD MILLION)
TABLE 12 NORTH AMERICA ELECTRICAL STEEL MARKET, BY APPLICATION, 2022-2031 (USD MILLION)
TABLE 13 NORTH AMERICA MOTORS IN ELECTRICAL STEEL MARKET, BY PRODUCT TYPE, 2022-2031, (USD MILLION)
TABLE 14 NORTH AMERICA MOTORS IN ELECTRICAL STEEL MARKET, BY CATEGORY, 2022-2031, (USD MILLION)
TABLE 15 NORTH AMERICA TRANSFORMERS IN ELECTRICAL STEEL MARKET, BY PRODUCT TYPE, 2022-2031, (USD MILLION)
TABLE 16 NORTH AMERICA TRANSFORMERS IN ELECTRICAL STEEL MARKET, BY APPLICATION, 2022-2031, (USD MILLION)
TABLE 17 NORTH AMERICA POWER GENERATORS IN ELECTRICAL STEEL MARKET, BY PRODUCT TYPE, 2022-2031 (USD MILLION)
TABLE 18 NORTH AMERICA POWER GENERATORSIN ELECTRICAL STEEL MARKET, BY APPLICATION, 2022-2031 (USD MILLION)
TABLE 19 NORTH AMERICA INDUCTORS IN ELECTRICAL STEEL MARKET, BY PRODUCT TYPE, 2022-2031, (USD MILLION)
TABLE 20 NORTH AMERICA ELECTRICAL BALLASTS IN ELECTRICAL STEEL MARKET, BY PRODUCT TYPE, 2022-2031, (USD MILLION)
TABLE 21 NORTH AMERICA BATTERY IN ELECTRICAL STEEL MARKET, BY PRODUCT TYPE, 2022-2031, (USD MILLION)
TABLE 22 NORTH AMERICA CONVERTORS IN ELECTRICAL STEEL MARKET, BY PRODUCT TYPE, 2022-2031, (USD MILLION)
TABLE 23 NORTH AMERICA SHUNT REACTORS IN ELECTRICAL STEEL MARKET, BY PRODUCT TYPE, 2022-2031 (USD MILLION)
TABLE 24 NORTH AMERICA WOUND CORES IN ELECTRICAL STEEL MARKET, BY PRODUCT TYPE, 2022-2031, (USD MILLION)
TABLE 25 NORTH AMERICA OTHERS IN ELECTRICAL STEEL MARKET, BY PRODUCT TYPE, 2022-2031, (USD MILLION)
TABLE 26 NORTH AMERICA ELECTRICAL STEEL MARKET, BY COUNTRY, 2022-2031 (USD MILLION)
TABLE 27 NORTH AMERICA ELECTRICAL STEEL MARKET, BY COUNTRY, 2022-2031 (MILLION TONS)
TABLE 28 U.S. ELECTRICAL STEEL MARKET, BY PRODUCT TYPE, 2022-2031 (USD MILLION)
TABLE 29 U.S. ELECTRICAL STEEL MARKET, BY PRODUCT TYPE, 2022-2031 (MILLION TONS)
TABLE 30 U.S. NON-GRAIN ORIENTED ELECTRICAL STEEL IN ELECTRICAL STEEL MARKET, BY TYPE, 2022-2031 (USD MILLION)
TABLE 31 U.S. NON-GRAIN ORIENTED ELECTRICAL STEEL IN ELECTRICAL STEEL MARKET, BY CATEGORY, 2022-2031 (USD MILLION)
TABLE 32 U.S. GRAIN ORIENTED ELECTRICAL STEEL IN ELECTRICAL STEEL MARKET, BY TYPE, 2022-2031 (USD MILLION)
TABLE 33 U.S. ELECTRICAL STEEL MARKET, BY THICKNESS, 2022-2031 (USD MILLION)
TABLE 34 U.S. ELECTRICAL STEEL MARKET, BY CORE LOSSES, 2022-2031 (USD MILLION)
TABLE 35 U.S. ELECTRICAL STEEL MARKET, BY FLUX DENSITY, 2022-2031 (USD MILLION)
TABLE 36 U.S. ELECTRICAL STEEL MARKET, BY APPLICATION, 2022-2031 (USD MILLION)
TABLE 37 U.S. MOTORS IN ELECTRICAL STEEL MARKET, BY PRODUCT TYPE, 2022-2031 (USD MILLION)
TABLE 38 U.S. MOTORS IN ELECTRICAL STEEL MARKET, BY CATEGORY, 2022-2031 (USD MILLION)
TABLE 39 U.S. TRANSFORMERS IN ELECTRICAL STEEL MARKET, BY PRODUCT TYPE, 2022-2031 (USD MILLION)
TABLE 40 U.S. TRANSFORMERS IN ELECTRICAL STEEL MARKET, BY APPLICATION, 2022-2031 (USD MILLION)
TABLE 41 U.S. POWER GENERATORS IN ELECTRICAL STEEL MARKET, BY PRODUCT TYPE, 2022-2031 (USD MILLION)
TABLE 42 U.S. POWER GENERATORS IN ELECTRICAL STEEL MARKET, BY APPLICATION, 2022-2031 (USD MILLION)
TABLE 43 U.S. INDUCTORS IN ELECTRICAL STEEL MARKET, BY PRODUCT TYPE, 2022-2031 (USD MILLION)
TABLE 44 U.S. ELECTRICAL BALLASTS IN ELECTRICAL STEEL MARKET, BY PRODUCT TYPE, 2022-2031 (USD MILLION)
TABLE 45 U.S. BATTERY IN ELECTRICAL STEEL MARKET, BY PRODUCT TYPE, 2022-2031 (USD MILLION)
TABLE 46 U.S. CONVERTORS IN ELECTRICAL STEEL MARKET, BY PRODUCT TYPE, 2022-2031 (USD MILLION)
TABLE 47 U.S. SHUNT REACTORS IN ELECTRICAL STEEL MARKET, BY PRODUCT TYPE, 2022-2031 (USD MILLION)
TABLE 48 U.S. WOUND CORES IN ELECTRICAL STEEL MARKET, BY PRODUCT TYPE, 2022-2031 (USD MILLION)
TABLE 49 U.S. OTHERS IN ELECTRICAL STEEL MARKET, BY PRODUCT TYPE, 2022-2031 (USD MILLION)
TABLE 50 U.S. ELECTRICAL STEEL MARKET, BY END-USER, 2022-2031 (USD MILLION)
TABLE 51 CANADA ELECTRICAL STEEL MARKET, BY PRODUCT TYPE, 2022-2031 (USD MILLION)
TABLE 52 CANADA ELECTRICAL STEEL MARKET, BY PRODUCT TYPE, 2022-2031 (MILLION TONS)
TABLE 53 CANADA NON-GRAIN ORIENTED ELECTRICAL STEEL IN ELECTRICAL STEEL MARKET, BY TYPE, 2022-2031 (USD MILLION)
TABLE 54 CANADA NON-GRAIN ORIENTED ELECTRICAL STEEL IN ELECTRICAL STEEL MARKET, BY CATEGORY, 2022-2031 (USD MILLION)
TABLE 55 CANADA GRAIN ORIENTED ELECTRICAL STEEL IN ELECTRICAL STEEL MARKET, BY TYPE, 2022-2031 (USD MILLION)
TABLE 56 CANADA ELECTRICAL STEEL MARKET, BY THICKNESS, 2022-2031 (USD MILLION)
TABLE 57 CANADA ELECTRICAL STEEL MARKET, BY CORE LOSSES, 2022-2031 (USD MILLION)
TABLE 58 CANADA ELECTRICAL STEEL MARKET, BY FLUX DENSITY, 2022-2031 (USD MILLION)
TABLE 59 CANADA ELECTRICAL STEEL MARKET, BY APPLICATION, 2022-2031 (USD MILLION)
TABLE 60 CANADA MOTORS IN ELECTRICAL STEEL MARKET, BY PRODUCT TYPE, 2022-2031 (USD MILLION)
TABLE 61 CANADA MOTORS IN ELECTRICAL STEEL MARKET, BY CATEGORY, 2022-2031 (USD MILLION)
TABLE 62 CANADA TRANSFORMERS IN ELECTRICAL STEEL MARKET, BY PRODUCT TYPE, 2022-2031 (USD MILLION)
TABLE 63 CANADA TRANSFORMERS IN ELECTRICAL STEEL MARKET, BY APPLICATION, 2022-2031 (USD MILLION)
TABLE 64 CANADA POWER GENERATORS IN ELECTRICAL STEEL MARKET, BY PRODUCT TYPE, 2022-2031 (USD MILLION)
TABLE 65 CANADA POWER GENERATORS IN ELECTRICAL STEEL MARKET, BY APPLICATION, 2022-2031 (USD MILLION)
TABLE 66 CANADA INDUCTORS IN ELECTRICAL STEEL MARKET, BY PRODUCT TYPE, 2022-2031 (USD MILLION)
TABLE 67 CANADA ELECTRICAL BALLASTS IN ELECTRICAL STEEL MARKET, BY PRODUCT TYPE, 2022-2031 (USD MILLION)
TABLE 68 CANADA BATTERY IN ELECTRICAL STEEL MARKET, BY PRODUCT TYPE, 2022-2031 (USD MILLION)
TABLE 69 CANADA CONVERTORS IN ELECTRICAL STEEL MARKET, BY PRODUCT TYPE, 2022-2031 (USD MILLION)
TABLE 70 CANADA SHUNT REACTORS IN ELECTRICAL STEEL MARKET, BY PRODUCT TYPE, 2022-2031 (USD MILLION)
TABLE 71 CANADA WOUND CORES IN ELECTRICAL STEEL MARKET, BY PRODUCT TYPE, 2022-2031 (USD MILLION)
TABLE 72 CANADA OTHERS IN ELECTRICAL STEEL MARKET, BY PRODUCT TYPE, 2022-2031 (USD MILLION)
TABLE 73 CANADA ELECTRICAL STEEL MARKET, BY END-USER, 2022-2031 (USD MILLION)
TABLE 74 MEXICO ELECTRICAL STEEL MARKET, BY PRODUCT TYPE, 2022-2031 (USD MILLION)
TABLE 75 MEXICO ELECTRICAL STEEL MARKET, BY PRODUCT TYPE, 2022-2031 (MILLION TONS)
TABLE 76 MEXICO NON-GRAIN ORIENTED ELECTRICAL STEEL IN ELECTRICAL STEEL MARKET, BY TYPE, 2022-2031 (USD MILLION)
TABLE 77 MEXICO NON-GRAIN ORIENTED ELECTRICAL STEEL IN ELECTRICAL STEEL MARKET, BY CATEGORY, 2022-2031 (USD MILLION)
TABLE 78 MEXICO GRAIN ORIENTED ELECTRICAL STEEL IN ELECTRICAL STEEL MARKET, BY TYPE, 2022-2031 (USD MILLION)
TABLE 79 MEXICO ELECTRICAL STEEL MARKET, BY THICKNESS, 2022-2031 (USD MILLION)
TABLE 80 MEXICO ELECTRICAL STEEL MARKET, BY CORE LOSSES, 2022-2031 (USD MILLION)
TABLE 81 MEXICO ELECTRICAL STEEL MARKET, BY FLUX DENSITY, 2022-2031 (USD MILLION)
TABLE 82 MEXICO ELECTRICAL STEEL MARKET, BY APPLICATION, 2022-2031 (USD MILLION)
TABLE 83 MEXICO MOTORS IN ELECTRICAL STEEL MARKET, BY PRODUCT TYPE, 2022-2031 (USD MILLION)
TABLE 84 MEXICO MOTORS IN ELECTRICAL STEEL MARKET, BY CATEGORY, 2022-2031 (USD MILLION)
TABLE 85 MEXICO TRANSFORMERS IN ELECTRICAL STEEL MARKET, BY PRODUCT TYPE, 2022-2031 (USD MILLION)
TABLE 86 MEXICO TRANSFORMERS IN ELECTRICAL STEEL MARKET, BY APPLICATION, 2022-2031 (USD MILLION)
TABLE 87 MEXICO POWER GENERATORS IN ELECTRICAL STEEL MARKET, BY PRODUCT TYPE, 2022-2031 (USD MILLION)
TABLE 88 MEXICO POWER GENERATORS IN ELECTRICAL STEEL MARKET, BY APPLICATION, 2022-2031 (USD MILLION)
TABLE 89 MEXICO INDUCTORS IN ELECTRICAL STEEL MARKET, BY PRODUCT TYPE, 2022-2031 (USD MILLION)
TABLE 90 MEXICO ELECTRICAL BALLASTS IN ELECTRICAL STEEL MARKET, BY PRODUCT TYPE, 2022-2031 (USD MILLION)
TABLE 91 MEXICO BATTERY IN ELECTRICAL STEEL MARKET, BY PRODUCT TYPE, 2022-2031 (USD MILLION)
TABLE 92 MEXICO CONVERTORS IN ELECTRICAL STEEL MARKET, BY PRODUCT TYPE, 2022-2031 (USD MILLION)
TABLE 93 MEXICO SHUNT REACTORS IN ELECTRICAL STEEL MARKET, BY PRODUCT TYPE, 2022-2031 (USD MILLION)
TABLE 94 MEXICO WOUND CORES IN ELECTRICAL STEEL MARKET, BY PRODUCT TYPE, 2022-2031 (USD MILLION)
TABLE 95 MEXICO OTHERS IN ELECTRICAL STEEL MARKET, BY PRODUCT TYPE, 2022-2031 (USD MILLION)
TABLE 96 MEXICO ELECTRICAL STEEL MARKET, BY END-USER, 2022-2031 (USD MILLION)
List of Figure
FIGURE 1 NORTH AMERICA ELECTRICAL STEEL MARKET: SEGMENTATION
FIGURE 2 NORTH AMERICA ELECTRICAL STEEL MARKET: DATA TRIANGULATION
FIGURE 3 NORTH AMERICA ELECTRICAL STEEL MARKET: DROC ANALYSIS
FIGURE 4 NORTH AMERICA ELECTRICAL STEEL MARKET: GLOBAL VS REGIONAL MARKET ANALYSIS
FIGURE 5 NORTH AMERICA ELECTRICAL STEEL MARKET: COMPANY RESEARCH ANALYSIS
FIGURE 6 NORTH AMERICA ELECTRICAL STEEL MARKET: MULTIVARIATE MODELLING
FIGURE 7 NORTH AMERICA ELECTRICAL STEEL MARKET: INTERVIEW DEMOGRAPHICS
FIGURE 8 NORTH AMERICA ELECTRICAL STEEL MARKET: DBMR MARKET POSITION GRID
FIGURE 9 NORTH AMERICA ELECTRICAL STEEL MARKET: MARKET APPLICATION COVERAGE GRID
FIGURE 10 NORTH AMERICA ELECTRICAL STEEL MARKET: VENDOR SHARE ANALYSIS
FIGURE 11 NORTH AMERICA ELECTICAL STEEL MARKET: SEGMENTATION
FIGURE 12 TWO SEGMENTS COMPRISE THE NORTH AMERICA ELECTRICAL STEEL MARKET, BY PRODUCT TYPE
FIGURE 13 EXECUTIVE SUMMARY : NORTH AMERICAL ELECTRICAL STEEL MARKET
FIGURE 14 INCREASING DEMAND FOR STEEL IN MOTORS OF HYBRID/ELECTRICAL VEHICLES IS THE KEY DRIVER FOR THE NORTH ELECTRICAL STEEL MARKET IN THE FORECAST PERIOD OF 2024 TO 2031
FIGURE 15 NON-GRAIN ORIENTED ELECTRICAL STEEL SEGMENT IS EXPECTED TO ACCOUNT FOR THE LARGEST SHARE OF THE NORTH AMERICA ELECTRICAL STEEL MARKET IN 2024 AND 2031
FIGURE 16 STRATEGIC DECISIONS
FIGURE 17 PORTER’S FIVE FORCES
FIGURE 18 VENDOR SELECTION CRITERIA
FIGURE 19 DRIVERS, RESTRAINTS, OPPORTUNITIES, AND CHALLENGE OF THE NORTH AMERICA ELECTRICAL STEEL MARKET
FIGURE 20 STEEL PRICE (2020) (USD DOLLAR/METRIC TON)
FIGURE 21 NORTH AMERICA ELECTRICAL STEEL MARKET: BY PRODUCT TYPE, 2023
FIGURE 22 NORTH AMERICA ELECTRICAL STEEL MARKET: BY THICKNESS, 2023
FIGURE 23 NORTH AMERICA ELECTRICAL STEEL MARKET: BY CORE LOSSES, 2023
FIGURE 24 NORTH AMERICA ELECTRICAL STEEL MARKET: BY FLUX DENSITY, 2023
FIGURE 25 NORTH AMERICA ELECTRICAL STEEL MARKET: BY END-USER, 2023
FIGURE 26 NORTH AMERICA ELECTRICAL STEEL MARKET: BY APPLICATION, 2023
FIGURE 27 NORTH AMERICA ELECTRICAL STEEL MARKET: SNAPSHOT (2023)
FIGURE 28 NORTH AMERICA ELECTRICAL STEEL MARKET COMPANY SHARE 2023 (%)
North America Electrical Steel Market, Supply Chain Analysis and Ecosystem Framework
To support market growth and help clients navigate the impact of geopolitical shifts, DBMR has integrated in-depth supply chain analysis into its North America Electrical Steel Market research reports. This addition empowers clients to respond effectively to global changes affecting their industries. The supply chain analysis section includes detailed insights such as North America Electrical Steel Market consumption and production by country, price trend analysis, the impact of tariffs and geopolitical developments, and import and export trends by country and HSN code. It also highlights major suppliers with data on production capacity and company profiles, as well as key importers and exporters. In addition to research, DBMR offers specialized supply chain consulting services backed by over a decade of experience, providing solutions like supplier discovery, supplier risk assessment, price trend analysis, impact evaluation of inflation and trade route changes, and comprehensive market trend analysis.
Data collection and base year analysis are done using data collection modules with large sample sizes. The stage includes obtaining market information or related data through various sources and strategies. It includes examining and planning all the data acquired from the past in advance. It likewise envelops the examination of information inconsistencies seen across different information sources. The market data is analysed and estimated using market statistical and coherent models. Also, market share analysis and key trend analysis are the major success factors in the market report. To know more, please request an analyst call or drop down your inquiry.
The key research methodology used by DBMR research team is data triangulation which involves data mining, analysis of the impact of data variables on the market and primary (industry expert) validation. Data models include Vendor Positioning Grid, Market Time Line Analysis, Market Overview and Guide, Company Positioning Grid, Patent Analysis, Pricing Analysis, Company Market Share Analysis, Standards of Measurement, Global versus Regional and Vendor Share Analysis. To know more about the research methodology, drop in an inquiry to speak to our industry experts.
Data Bridge Market Research is a leader in advanced formative research. We take pride in servicing our existing and new customers with data and analysis that match and suits their goal. The report can be customized to include price trend analysis of target brands understanding the market for additional countries (ask for the list of countries), clinical trial results data, literature review, refurbished market and product base analysis. Market analysis of target competitors can be analyzed from technology-based analysis to market portfolio strategies. We can add as many competitors that you require data about in the format and data style you are looking for. Our team of analysts can also provide you data in crude raw excel files pivot tables (Fact book) or can assist you in creating presentations from the data sets available in the report.


