
North America Electroencephalography Devices Market
Market Size in USD Billion
 USD
1.20 Billion
USD
2.40 Billion
2024
2032
USD
1.20 Billion
USD
2.40 Billion
2024
2032
| 2025 - 2032 | |
| USD 1.20 Billion | |
| USD 2.40 Billion | |
| % | |
|
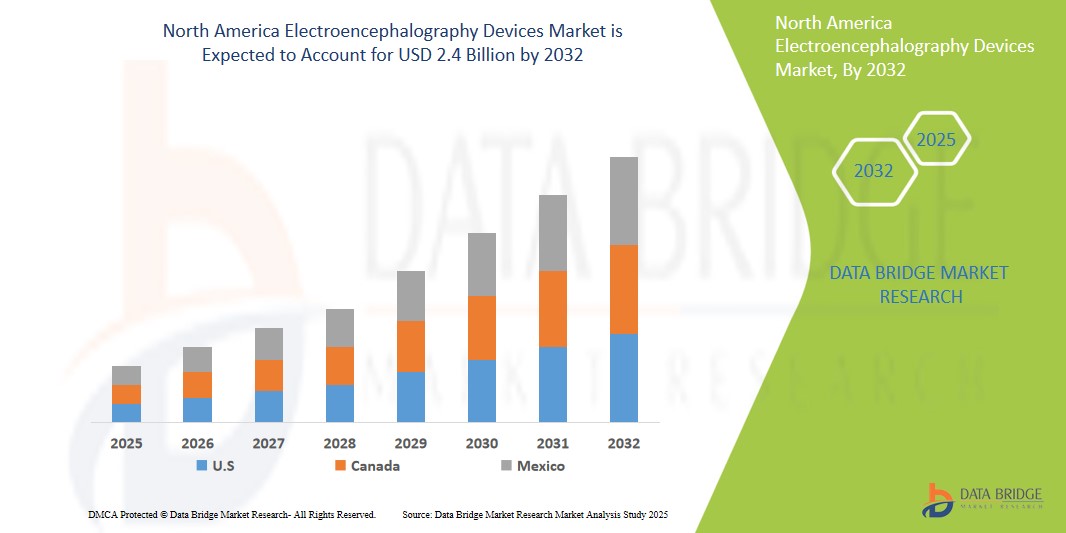
North America Electroencephalography Devices Market Size
- The North America Electroencephalography Devices Market was valued at USD 1.2 Billion in 2024 and is expected to reach USD 2.4 Billion by 2032
- Drivers of the North America Electroencephalography Devices Market include the rising prevalence of neurological disorders, which increases the demand for diagnostic tools. Additionally, technological advancements in EEG devices, such as improved portability and wireless capabilities, enhance their usability and appeal. Furthermore, increased funding for neurological research and growing awareness among healthcare professionals about the importance of brain health contribute to market growth.
North America Electroencephalography Devices Market Analysis
- The North America EEG devices market is experiencing significant growth due to the rising incidence of neurological disorders such as epilepsy, sleep disorders, and brain injuries. Increased awareness and better diagnostic capabilities lead to a higher demand for EEG devices in both clinical and home care settings.
- The market is driven by innovations in EEG technology, including wireless and portable EEG devices that offer enhanced mobility, ease of use, and real-time data monitoring. These advancements make EEG testing more accessible and attractive to both healthcare providers and patients.
- Increased funding for neurological research and the establishment of specialized centers for brain health are further propelling the EEG devices market. Collaborative efforts among academic institutions, healthcare providers, and industry stakeholders foster the development of more advanced EEG solutions, enhancing diagnostic accuracy and treatment options.
Report Scope and North America Electroencephalography Devices Market Segmentation
|
Attributes |
North America Electroencephalography Devices Market Insights |
|
Segments Covered |
|
|
Countries Covered |
North America
|
|
Key Market Players |
|
|
Market Opportunities |
|
|
Value Added Data Infosets |
In addition to the insights on market scenarios such as market value, growth rate, segmentation, geographical coverage, and major players, the market reports curated by the Data Bridge Market Research also include import export analysis, production capacity overview, production consumption analysis, price trend analysis, climate change scenario, supply chain analysis, value chain analysis, raw material/consumables overview, vendor selection criteria, PESTLE Analysis, Porter Analysis, and regulatory framework. |
North America Electroencephalography Devices Market Trends
“Rise of portable and wireless EEG devices”
- Portable EEG devices allow for greater patient mobility and comfort, enabling clinicians to conduct tests in various settings, including homes, outpatient clinics, and during patient activities, rather than being confined to traditional laboratory settings.
- Wireless EEG devices facilitate continuous and real-time monitoring of brain activity, which is crucial for tracking changes in neurological conditions. This capability allows for timely interventions and adjustments in treatment plans based on patient data.
- The trend sees EEG devices being integrated with wearable health technology, such as smartwatches or headsets, which can monitor various physiological parameters alongside brain activity. This convergence enhances the comprehensive health monitoring experience for users.
- The development of compact, user-friendly, and wireless EEG solutions is making brain monitoring more accessible to a broader range of patients, including those in remote areas, thereby expanding the market and facilitating broader public health initiatives in brain health awareness and treatment.
North America Electroencephalography Devices Market Dynamics
Driver
“Growing prevalence of neurological disorders”
- The increasing rate of conditions such as epilepsy, Parkinson's disease, Alzheimer's disease, and other neurodegenerative disorders is driving the demand for EEG devices. These conditions often require reliable diagnostic tools to monitor brain activity and assess the effectiveness of treatments.
- The demographic shift towards an aging population in North America contributes to a higher prevalence of neurological diseases. As older adults are more susceptible to conditions that affect brain function, there is a growing need for EEG monitoring and diagnostic solutions tailored to this age group.
- There is a growing awareness of neurological disorders among healthcare providers and patients. Enhanced training and education regarding these conditions have led to increased diagnosis rates, driving the need for EEG devices to support effective clinical evaluations.
Opportunity
“Growing focus on mental health and neurological disorders”
- There is a rising incidence of mental health conditions, including anxiety, depression, and attention-deficit/hyperactivity disorder (ADHD). EEG devices can aid in the diagnosis and monitoring of these disorders, encouraging increased demand for innovative EEG technology tailored to mental health applications.
- The exploration of brain-computer interfaces (BCIs) and neurofeedback therapies is gaining traction, with EEG devices serving as essential tools in developing and administering these novel treatment approaches. This creates opportunities for technology companies to collaborate with mental health practitioners to explore and market new treatments.
- Growing governmental and institutional funding for mental health and neurological research fosters innovation in EEG technology. This investment fuels the development of advanced EEG systems that can facilitate more precise and nuanced understanding of brain function related to various disorders.
Restraint/Challenge
“High cost of EEG devices and associated procedures”
- The high cost of EEG devices and the procedures involved can be a barrier for patients, especially those without insurance coverage or those with high-deductible health plans. This can lead to lower patient participation in diagnostic testing.
- Hospitals and clinics may face budget limitations that prevent them from purchasing advanced EEG equipment. The initial investment, along with the costs for maintenance and updates, can deter healthcare providers from acquiring the latest technologies.
- Inconsistent reimbursement policies from insurance companies for EEG testing and monitoring can make these services financially unviable for many healthcare providers, thus limiting market growth and accessibility for patients.
North America Electroencephalography Devices Market Scope
The market is segmented on the basis of Product Type, type, usability, procedure, function, age group, application, end user, distribution channel .
|
Segmentation |
Sub-Segmentation |
|
By Product |
Devices, Accessories, Consumables
|
|
Type |
Portable, Standalone, Wearable |
North America Electroencephalography Devices Market Analysis
“U.S. is the Dominated with 40% market share in the North America Electroencephalography Devices Market”
- The U.S. has a highly developed healthcare system with advanced facilities and a significant number of hospitals and clinics that utilize EEG technology for diagnosing and monitoring neurological disorders. This extensive healthcare infrastructure supports a strong demand for EEG devices.
- The U.S. is a leader in medical research and innovation. Substantial investment in R&D for neurological diagnostics and treatment fosters the development of advanced and more sophisticated EEG devices, enhancing their capabilities and driving market growth.
- The United States has seen a rising incidence of conditions such as epilepsy, sleep disorders, and other neurological diseases, leading to higher demand for EEG testing and monitoring. This growing patient population contributes to the overall market expansion.
“U.S. is Projected to Register the Highest Growth Rate in the North America Electroencephalography Devices Market”
- The increasing prevalence of neurological conditions such as epilepsy, Alzheimer’s disease, and sleep disorders in the U.S. drives demand for EEG diagnostics. As the population ages and awareness of these conditions grows, more individuals are seeking EEG tests for better management and treatment options.
- The U.S. is at the forefront of technological innovations in the healthcare sector, leading to the development of advanced EEG devices that are more capable, portable, and integrated with other health technologies. This innovation is attracting healthcare providers and patients alike, fueling market growth.
- The U.S. has substantial investments in medical research and development, particularly concerning neurological and cognitive functions. This commitment leads to continual improvements in EEG methodologies and devices, making them more efficient, user-friendly, and widely adopted in clinical practice.
North America Electroencephalography Devices Market Share
The market competitive landscape provides details by competitor. Details included are company overview, company financials, revenue generated, market potential, investment in research and development, new market initiatives, global presence, production sites and facilities, production capacities, company strengths and weaknesses, product launch, product width and breadth, application dominance. The above data points provided are only related to the companies' focus related to market.
The Major Market Leaders Operating in the Market Are:
- Natus Medical Incorporated
- Medtronic plc
- NeuroSky, Inc.
- Compumedics Limited
- Grass Technologies (a Division of Natus Medical Inc.)
- EGI (Electrical Geodesics, Inc.)
- Emotiv Inc.
- Alpha Omega
- Cortech Solutions
- BrainScope Company, Inc.
Latest Developments in North America Electroencephalography Devices Market
- in September 2022, the acquisition of Dr. Langer Medical GmbH by Brainlab, a digital medical technology company, highlights a strategic alignment for seamless integration. Dr. Langer Medical GmbH, headquartered in Waldkirch, Germany, specializes in developing intraoperative neuromonitoring solutions and related equipment for surgical procedures.
- In July 2023, Cumulus Neuroscience, a digital health company, collaborated with two UK universities to enhance its at-home EEG headset, aiming to establish it as an early warning system for Alzheimer’s dementia.
SKU-

- Interactive Data Analysis Dashboard
- Company Analysis Dashboard for high growth potential opportunities
- Research Analyst Access for customization & queries
- Competitor Analysis with Interactive dashboard
- Latest News, Updates & Trend analysis
- Harness the Power of Benchmark Analysis for Comprehensive Competitor Tracking
Table of Content
1 INTRODUCTION
1.1 OBJECTIVES OF THE STUDY
1.2 MARKET DEFINITION
1.3 OVERVIEW OF NORTH AMERICA ELECTROENCEPHALOGRAPHY DEVICES MARKET
1.4 CURRENCY AND PRICING
1.5 LIMITATIONS
1.6 MARKETS COVERED
2 MARKET SEGMENTATION
2.1 MARKETS COVERED
2.2 GEOGRAPHICAL SCOPE
2.3 YEARS CONSIDERED FOR THE STUDY
2.4 DBMR TRIPOD DATA VALIDATION MODEL
2.5 PRIMARY INTERVIEWS WITH KEY OPINION LEADERS
2.6 MULTIVARIATE MODELLING
2.7 PRODUCT TYPE LIFELINE CURVE
2.8 DBMR MARKET POSITION GRID
2.9 MARKET APPLICATION COVERAGE GRID
2.1 VENDOR SHARE ANALYSIS
2.11 SECONDARY SOURCES
2.12 ASSUMPTIONS
3 EXECUTIVE SUMMARY
4 PREMIUM INSIGHT
5 EPIDERMIOLOGY
6 NORTH AMERICA ELECTROENCEPHALOGRAPHY DEVICES MARKET: REGULATORY FRAMEWORK
7 MARKET OVERVIEW
7.1 DRIVERS
7.1.1 INCREASING PREVALENCE OF NEUROLOGICAL DISORDERS
7.1.2 RISING AWARENESS ABOUT NEUROLOGICAL DISORDERS
7.1.3 RISING ADOPTION OF ELECTROENCEPHALOGRAPHY (EEG) DEVICES
7.1.4 INCREASING TECHNOLOGICAL ADVANCEMENT
7.1.5 STRATEGIC INITIATIVES TAKEN BY THE KEY MARKET PLAYERS
7.2 RESTRAINTS
7.2.1 HIGH COST OF COMPLEX BRAIN MONITORING DEVICES AND PROCEDURES
7.2.2 LIMITATIONS OF EEG MONITORING
7.2.3 DEARTH OF SKILLED PROFESSIONALS
7.3 OPPORTUNITIES
7.3.1 UNTAPPED MARKET
7.3.2 INCREASING HEALTHCARE EXPENDITURE
7.4 CHALLENGES
7.4.1 INFECTION DUE TO REPROCESSED EEGS
7.4.2 STRINGENT REGULATION FOR MANUFACTURING AND MARKETING OF EEGS
7.4.3 LACK OF REIMBURSEMENT
8 COVID-19 IMPACT ON NORTH AMERICA ELECTROENCEPHALOGRAPHY DEVICES MARKET
8.1 PRICE IMPACT
8.2 IMPACT ON DEMAND
8.3 IMPACT ON SUPPLY
8.4 STRATEGIC DECISIONS BY MANUFACTURERS
8.5 CONCLUSION
9 NORTH AMERICA ELECTROENCEPHALOGRAPHY DEVICES MARKET, BY PRODUCT TYPE
9.1 OVERVIEW
9.2 DEVICES
9.2.1 CHANNEL EEG
9.2.2-CHANNEL EEG
9.2.3 CHANNEL EEG
9.2.4 CHANNEL EEG
9.2.5 CHANNEL EEG
9.2.6 MULTIPLE CHANNEL EEG
9.3 ACCESSORIES
9.3.1 ELECTRODES
9.3.1.1 TYPE
9.3.1.1.1 WET ELECTRODES
9.3.1.1.2 DRY ELECTRODES
9.3.1.1.3 NEEDLE ELECTRODES
9.3.1.2 MATERIAL
9.3.1.2.1 SILVER
9.3.1.2.2 STAINLESS STEEL
9.3.1.2.3 TIN
9.3.1.2.4 GOLD
9.3.1.2.5 OTHERS
9.3.2 WEARABLE EEG
9.3.3 EEG BIOSENSORS
9.3.4 ADAPTORS
9.3.5 ELECTRICAL STIMULATOR
9.3.6 ELECTROENCEPHALOGRAPHY CAPS AND KITS
9.3.7 TRIGGER BOX
9.3.8 OTHERS
9.4 CONSUMABLES
9.4.1 CONDUCTIVE PASTE
9.4.2 ELECTRODE CAP GEL
9.4.3 ADHESIVE PATCHES
9.4.4 EEG COMB
9.4.5 OTHERS
10 NORTH AMERICA ELECTROENCEPHALOGRAPHY DEVICES MARKET, BY TYPE
10.1 OVERVIEW
10.2 STANDALONE
10.3 PORTABLE
10.4 WEARABLE
11 NORTH AMERICA ELECTROENCEPHALOGRAPHY DEVICES MARKET, BY USABILITY
11.1 OVERVIEW
11.2 REUSABLE
11.3 DISPOSABLE
11.4 SEMI-DISPOSABLE
12 NORTH AMERICA ELECTROENCEPHALOGRAPHY DEVICES MARKET, BY PROCEDURE
12.1 OVERVIEW
12.2 ROUTINE EEG
12.3 SLEEP-DEPRIVED EEG
12.4 AMBULATORY EEG
12.5 OTHERS
13 NORTH AMERICA ELECTROENCEPHALOGRAPHY DEVICES MARKET, BY FUNCTION
13.1 OVERVIEW
13.2 STANDARD EEG
13.3 AMBULATORY EEG
13.4 VIDEO EEG
14 NORTH AMERICA ELECTROENCEPHALOGRAPHY DEVICES MARKET, BY SIGNAL FREQUENCY
14.1 OVERVIEW
14.2 DELTA (3 HZ OR BELOW)
14.3 THETA (3.5 TO 7.5 HZ)
14.4 ALPHA (7.5 AND 13 HZ)
14.5 BETA (14 AND GREATER HZ)
15 NORTH AMERICA ELECTROENCEPHALOGRAPHY DEVICES MARKET, BY FILTERING SETTINGS
15.1 OVERVIEW
15.2 LOW FREQUENCY FILTER (1 HZ)
15.3 HIGH FREQUENCY FILTER (50-70 HZ
15.4 NOTCH FILTER
15.5 BANDPASS FILTER
16 NORTH AMERICA ELECTROENCEPHALOGRAPHY DEVICES MARKET, BY AGE GROUP
16.1 OVERVIEW
16.2 ADULT
16.3 PEDIATRIC
16.4 GERIATRIC
17 NORTH AMERICA ELECTROENCEPHALOGRAPHY DEVICES MARKET, BY APPLICATION
17.1 OVERVIEW
17.2 DISEASE DIAGNOSIS
17.2.1 MEDICAL INDICATION
17.2.1.1 Epilepsy
17.2.1.2 Seizures
17.2.1.3 Alzheimer's Disease
17.2.1.4 Dementia
17.2.1.5 Encephalitis (Brain Inflammation)
17.2.1.6 Head Injuries
17.2.1.7 Dizziness
17.2.1.8 Headaches
17.2.1.9 Brain Tumors
17.2.1.10 Others
17.2.2 DEVICES
17.2.2.1-Channel EEG
17.2.2.2-Channel EEG
17.2.2.3-Channel EEG
17.2.2.4-Channel EEG
17.2.2.5 8-Channel EEG
17.2.2.6 Multichannel EEG
17.3 SLEEP MONITORING
17.3.1 MEDICAL INDICATION
17.3.1.1 Obstructive Sleep Apnea
17.3.1.2 Stages Of Sleep
17.3.1.3 Sleep-Related Movement Disorders
17.3.1.4 Sleep-Related Breathing Disorders
17.3.1.5 Circadian Rhythm Sleep Disorders
17.3.1.6 Insomnia
17.3.1.7 Hypersomnia
17.3.1.8 Parasomnia
17.3.1.9 Others
17.3.2 DEVICES
17.3.2.1-Channel EEG
17.3.2.2-Channel EEG
17.3.2.3-Channel EEG
17.3.2.4-Channel EEG
17.3.2.5 8-Channel EEG
17.3.2.6 Multichannel EEG
17.4 ANESTHESIA MONITORING
17.4.1 MEDICAL INDICATION
17.4.1.1 Blood Pressure Monitor
17.4.1.2 End Tidal Co2 Monitor
17.4.1.3 Human Brain Activity
17.4.1.4 Others
17.4.2 DEVICES
17.4.2.1-Channel EEG
17.4.2.2-Channel EEG
17.4.2.3-Channel EEG
17.4.2.4-Channel EEG
17.4.2.5 8-Channel EEG
17.4.2.6 Multichannel EEG
17.5 TRAUMA & SURGERY
17.5.1 MEDICAL INDICATION
17.5.1.1 Traumatic Brain Injury (MTBI)
17.5.1.2 Head Trauma
17.5.1.3 Posttraumatic Stress Disorder (PTSD)
17.5.1.4 Others
17.5.2 DEVICES
17.5.2.1-Channel EEG
17.5.2.2-Channel EEG
17.5.2.3-Channel EEG
17.5.2.4-Channel EEG
17.5.2.5 8-Channel EEG
17.5.2.6 Multichannel EEG
17.6 OTHERS
18 NORTH AMERICA ELECTROENCEPHALOGRAPHY DEVICES MARKET, BY END USER
18.1 OVERVIEW
18.2 HOSPITALS
18.3 DIAGNOSTIC CENTERS
18.4 AMBULATORY SURGICAL CENTERS
18.5 NEUROLOGY CENTERS
18.6 ACADEMIC AND RESEARCH ORGANISATIONS
18.7 OTHERS
19 NORTH AMERICA ELECTROENCEPHALOGRAPHY DEVICES MARKET, BY DISTRIBUTION CHANNEL
19.1 OVERVIEW
19.2 DIRECT TENDER
19.3 RETAIL SALES
20 NORTH AMERICA ELECTROENCEPHALOGRAPHY DEVICES MARKET BY REGION
20.1 NORTH AMERICA
20.1.1 U.S.
20.1.2 CANADA
20.1.3 MEXICO
21 NORTH AMERICA ELECTROENCEPHALOGRAPHY DEVICES MARKET: COMPANY LANDSCAPE
21.1 COMPANY SHARE ANALYSIS: NORTH AMERICA
22 SWOT ANALYSIS
23 COMPANY PROFILE
23.1 MEDTRONIC
23.1.1 COMPANY SNAPSHOT
23.1.2 REVENUE ANALYSIS
23.1.3 COMPANY SHARE ANALYSIS
23.1.4 PRODUCT PORTFOLIO
23.1.5 RECENT DEVELOPMENT
23.2 NIHON KOHDEN CORPORATION
23.2.1 COMPANY SNAPSHOT
23.2.2 REVENUE ANALYSIS
23.2.3 COMPANY SHARE ANALYSIS
23.2.4 PRODUCT PORTFOLIO
23.2.5 RECENT DEVELOPMENT
23.3 MASIMO
23.3.1 COMPANY SNAPSHOT
23.3.2 REVENUE ANALYSIS
23.3.3 COMPANY SHARE ANALYSIS
23.3.4 PRODUCT PORTFOLIO
23.3.5 RECENT DEVELOPMENT
23.4 NATUS MEDICAL INCORPORATED
23.4.1 COMPANY SNAPSHOT
23.4.2 REVENUE ANALYSIS
23.4.3 COMPANY SHARE ANALYSIS
23.4.4 PRODUCT PORTFOLIO
23.4.5 RECENT DEVELOPMENTS
23.5 ELEKTA AB
23.5.1 COMPANY SNAPSHOT
23.5.2 REVENUE ANALYSIS
23.5.3 PRODUCT PORTFOLIO
23.5.4 RECENT DEVELOPMENT
23.6 CADWELL INDUSTRIES INC.
23.6.1 COMPANY SNAPSHOT
23.6.2 PRODUCT PORTFOLIO
23.6.3 RECENT DEVELOPMENT
23.7 ADVANCED BRAIN MONITORING, INC.
23.7.1 COMPANY SNAPSHOT
23.7.2 PRODUCT PORTFOLIO
23.7.3 RECENT DEVELOPMENT
23.8 BIO-SIGNAL GROUP CORP.
23.8.1 COMPANY SNAPSHOT
23.8.2 PRODUCT PORTFOLIO
23.8.3 RECENT DEVELOPMENTS
23.9 BITBRAIN TECHNOLOGIES
23.9.1 COMPANY SNAPSHOT
23.9.2 PRODUCT PORTFOLIO
23.9.3 RECENT DEVELOPMENT
23.1 BRAINSCOPE COMPANY INC
23.10.1 COMPANY SNAPSHOT
23.10.2 PRODUCT PORTFOLIO
23.10.3 RECENT DEVELOPMENTS
23.11 COMPUMEDICS LIMITED
23.11.1 COMPANY SNAPSHOT
23.11.2 REVENUE ANALYSIS
23.11.3 PRODUCT PORTFOLIO
23.11.4 RECENT DEVELOPMENTS
23.12 EB NEURO S.P.A.
23.12.1 COMPANY SNAPSHOT
23.12.2 PRODUCT PORTFOLIO
23.12.3 RECENT DEVELOPMENTS
23.13 ELECTRICAL GEODESICS, INC.
23.13.1 COMPANY SNAPSHOT
23.13.2 PRODUCT PORTFOLIO
23.13.3 RECENT DEVELOPMENT
23.14 ELMIKO MEDICAL SP. Z OO
23.14.1 COMPANY SNAPSHOT
23.14.2 PRODUCT PORTFOLIO
23.14.3 RECENT DEVELOPMENT
23.15 EMS HANDELS GESELLSCHAFT MBH
23.15.1 COMPANY SNAPSHOT
23.15.2 PRODUCT PORTFOLIO
23.15.3 RECENT DEVELOPMENT
23.16 G.TEC MEDICAL ENGINEERING GMBH AUSTRIA
23.16.1 COMPANY SNAPSHOT
23.16.2 PRODUCT PORTFOLIO
23.16.3 RECENT DEVELOPMENT
23.17 JORDAN NEUROSCIENCE, INC.
23.17.1 COMPANY SNAPSHOT
23.17.2 PRODUCT PORTFOLIO
23.17.3 RECENT DEVELOPMENT
23.18 LIFELINES NEURO
23.18.1 COMPANY SNAPSHOT
23.18.2 PRODUCT PORTFOLIO
23.18.3 RECENT DEVELOPMENTS
23.19 MICROMED S.P.A.
23.19.1 COMPANY SNAPSHOT
23.19.2 PRODUCT PORTFOLIO
23.19.3 RECENT DEVELOPMENT
23.2 NEUROSKY
23.20.1 COMPANY SNAPSHOT
23.20.2 PRODUCT PORTFOLIO
23.20.3 RECENT DEVELOPMENT
23.21 NEUROSOFT S.A.
23.21.1 COMPANY SNAPSHOT
23.21.2 PRODUCT PORTFOLIO
23.21.3 RECENT DEVELOPMENT
23.22 NEUROWAVE SYSTEMS INC.
23.22.1 COMPANY SNAPSHOT
23.22.2 PRODUCT PORTFOLIO
23.22.3 RECENT DEVELOPMENTS
24 QUESTIONNAIRE
25 RELATED REPORTS
List of Table
TABLE 1 COST OF SOME EEG DEVICES
TABLE 2 PERCENTAGE GROWTH IIN HEALTHCARE EXPENDITURE BY DIFFERENT DIVISIONS (U.S., 2019)
TABLE 3 REGULATIONS FOR MEDICAL DEVICES (EEG- CLASSII MEDICAL DEVICES) IN THE U.S.
TABLE 4 REQUIRED CLINICAL INFORMATION
TABLE 5 NORTH AMERICA ELECTROENCEPHALOGRAPHY DEVICES MARKET, BY PRODUCT TYPE, 2019-2028 (USD MILLION)
TABLE 6 NORTH AMERICA DEVICES IN ELECTROENCEPHALOGRAPHY DEVICES MARKET, BY REGION, 2019-2028 (USD MILLION)
TABLE 7 NORTH AMERICA DEVICES IN ELECTROENCEPHALOGRAPHY DEVICES MARKET, BY PRODUCT TYPE, 2019-2028 (USD MILLION)
TABLE 8 NORTH AMERICA ACCESSORIES IN ELECTROENCEPHALOGRAPHY DEVICES MARKET, BY REGION, 2019-2028 (USD MILLION)
TABLE 9 NORTH AMERICA ACCESSORIES IN ELECTROENCEPHALOGRAPHY DEVICES MARKET, BY PRODUCT TYPE, 2019-2028 (USD MILLION)
TABLE 10 NORTH AMERICA TYPE IN ELECTROENCEPHALOGRAPHY DEVICES MARKET, BY PRODUCT TYPE, 2019-2028 (USD MILLION)
TABLE 11 NORTH AMERICA MATERIAL IN ELECTROENCEPHALOGRAPHY DEVICES MARKET, BY PRODUCT TYPE, 2019-2028 (USD MILLION)
TABLE 12 NORTH AMERICA CONSUMABLES IN ELECTROENCEPHALOGRAPHY DEVICES MARKET, BY REGION, 2019-2028 (USD MILLION)
TABLE 13 NORTH AMERICA CONSUMABLES IN ELECTROENCEPHALOGRAPHY DEVICES MARKET, BY PRODUCT TYPE, 2019-2028 (USD MILLION)
TABLE 14 NORTH AMERICA ELECTROENCEPHALOGRAPHY DEVICES MARKET, BY TYPE, 2019-2028 (USD MILLION)
TABLE 15 NORTH AMERICA ELECTROENCEPHALOGRAPHY DEVICES MARKET, BY STANDALONE, BY REGION, 2021-2028 (USD MILLION)
TABLE 16 NORTH AMERICA ELECTROENCEPHALOGRAPHY DEVICES MARKET, BY PORTABLE, BY REGION, 2021-2028 (USD MILLION)
TABLE 17 NORTH AMERICA ELECTROENCEPHALOGRAPHY DEVICES MARKET, BY VOLUME COILS, BY REGION, 2021-2028 (USD MILLION)
TABLE 18 NORTH AMERICA ELECTROENCEPHALOGRAPHY DEVICES MARKET, BY USABILITY, 2019-2028 (USD MILLION)
TABLE 19 NORTH AMERICA REUSABLE IN ELECTROENCEPHALOGRAPHY DEVICES MARKET, BY REGION, 2019-2028 (USD MILLION)
TABLE 20 NORTH AMERICA DISPOSABLE IN ELECTROENCEPHALOGRAPHY DEVICES MARKET, BY REGION, 2019-2028 (USD MILLION)
TABLE 21 NORTH AMERICA SEMIDISPOSABLE IN ELECTROENCEPHALOGRAPHY DEVICES MARKET, BY REGION, 2019-2028 (USD MILLION)
TABLE 22 NORTH AMERICA ELECTROENCEPHALOGRAPHY DEVICES MARKET, BY PROCEDURE, 2019-2028 (USD MILLION)
TABLE 23 NORTH AMERICA ELECTROENCEPHALOGRAPHY DEVICES MARKET, BY ROUTINE EEG, BY REGION, 2021-2028 (USD MILLION)
TABLE 24 NORTH AMERICA ELECTROENCEPHALOGRAPHY DEVICES MARKET, BY SLEEP-DEPRIVED EEG, BY REGION, 2021-2028 (USD MILLION)
TABLE 25 NORTH AMERICA ELECTROENCEPHALOGRAPHY DEVICES MARKET, BY AMBULATORY EEG, BY REGION, 2021-2028 (USD MILLION)
TABLE 26 NORTH AMERICA ELECTROENCEPHALOGRAPHY DEVICES MARKET, BY OTHERS, BY REGION, 2021-2028 (USD MILLION)
TABLE 27 NORTH AMERICA ELECTROENCEPHALOGRAPHY DEVICES MARKET, BY FUNCTION, 2019-2028 (USD MILLION)
TABLE 28 NORTH AMERICA STANDARD EEG IN ELECTROENCEPHALOGRAPHY DEVICES MARKET, BY REGION, 2019-2028 (USD MILLION)
TABLE 29 NORTH AMERICA AMBULATORY EEG IN ELECTROENCEPHALOGRAPHY DEVICES MARKET, BY REGION, 2019-2028 (USD MILLION)
TABLE 30 NORTH AMERICA VIDEO EEG IN ELECTROENCEPHALOGRAPHY DEVICES MARKET, BY REGION, 2019-2028 (USD MILLION)
TABLE 31 NORTH AMERICA ELECTROENCEPHALOGRAPHY DEVICES MARKET, BY SIGNAL FREQUENCY, 2019-2028 (USD MILLION)
TABLE 32 NORTH AMERICA DELTA (3 HZ OR BELOW) IN ELECTROENCEPHALOGRAPHY DEVICES MARKET, BY REGION, 2019-2028 (USD MILLION)
TABLE 33 NORTH AMERICA THETA (3.5 TO 7.5 HZ) IN ELECTROENCEPHALOGRAPHY DEVICES MARKET, BY REGION, 2019-2028 (USD MILLION)
TABLE 34 NORTH AMERICA ALPHA (7.5 AND 13 HZ) IN ELECTROENCEPHALOGRAPHY DEVICES MARKET, BY REGION, 2019-2028 (USD MILLION)
TABLE 35 NORTH AMERICA BETA (14 AND GREATER HZ) IN ELECTROENCEPHALOGRAPHY DEVICES MARKET, BY REGION, 2019-2028 (USD MILLION)
TABLE 36 NORTH AMERICA ELECTROENCEPHALOGRAPHY DEVICES MARKET, BY FILTERING SETTINGS, 2019-2028 (USD MILLION)
TABLE 37 NORTH AMERICA LOW FREQUENCY FILTER (1 HZ) IN ELECTROENCEPHALOGRAPHY DEVICES MARKET, BY REGION, 2019-2028 (USD MILLION)
TABLE 38 NORTH AMERICA HIGH FREQUENCY FILTER (50-70 HZ) IN ELECTROENCEPHALOGRAPHY DEVICES MARKET, BY REGION, 2019-2028 (USD MILLION)
TABLE 39 NORTH AMERICA NOTCH FILTER IN ELECTROENCEPHALOGRAPHY DEVICES MARKET, BY REGION, 2019-2028 (USD MILLION)
TABLE 40 NORTH AMERICA BANDPASS FILTER IN ELECTROENCEPHALOGRAPHY DEVICES MARKET, BY REGION, 2019-2028 (USD MILLION)
TABLE 41 NORTH AMERICA ELECTROENCEPHALOGRAPHY DEVICES MARKET, BY AGE GROUP, 2019-2028 (USD MILLION)
TABLE 42 NORTH AMERICA ELECTROENCEPHALOGRAPHY DEVICES MARKET, BY ADULT, BY REGION, 2021-2028 (USD MILLION)
TABLE 43 NORTH AMERICA ELECTROENCEPHALOGRAPHY DEVICES MARKET, BY PEDIATRIC, BY REGION, 2021-2028 (USD MILLION)
TABLE 44 NORTH AMERICA ELECTROENCEPHALOGRAPHY DEVICES MARKET, BY GERIATRIC, BY REGION, 2021-2028 (USD MILLION)
TABLE 45 NORTH AMERICA ELECTROENCEPHALOGRAPHY DEVICES MARKET, BY APPLICATION, 2019-2028 (USD MILLION)
TABLE 46 NORTH AMERICA DISEASE DIAGNOSIS IN ELECTROENCEPHALOGRAPHY DEVICES MARKET, BY REGION, 2019-2028 (USD MILLION)
TABLE 47 NORTH AMERICA MEDICAL INDICATION IN DISEASE DIAGNOSIS IN ELECTROENCEPHALOGRAPHY DEVICES MARKET, BY APPLICATION, 2019-2028 (USD MILLION)
TABLE 48 NORTH AMERICA ELECTROENCEPHALOGRAPHY DEVICES MARKET, BY PRODUCT TYPE, 2019-2028 (USD MILLION)
TABLE 49 NORTH AMERICA PRODUCT TYPE IN DISEASE DIAGNOSIS IN ELECTROENCEPHALOGRAPHY DEVICES MARKET, BY APPLICATION, 2019-2028 (USD MILLION)
TABLE 50 NORTH AMERICA SLEEP MONITORING IN ELECTROENCEPHALOGRAPHY DEVICES MARKET, BY REGION, 2019-2028 (USD MILLION)
TABLE 51 NORTH AMERICA MEDICAL INDICATION IN SLEEP MONITORING IN ELECTROENCEPHALOGRAPHY DEVICES MARKET, BY APPLICATION, 2019-2028 (USD MILLION)
TABLE 52 NORTH AMERICA ELECTROENCEPHALOGRAPHY DEVICES MARKET, BY PRODUCT TYPE, 2019-2028 (USD MILLION)
TABLE 53 NORTH AMERICA PRODUCT TYPE IN SLEEP MONITORING IN ELECTROENCEPHALOGRAPHY DEVICES MARKET, BY APPLICATION, 2019-2028 (USD MILLION)
TABLE 54 NORTH AMERICA ANESTHESIA MONITORING IN ELECTROENCEPHALOGRAPHY DEVICES MARKET, BY REGION, 2019-2028 (USD MILLION)
TABLE 55 NORTH AMERICA MEDICAL INDICATION IN ANESTHESIA MONITORING IN ELECTROENCEPHALOGRAPHY DEVICES MARKET, BY APPLICATION, 2019-2028 (USD MILLION)
TABLE 56 NORTH AMERICA ELECTROENCEPHALOGRAPHY DEVICES MARKET, BY PRODUCT TYPE, 2019-2028 (USD MILLION)
TABLE 57 NORTH AMERICA PRODUCT TYPE IN ANESTHESIA MONITORING IN ELECTROENCEPHALOGRAPHY DEVICES MARKET, BY APPLICATION, 2019-2028 (USD MILLION)
TABLE 58 NORTH AMERICA TRAUMA & SURGERY IN ELECTROENCEPHALOGRAPHY DEVICES MARKET, BY REGION, 2019-2028 (USD MILLION)
TABLE 59 NORTH AMERICA MEDICAL INDICATION IN TRAUMA & SURGERY IN ELECTROENCEPHALOGRAPHY DEVICES MARKET, BY APPLICATION, 2019-2028 (USD MILLION)
TABLE 60 NORTH AMERICA ELECTROENCEPHALOGRAPHY DEVICES MARKET, BY PRODUCT TYPE, 2019-2028 (USD MILLION)
TABLE 61 NORTH AMERICA PRODUCT TYPE IN TRAUMA & SURGERY IN ELECTROENCEPHALOGRAPHY DEVICES MARKET, BY APPLICATION, 2019-2028 (USD MILLION)
TABLE 62 NORTH AMERICA OTHERS IN ELECTROENCEPHALOGRAPHY DEVICES MARKET, BY REGION, 2019-2028 (USD MILLION)
TABLE 63 NORTH AMERICA ELECTROENCEPHALOGRAPHY DEVICES MARKET, BY END USER, 2019-2028 (USD MILLION)
TABLE 64 NORTH AMERICA ELECTROENCEPHALOGRAPHY DEVICES MARKET, BY HOSPITALS, BY REGION, 2021-2028 (USD MILLION)
TABLE 65 NORTH AMERICA ELECTROENCEPHALOGRAPHY DEVICES MARKET, BY DIAGNOSTIC CENTERS, BY REGION, 2021-2028 (USD MILLION)
TABLE 66 NORTH AMERICA ELECTROENCEPHALOGRAPHY DEVICES MARKET, BY AMBULATORY SURGICAL CENTERS, BY REGION, 2021-2028 (USD MILLION)
TABLE 67 NORTH AMERICA ELECTROENCEPHALOGRAPHY DEVICES MARKET, BY NEUROLOGY CENTERS, BY REGION, 2021-2028 (USD MILLION)
TABLE 68 NORTH AMERICA ELECTROENCEPHALOGRAPHY DEVICES MARKET, BY ACADEMIC AND RESEARCH ORGANISATIONS, BY REGION, 2021-2028 (USD MILLION)
TABLE 69 NORTH AMERICA ELECTROENCEPHALOGRAPHY DEVICES MARKET, BY OTHERS, BY REGION, 2021-2028 (USD MILLION)
TABLE 70 NORTH AMERICA ELECTROENCEPHALOGRAPHY DEVICES MARKET, BY DISTRIBUTION CHANNEL, 2019-2028 (USD MILLION)
TABLE 71 NORTH AMERICA DIRECT TENDER IN ELECTROENCEPHALOGRAPHY DEVICES MARKET, BY REGION, 2019-2028 (USD MILLION)
TABLE 72 NORTH AMERICA RETAIL SALES IN ELECTROENCEPHALOGRAPHY DEVICES MARKET, BY REGION, 2019-2028 (USD MILLION)
TABLE 73 NORTH AMERICA ELECTROENCEPHALOGRAPHY DEVICES MARKET, BY COUNTRY, 2019-2028 (USD MILLION)
TABLE 74 NORTH AMERICA ELECTROENCEPHALOGRAPHY DEVICES MARKET, BY PRODUCT TYPE, 2019-2028 (USD MILLION)
TABLE 75 NORTH AMERICA ELECTROENCEPHALOGRAPHY DEVICES MARKET, BY PRODUCT TYPE 2019-2028 (UNITS)
TABLE 76 NORTH AMERICA DEVICES IN ELECTROENCEPHALOGRAPHY DEVICES MARKET, BY PRODUCT TYPE, 2019-2028 (USD MILLION)
TABLE 77 NORTH AMERICA ACCESSORIES IN ELECTROENCEPHALOGRAPHY DEVICES MARKET, BY PRODUCT TYPE, 2019-2028 (USD MILLION)
TABLE 78 NORTH AMERICA ELECTRODES BY TYPE IN ELECTROENCEPHALOGRAPHY DEVICES MARKET, BY PRODUCT TYPE, 2019-2028 (USD MILLION)
TABLE 79 NORTH AMERICA ELECTRODES BY MATERIAL IN ELECTROENCEPHALOGRAPHY DEVICES MARKET, BY PRODUCT TYPE, 2019-2028 (USD MILLION)
TABLE 80 NORTH AMERICA CONSUMABLES IN ELECTROENCEPHALOGRAPHY DEVICES MARKET, BY PRODUCT TYPE, 2019-2028 (USD MILLION)
TABLE 81 NORTH AMERICA ELECTROENCEPHALOGRAPHY DEVICES MARKET, BY TYPE, 2019-2028 (USD MILLION)
TABLE 82 NORTH AMERICA ELECTROENCEPHALOGRAPHY DEVICES MARKET, BY USABILITY, 2019-2028 (USD MILLION)
TABLE 83 NORTH AMERICA ELECTROENCEPHALOGRAPHY DEVICES MARKET, BY PROCEDURE, 2019-2028 (USD MILLION)
TABLE 84 NORTH AMERICA ELECTROENCEPHALOGRAPHY DEVICES MARKET, BY FUNCTION, 2019-2028 (USD MILLION)
TABLE 85 NORTH AMERICA ELECTROENCEPHALOGRAPHY DEVICES MARKET, BY SIGNAL FREQUENCY, 2019-2028 (USD MILLION)
TABLE 86 NORTH AMERICA ELECTROENCEPHALOGRAPHY DEVICES MARKET, BY FILTERING SETTINGS, 2019-2028 (USD MILLION)
TABLE 87 NORTH AMERICA ELECTROENCEPHALOGRAPHY DEVICES MARKET, AGE GROUP, 2019-2028 (USD MILLION)
TABLE 88 NORTH AMERICA ELECTROENCEPHALOGRAPHY DEVICES MARKET, BY APPLICATION, 2019-2028 (USD MILLION)
TABLE 89 NORTH AMERICA MEDICAL INDICATION IN DISEASE DIAGNOSIS IN ELECTROENCEPHALOGRAPHY DEVICES MARKET, BY APPLICATION, 2019-2028 (USD MILLION)
TABLE 90 NORTH AMERICA ELECTROENCEPHALOGRAPHY DEVICES MARKET, BY PRODUCT TYPE 2019-2028 (USD MILLION)
TABLE 91 NORTH AMERICA PRODUCT TYPE IN DISEASE DIAGNOSIS IN ELECTROENCEPHALOGRAPHY DEVICES MARKET, BY APPLICATION, 2019-2028 (USD MILLION)
TABLE 92 NORTH AMERICA MEDICAL INDICATION IN SLEEP MONITORING IN ELECTROENCEPHALOGRAPHY DEVICES MARKET, BY APPLICATION, 2019-2028 (USD MILLION)
TABLE 93 NORTH AMERICA ELECTROENCEPHALOGRAPHY DEVICES MARKET, BY PRODUCT TYPE 2019-2028 (USD MILLION)
TABLE 94 NORTH AMERICA PRODUCT TYPE IN SLEEP MONITORING IN ELECTROENCEPHALOGRAPHY DEVICES MARKET, BY APPLICATION, 2019-2028 (USD MILLION)
TABLE 95 NORTH AMERICA MEDICAL INDICATION IN ANESTHESIA MONITORING IN ELECTROENCEPHALOGRAPHY DEVICES MARKET, BY APPLICATION, 2019-2028 (USD MILLION)
TABLE 96 NORTH AMERICA ELECTROENCEPHALOGRAPHY DEVICES MARKET, BY PRODUCT TYPE 2019-2028 (USD MILLION)
TABLE 97 NORTH AMERICA PRODUCT TYPE IN ANESTHESIA MONITORING IN ELECTROENCEPHALOGRAPHY DEVICES MARKET, BY APPLICATION, 2019-2028 (USD MILLION)
TABLE 98 NORTH AMERICA MEDICAL INDICATION IN TRAUMA & SURGERY IN ELECTROENCEPHALOGRAPHY DEVICES MARKET, BY APPLICATION, 2019-2028 (USD MILLION)
TABLE 99 NORTH AMERICA ELECTROENCEPHALOGRAPHY DEVICES MARKET, BY PRODUCT TYPE 2019-2028 (USD MILLION)
TABLE 100 NORTH AMERICA PRODUCT TYPE IN TRAUMA & SURGERY IN ELECTROENCEPHALOGRAPHY DEVICES MARKET, BY APPLICATION, 2019-2028 (USD MILLION)
TABLE 101 NORTH AMERICA ELECTROENCEPHALOGRAPHY DEVICES MARKET, BY END USER, 2019-2028 (USD MILLION)
TABLE 102 NORTH AMERICA ELECTROENCEPHALOGRAPHY DEVICES MARKET, BY DISTRIBUTION CHANNEL, 2019-2028 (USD MILLION)
TABLE 103 U.S. ELECTROENCEPHALOGRAPHY DEVICES MARKET, BY PRODUCT TYPE, 2019-2028 (USD MILLION)
TABLE 104 U.S. ELECTROENCEPHALOGRAPHY DEVICES MARKET, BY PRODUCT TYPE 2019-2028 (UNITS)
TABLE 105 U.S. DEVICES IN ELECTROENCEPHALOGRAPHY DEVICES MARKET, BY PRODUCT TYPE, 2019-2028 (USD MILLION)
TABLE 106 U.S. ACCESSORIES IN ELECTROENCEPHALOGRAPHY DEVICES MARKET, BY PRODUCT TYPE, 2019-2028 (USD MILLION)
TABLE 107 U.S. ELECTRODES BY TYPE IN ELECTROENCEPHALOGRAPHY DEVICES MARKET, BY PRODUCT TYPE, 2019-2028 (USD MILLION)
TABLE 108 U.S. ELECTRODES BY MATERIAL IN ELECTROENCEPHALOGRAPHY DEVICES MARKET, BY PRODUCT TYPE, 2019-2028 (USD MILLION)
TABLE 109 U.S. CONSUMABLES IN ELECTROENCEPHALOGRAPHY DEVICES MARKET, BY PRODUCT TYPE, 2019-2028 (USD MILLION)
TABLE 110 U.S. ELECTROENCEPHALOGRAPHY DEVICES MARKET, BY TYPE, 2019-2028 (USD MILLION)
TABLE 111 U.S. ELECTROENCEPHALOGRAPHY DEVICES MARKET, BY USABILITY, 2019-2028 (USD MILLION)
TABLE 112 U.S. ELECTROENCEPHALOGRAPHY DEVICES MARKET, BY PROCEDURE, 2019-2028 (USD MILLION)
TABLE 113 U.S. ELECTROENCEPHALOGRAPHY DEVICES MARKET, BY FUNCTION, 2019-2028 (USD MILLION)
TABLE 114 U.S. ELECTROENCEPHALOGRAPHY DEVICES MARKET, BY SIGNAL FREQUENCY, 2019-2028 (USD MILLION)
TABLE 115 U.S. ELECTROENCEPHALOGRAPHY DEVICES MARKET, BY FILTERING SETTINGS, 2019-2028 (USD MILLION)
TABLE 116 U.S. ELECTROENCEPHALOGRAPHY DEVICES MARKET, AGE GROUP, 2019-2028 (USD MILLION)
TABLE 117 U.S. ELECTROENCEPHALOGRAPHY DEVICES MARKET, BY APPLICATION, 2019-2028 (USD MILLION)
TABLE 118 U.S. MEDICAL INDICATION IN DISEASE DIAGNOSIS IN ELECTROENCEPHALOGRAPHY DEVICES MARKET, BY APPLICATION, 2019-2028 (USD MILLION)
TABLE 119 U.S. ELECTROENCEPHALOGRAPHY DEVICES MARKET, BY PRODUCT TYPE 2019-2028 (USD MILLION)
TABLE 120 U.S. PRODUCT TYPE IN DISEASE DIAGNOSIS IN ELECTROENCEPHALOGRAPHY DEVICES MARKET, BY APPLICATION, 2019-2028 (USD MILLION)
TABLE 121 U.S. MEDICAL INDICATION IN SLEEP MONITORING IN ELECTROENCEPHALOGRAPHY DEVICES MARKET, BY APPLICATION, 2019-2028 (USD MILLION)
TABLE 122 U.S. ELECTROENCEPHALOGRAPHY DEVICES MARKET, BY PRODUCT TYPE 2019-2028 (USD MILLION)
TABLE 123 U.S. PRODUCT TYPE IN SLEEP MONITORING IN ELECTROENCEPHALOGRAPHY DEVICES MARKET, BY APPLICATION, 2019-2028 (USD MILLION)
TABLE 124 U.S. MEDICAL INDICATION IN ANESTHESIA MONITORING IN ELECTROENCEPHALOGRAPHY DEVICES MARKET, BY APPLICATION, 2019-2028 (USD MILLION)
TABLE 125 U.S. ELECTROENCEPHALOGRAPHY DEVICES MARKET, BY PRODUCT TYPE 2019-2028 (USD MILLION)
TABLE 126 U.S. PRODUCT TYPE IN ANESTHESIA MONITORING IN ELECTROENCEPHALOGRAPHY DEVICES MARKET, BY APPLICATION, 2019-2028 (USD MILLION)
TABLE 127 U.S. MEDICAL INDICATION IN TRAUMA & SURGERY IN ELECTROENCEPHALOGRAPHY DEVICES MARKET, BY APPLICATION, 2019-2028 (USD MILLION)
TABLE 128 U.S. ELECTROENCEPHALOGRAPHY DEVICES MARKET, BY PRODUCT TYPE 2019-2028 (USD MILLION)
TABLE 129 U.S. PRODUCT TYPE IN TRAUMA & SURGERY IN ELECTROENCEPHALOGRAPHY DEVICES MARKET, BY APPLICATION, 2019-2028 (USD MILLION)
TABLE 130 U.S. ELECTROENCEPHALOGRAPHY DEVICES MARKET, BY END USER, 2019-2028 (USD MILLION)
TABLE 131 U.S. ELECTROENCEPHALOGRAPHY DEVICES MARKET, BY DISTRIBUTION CHANNEL, 2019-2028 (USD MILLION)
TABLE 132 CANADA ELECTROENCEPHALOGRAPHY DEVICES MARKET, BY PRODUCT TYPE, 2019-2028 (USD MILLION)
TABLE 133 CANADA ELECTROENCEPHALOGRAPHY DEVICES MARKET, BY PRODUCT TYPE 2019-2028 (UNITS)
TABLE 134 CANADA DEVICES IN ELECTROENCEPHALOGRAPHY DEVICES MARKET, BY PRODUCT TYPE, 2019-2028 (USD MILLION)
TABLE 135 CANADA ACCESSORIES IN ELECTROENCEPHALOGRAPHY DEVICES MARKET, BY PRODUCT TYPE, 2019-2028 (USD MILLION)
TABLE 136 CANADA ELECTRODES BY TYPE IN ELECTROENCEPHALOGRAPHY DEVICES MARKET, BY PRODUCT TYPE, 2019-2028 (USD MILLION)
TABLE 137 CANADA ELECTRODES BY MATERIAL IN ELECTROENCEPHALOGRAPHY DEVICES MARKET, BY PRODUCT TYPE, 2019-2028 (USD MILLION)
TABLE 138 CANADA CONSUMABLES IN ELECTROENCEPHALOGRAPHY DEVICES MARKET, BY PRODUCT TYPE, 2019-2028 (USD MILLION)
TABLE 139 CANADA ELECTROENCEPHALOGRAPHY DEVICES MARKET, BY TYPE, 2019-2028 (USD MILLION)
TABLE 140 CANADA ELECTROENCEPHALOGRAPHY DEVICES MARKET, BY USABILITY, 2019-2028 (USD MILLION)
TABLE 141 CANADA ELECTROENCEPHALOGRAPHY DEVICES MARKET, BY PROCEDURE, 2019-2028 (USD MILLION)
TABLE 142 CANADA ELECTROENCEPHALOGRAPHY DEVICES MARKET, BY FUNCTION, 2019-2028 (USD MILLION)
TABLE 143 CANADA ELECTROENCEPHALOGRAPHY DEVICES MARKET, BY SIGNAL FREQUENCY, 2019-2028 (USD MILLION)
TABLE 144 CANADA ELECTROENCEPHALOGRAPHY DEVICES MARKET, BY FILTERING SETTINGS, 2019-2028 (USD MILLION)
TABLE 145 CANADA ELECTROENCEPHALOGRAPHY DEVICES MARKET, AGE GROUP, 2019-2028 (USD MILLION)
TABLE 146 CANADA ELECTROENCEPHALOGRAPHY DEVICES MARKET, BY APPLICATION, 2019-2028 (USD MILLION)
TABLE 147 CANADA MEDICAL INDICATION IN DISEASE DIAGNOSIS IN ELECTROENCEPHALOGRAPHY DEVICES MARKET, BY APPLICATION, 2019-2028 (USD MILLION)
TABLE 148 CANADA ELECTROENCEPHALOGRAPHY DEVICES MARKET, BY PRODUCT TYPE 2019-2028 (USD MILLION)
TABLE 149 CANADA PRODUCT TYPE IN DISEASE DIAGNOSIS IN ELECTROENCEPHALOGRAPHY DEVICES MARKET, BY APPLICATION, 2019-2028 (USD MILLION)
TABLE 150 CANADA MEDICAL INDICATION IN SLEEP MONITORING IN ELECTROENCEPHALOGRAPHY DEVICES MARKET, BY APPLICATION, 2019-2028 (USD MILLION)
TABLE 151 CANADA ELECTROENCEPHALOGRAPHY DEVICES MARKET, BY PRODUCT TYPE 2019-2028 (USD MILLION)
TABLE 152 CANADA PRODUCT TYPE IN SLEEP MONITORING IN ELECTROENCEPHALOGRAPHY DEVICES MARKET, BY APPLICATION, 2019-2028 (USD MILLION)
TABLE 153 CANADA MEDICAL INDICATION IN ANESTHESIA MONITORING IN ELECTROENCEPHALOGRAPHY DEVICES MARKET, BY APPLICATION, 2019-2028 (USD MILLION)
TABLE 154 CANADA ELECTROENCEPHALOGRAPHY DEVICES MARKET, BY PRODUCT TYPE 2019-2028 (USD MILLION)
TABLE 155 CANADA PRODUCT TYPE IN ANESTHESIA MONITORING IN ELECTROENCEPHALOGRAPHY DEVICES MARKET, BY APPLICATION, 2019-2028 (USD MILLION)
TABLE 156 CANADA MEDICAL INDICATION IN TRAUMA & SURGERY IN ELECTROENCEPHALOGRAPHY DEVICES MARKET, BY APPLICATION, 2019-2028 (USD MILLION)
TABLE 157 CANADA ELECTROENCEPHALOGRAPHY DEVICES MARKET, BY PRODUCT TYPE 2019-2028 (USD MILLION)
TABLE 158 CANADA PRODUCT TYPE IN TRAUMA & SURGERY IN ELECTROENCEPHALOGRAPHY DEVICES MARKET, BY APPLICATION, 2019-2028 (USD MILLION)
TABLE 159 CANADA ELECTROENCEPHALOGRAPHY DEVICES MARKET, BY END USER, 2019-2028 (USD MILLION)
TABLE 160 CANADA ELECTROENCEPHALOGRAPHY DEVICES MARKET, BY DISTRIBUTION CHANNEL, 2019-2028 (USD MILLION)
TABLE 161 MEXICO ELECTROENCEPHALOGRAPHY DEVICES MARKET, BY PRODUCT TYPE, 2019-2028 (USD MILLION)
TABLE 162 MEXICO ELECTROENCEPHALOGRAPHY DEVICES MARKET, BY PRODUCT TYPE 2019-2028 (UNITS)
TABLE 163 MEXICO DEVICES IN ELECTROENCEPHALOGRAPHY DEVICES MARKET, BY PRODUCT TYPE, 2019-2028 (USD MILLION)
TABLE 164 MEXICO ACCESSORIES IN ELECTROENCEPHALOGRAPHY DEVICES MARKET, BY PRODUCT TYPE, 2019-2028 (USD MILLION)
TABLE 165 MEXICO ELECTRODES BY TYPE IN ELECTROENCEPHALOGRAPHY DEVICES MARKET, BY PRODUCT TYPE, 2019-2028 (USD MILLION)
TABLE 166 MEXICO ELECTRODES BY MATERIAL IN ELECTROENCEPHALOGRAPHY DEVICES MARKET, BY PRODUCT TYPE, 2019-2028 (USD MILLION)
TABLE 167 MEXICO CONSUMABLES IN ELECTROENCEPHALOGRAPHY DEVICES MARKET, BY PRODUCT TYPE, 2019-2028 (USD MILLION)
TABLE 168 MEXICO ELECTROENCEPHALOGRAPHY DEVICES MARKET, BY TYPE, 2019-2028 (USD MILLION)
TABLE 169 MEXICO ELECTROENCEPHALOGRAPHY DEVICES MARKET, BY USABILITY, 2019-2028 (USD MILLION)
TABLE 170 MEXICO ELECTROENCEPHALOGRAPHY DEVICES MARKET, BY PROCEDURE, 2019-2028 (USD MILLION)
TABLE 171 MEXICO ELECTROENCEPHALOGRAPHY DEVICES MARKET, BY FUNCTION, 2019-2028 (USD MILLION)
TABLE 172 MEXICO ELECTROENCEPHALOGRAPHY DEVICES MARKET, BY SIGNAL FREQUENCY, 2019-2028 (USD MILLION)
TABLE 173 MEXICO ELECTROENCEPHALOGRAPHY DEVICES MARKET, BY FILTERING SETTINGS, 2019-2028 (USD MILLION)
TABLE 174 MEXICO ELECTROENCEPHALOGRAPHY DEVICES MARKET, AGE GROUP, 2019-2028 (USD MILLION)
TABLE 175 MEXICO ELECTROENCEPHALOGRAPHY DEVICES MARKET, BY APPLICATION, 2019-2028 (USD MILLION)
TABLE 176 MEXICO MEDICAL INDICATION IN DISEASE DIAGNOSIS IN ELECTROENCEPHALOGRAPHY DEVICES MARKET, BY APPLICATION, 2019-2028 (USD MILLION)
TABLE 177 MEXICO ELECTROENCEPHALOGRAPHY DEVICES MARKET, BY PRODUCT TYPE 2019-2028 (USD MILLION)
TABLE 178 MEXICO PRODUCT TYPE IN DISEASE DIAGNOSIS IN ELECTROENCEPHALOGRAPHY DEVICES MARKET, BY APPLICATION, 2019-2028 (USD MILLION)
TABLE 179 MEXICO MEDICAL INDICATION IN SLEEP MONITORING IN ELECTROENCEPHALOGRAPHY DEVICES MARKET, BY APPLICATION, 2019-2028 (USD MILLION)
TABLE 180 MEXICO ELECTROENCEPHALOGRAPHY DEVICES MARKET, BY PRODUCT TYPE 2019-2028 (USD MILLION)
TABLE 181 MEXICO PRODUCT TYPE IN SLEEP MONITORING IN ELECTROENCEPHALOGRAPHY DEVICES MARKET, BY APPLICATION, 2019-2028 (USD MILLION)
TABLE 182 MEXICO MEDICAL INDICATION IN ANESTHESIA MONITORING IN ELECTROENCEPHALOGRAPHY DEVICES MARKET, BY APPLICATION, 2019-2028 (USD MILLION)
TABLE 183 MEXICO ELECTROENCEPHALOGRAPHY DEVICES MARKET, BY PRODUCT TYPE 2019-2028 (USD MILLION)
TABLE 184 MEXICO PRODUCT TYPE IN ANESTHESIA MONITORING IN ELECTROENCEPHALOGRAPHY DEVICES MARKET, BY APPLICATION, 2019-2028 (USD MILLION)
TABLE 185 MEXICO MEDICAL INDICATION IN TRAUMA & SURGERY IN ELECTROENCEPHALOGRAPHY DEVICES MARKET, BY APPLICATION, 2019-2028 (USD MILLION)
TABLE 186 MEXICO ELECTROENCEPHALOGRAPHY DEVICES MARKET, BY PRODUCT TYPE 2019-2028 (USD MILLION)
TABLE 187 MEXICO PRODUCT TYPE IN TRAUMA & SURGERY IN ELECTROENCEPHALOGRAPHY DEVICES MARKET, BY APPLICATION, 2019-2028 (USD MILLION)
TABLE 188 MEXICO ELECTROENCEPHALOGRAPHY DEVICES MARKET, BY END USER, 2019-2028 (USD MILLION)
TABLE 189 MEXICO ELECTROENCEPHALOGRAPHY DEVICES MARKET, BY DISTRIBUTION CHANNEL, 2019-2028 (USD MILLION)
List of Figure
FIGURE 1 NORTH AMERICA ELECTROENCEPHALOGRAPHY DEVICES MARKET: SEGMENTATION
FIGURE 2 NORTH AMERICA ELECTROENCEPHALOGRAPHY DEVICES MARKET: DATA TRIANGULATION
FIGURE 3 NORTH AMERICA ELECTROENCEPHALOGRAPHY DEVICES MARKET: DROC ANALYSIS
FIGURE 4 NORTH AMERICA ELECTROENCEPHALOGRAPHY DEVICES MARKET: NORTH AMERICA VS REGIONAL MARKET ANALYSIS
FIGURE 5 NORTH AMERICA ELECTROENCEPHALOGRAPHY DEVICES MARKET: COMPANY RESEARCH ANALYSIS
FIGURE 6 NORTH AMERICA ELECTROENCEPHALOGRAPHY DEVICES MARKET: INTERVIEW DEMOGRAPHICS
FIGURE 7 NORTH AMERICA ELECTROENCEPHALOGRAPHY DEVICES MARKET: DBMR MARKET POSITION GRID
FIGURE 8 NORTH AMERICA ELECTROENCEPHALOGRAPHY DEVICES MARKET: MARKET APPLICATION COVERAGE GRID
FIGURE 9 NORTH AMERICA ELECTROENCEPHALOGRAPHY DEVICES MARKET: VENDOR SHARE ANALYSIS
FIGURE 10 NORTH AMERICA ELECTROENCEPHALOGRAPHY DEVICES MARKET: SEGMENTATION
FIGURE 11 INCREASING PREVALENCE OF NEUROLOGICAL DISORDERS IS EXPECTED TO DRIVE THE NORTH AMERICA ELECTROENCEPHALOGRAPHY DEVICES MARKET IN THE FORECAST PERIOD OF 2021 TO 2028
FIGURE 12 DEVICES SEGMENT IS EXPECTED TO ACCOUNT FOR THE LARGEST SHARE OF THE NORTH AMERICA ELECTROENCEPHALOGRAPHY DEVICES MARKET IN 2021 & 2028
FIGURE 13 DRIVERS, RESTRAINTS, OPPORTUNITIES AND CHALLENGES OF NORTH AMERICA ELECTROENCEPHALOGRAPHY DEVICES MARKET
FIGURE 14 NATIONAL HEALTHCARE EXPENDITURE, U.S. (2019)
FIGURE 15 NORTH AMERICA ELECTROENCEPHALOGRAPHY DEVICES MARKET: BY PRODUCT TYPE, 2020
FIGURE 16 NORTH AMERICA ELECTROENCEPHALOGRAPHY DEVICES MARKET: BY PRODUCT TYPE, 2021-2028 (USD MILLION)
FIGURE 17 NORTH AMERICA ELECTROENCEPHALOGRAPHY DEVICES MARKET: BY PRODUCT TYPE, CAGR (2021-2028)
FIGURE 18 NORTH AMERICA ELECTROENCEPHALOGRAPHY DEVICES MARKET: BY PRODUCT TYPE, LIFELINE CURVE
FIGURE 19 NORTH AMERICA ELECTROENCEPHALOGRAPHY DEVICES MARKET: BY TYPE, 2020
FIGURE 20 NORTH AMERICA ELECTROENCEPHALOGRAPHY DEVICES MARKET: BY TYPE, 2021-2028 (USD MILLION)
FIGURE 21 NORTH AMERICA ELECTROENCEPHALOGRAPHY DEVICES MARKET: BY TYPE, CAGR (2021-2028)
FIGURE 22 NORTH AMERICA ELECTROENCEPHALOGRAPHY DEVICES MARKET: BY TYPE, LIFELINE CURVE
FIGURE 23 NORTH AMERICA ELECTROENCEPHALOGRAPHY DEVICES MARKET: BY USABILITY, 2020
FIGURE 24 NORTH AMERICA ELECTROENCEPHALOGRAPHY DEVICES MARKET: BY USABILITY, 2021-2028 (USD MILLION)
FIGURE 25 NORTH AMERICA ELECTROENCEPHALOGRAPHY DEVICES MARKET: BY USABILITY, CAGR (2021-2028)
FIGURE 26 NORTH AMERICA ELECTROENCEPHALOGRAPHY DEVICES MARKET: BY USABILITY, LIFELINE CURVE
FIGURE 27 NORTH AMERICA ELECTROENCEPHALOGRAPHY DEVICES MARKET: BY PROCEDURE, 2020
FIGURE 28 NORTH AMERICA ELECTROENCEPHALOGRAPHY DEVICES MARKET: BY PROCEDURE, 2021-2028 (USD MILLION)
FIGURE 29 NORTH AMERICA ELECTROENCEPHALOGRAPHY DEVICES MARKET: BY PROCEDURE, CAGR (2021-2028)
FIGURE 30 NORTH AMERICA ELECTROENCEPHALOGRAPHY DEVICES MARKET: BY PROCEDURE, LIFELINE CURVE
FIGURE 31 NORTH AMERICA ELECTROENCEPHALOGRAPHY DEVICES MARKET: BY FUNCTION, 2020
FIGURE 32 NORTH AMERICA ELECTROENCEPHALOGRAPHY DEVICES MARKET: BY FUNCTION, 2020-2028 (USD MILLION)
FIGURE 33 NORTH AMERICA ELECTROENCEPHALOGRAPHY DEVICES MARKET: BY FUNCTION, CAGR (2020-2028)
FIGURE 34 NORTH AMERICA ELECTROENCEPHALOGRAPHY DEVICES MARKET: BY FUNCTION, LIFELINE CURVE
FIGURE 35 NORTH AMERICA ELECTROENCEPHALOGRAPHY DEVICES MARKET: BY SIGNAL FREQUENCY, 2020
FIGURE 36 NORTH AMERICA ELECTROENCEPHALOGRAPHY DEVICES MARKET: BY SIGNAL FREQUENCY, 2020-2028 (USD MILLION)
FIGURE 37 NORTH AMERICA ELECTROENCEPHALOGRAPHY DEVICES MARKET: BY SIGNAL FREQUENCY, CAGR (2020-2028)
FIGURE 38 NORTH AMERICA ELECTROENCEPHALOGRAPHY DEVICES MARKET: BY SIGNAL FREQUENCY, LIFELINE CURVE
FIGURE 39 NORTH AMERICA ELECTROENCEPHALOGRAPHY DEVICES MARKET: BY FILTERING SETTINGS, 2020
FIGURE 40 NORTH AMERICA ELECTROENCEPHALOGRAPHY DEVICES MARKET: BY FILTERING SETTINGS, 2020-2028 (USD MILLION)
FIGURE 41 NORTH AMERICA ELECTROENCEPHALOGRAPHY DEVICES MARKET: BY FILTERING SETTINGS, CAGR (2020-2028)
FIGURE 42 NORTH AMERICA ELECTROENCEPHALOGRAPHY DEVICES MARKET: BY FILTERING SETTINGS, LIFELINE CURVE
FIGURE 43 NORTH AMERICA ELECTROENCEPHALOGRAPHY DEVICES MARKET: BY AGE GROUP, 2020
FIGURE 44 NORTH AMERICA ELECTROENCEPHALOGRAPHY DEVICES MARKET: BY AGE GROUP, 2021-2028 (USD MILLION)
FIGURE 45 NORTH AMERICA ELECTROENCEPHALOGRAPHY DEVICES MARKET: BY AGE GROUP, CAGR (2021-2028)
FIGURE 46 NORTH AMERICA ELECTROENCEPHALOGRAPHY DEVICES MARKET: BY AGE GROUP, LIFELINE CURVE
FIGURE 47 NORTH AMERICA ELECTROENCEPHALOGRAPHY DEVICES MARKET: BY APPLICATION, 2020
FIGURE 48 NORTH AMERICA ELECTROENCEPHALOGRAPHY DEVICES MARKET: BY APPLICATION, 2020-2028 (USD MILLION)
FIGURE 49 NORTH AMERICA ELECTROENCEPHALOGRAPHY DEVICES MARKET: BY APPLICATION, CAGR (2020-2028)
FIGURE 50 NORTH AMERICA ELECTROENCEPHALOGRAPHY DEVICES MARKET: BY APPLICATION, LIFELINE CURVE
FIGURE 51 NORTH AMERICA ELECTROENCEPHALOGRAPHY DEVICES MARKET: BY END USER, 2020
FIGURE 52 NORTH AMERICA ELECTROENCEPHALOGRAPHY DEVICES MARKET: BY END USER, 2021-2028 (USD MILLION)
FIGURE 53 NORTH AMERICA ELECTROENCEPHALOGRAPHY DEVICES MARKET: BY END USER, CAGR (2021-2028)
FIGURE 54 NORTH AMERICA ELECTROENCEPHALOGRAPHY DEVICES MARKET: BY END USER, LIFELINE CURVE
FIGURE 55 NORTH AMERICA ELECTROENCEPHALOGRAPHY DEVICES MARKET: BY DISTRIBUTION CHANNEL, 2020
FIGURE 56 NORTH AMERICA ELECTROENCEPHALOGRAPHY DEVICES MARKET: BY DISTRIBUTION CHANNEL, 2021-2028 (USD MILLION)
FIGURE 57 NORTH AMERICA ELECTROENCEPHALOGRAPHY DEVICES MARKET: BY DISTRIBUTION CHANNEL, CAGR (2021-2028)
FIGURE 58 NORTH AMERICA ELECTROENCEPHALOGRAPHY DEVICES MARKET: BY DISTRIBUTION CHANNEL, LIFELINE CURVE
FIGURE 59 NORTH AMERICA ELECTROENCEPHALOGRAPHY DEVICES MARKET: SNAPSHOT (2020)
FIGURE 60 NORTH AMERICA ELECTROENCEPHALOGRAPHY DEVICES MARKET: BY COUNTRY (2020)
FIGURE 61 NORTH AMERICA ELECTROENCEPHALOGRAPHY DEVICES MARKET: BY COUNTRY (2020 & 2028)
FIGURE 62 NORTH AMERICA ELECTROENCEPHALOGRAPHY DEVICES MARKET: BY COUNTRY (2020 & 2028)
FIGURE 63 NORTH AMERICA ELECTROENCEPHALOGRAPHY DEVICES MARKET: BY TYPE (2020-2028)
FIGURE 64 NORTH AMERICA ELECTROENCEPHALOGRAPHY DEVICES MARKET: COMPANY SHARE 2020 (%)
Data collection and base year analysis are done using data collection modules with large sample sizes. The stage includes obtaining market information or related data through various sources and strategies. It includes examining and planning all the data acquired from the past in advance. It likewise envelops the examination of information inconsistencies seen across different information sources. The market data is analysed and estimated using market statistical and coherent models. Also, market share analysis and key trend analysis are the major success factors in the market report. To know more, please request an analyst call or drop down your inquiry.
The key research methodology used by DBMR research team is data triangulation which involves data mining, analysis of the impact of data variables on the market and primary (industry expert) validation. Data models include Vendor Positioning Grid, Market Time Line Analysis, Market Overview and Guide, Company Positioning Grid, Patent Analysis, Pricing Analysis, Company Market Share Analysis, Standards of Measurement, Global versus Regional and Vendor Share Analysis. To know more about the research methodology, drop in an inquiry to speak to our industry experts.
Data Bridge Market Research is a leader in advanced formative research. We take pride in servicing our existing and new customers with data and analysis that match and suits their goal. The report can be customized to include price trend analysis of target brands understanding the market for additional countries (ask for the list of countries), clinical trial results data, literature review, refurbished market and product base analysis. Market analysis of target competitors can be analyzed from technology-based analysis to market portfolio strategies. We can add as many competitors that you require data about in the format and data style you are looking for. Our team of analysts can also provide you data in crude raw excel files pivot tables (Fact book) or can assist you in creating presentations from the data sets available in the report.


