
North America Flame Retardant For Electronic Electrical And Appliances Market
Market Size in Thousand
 3,657,521.84 Thousand
854,440.69 Thousand
2024
2032
3,657,521.84 Thousand
854,440.69 Thousand
2024
2032
| 2025 - 2032 | |
| USD 3,657,521.84 Thousand | |
| USD 854,440.69 Thousand | |
| % | |
|
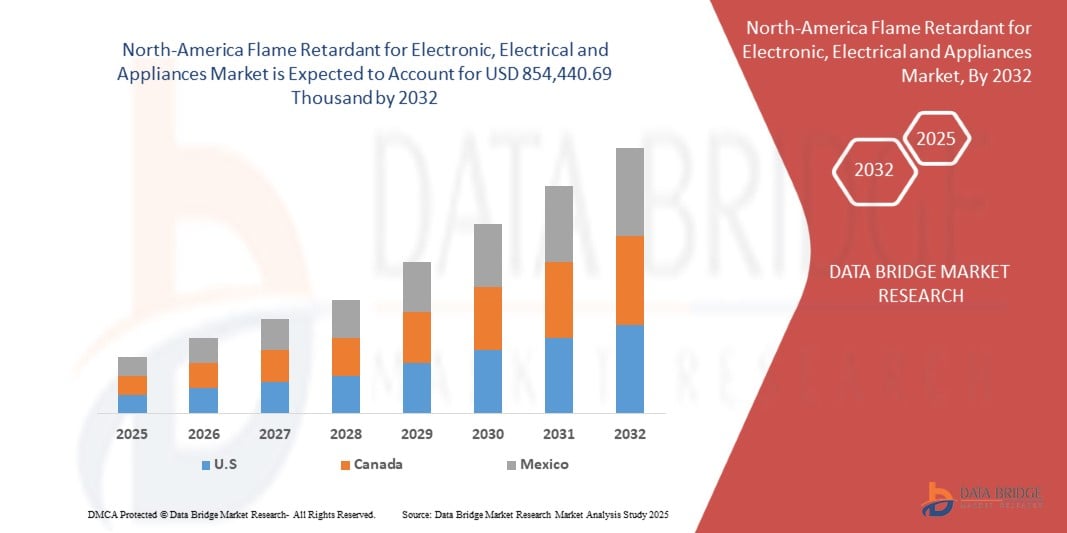
North-America Flame Retardant for Electronic, Electrical and Appliances Market Size
- The North-America Flame retardant for electronic, electrical and appliances market size was valued at USD 3657,521.84 thousand in 2024 and is expected to reach USD 854,440.69 thousand by 2032, at a CAGR of 3.40% during the forecast period
- This growth is driven by factors such as the Increasing demand for consumer electronics and rising use in industrial and commercial applications
North-America Flame Retardant for Electronic, Electrical and Appliances Market Analysis
- Flame retardant for electronic, electrical and appliancess are used to reduce or prevent fire risks in electronic, electrical and appliances components. These substances are essential for improving fire safety in products such as circuit boards, cables, connectors, and appliance housings
- The demand for these microscopes is significantly driven by rising use in industrial and commercial applications and expansion of electrical infrastructure
- U.S. is expected to dominate the Flame retardant for electronic, electrical and appliancess market due to a strong technological base, with continuous innovations in electronics and electrical appliances. The country has stringent fire safety standards and regulations, which require the use of flame retardants in various applications, including electronics and electrical products
- U.S. is expected to be the fastest growing country in the Flame retardant for electronic, electrical and appliances market during the forecast period due to increasing demand for consumer electronics, smart home devices, and electric appliances
- Non-halogenated segment is expected to dominate the market with a market share of 61.14% due to increasing environmental concerns, stricter regulations regarding the use of halogenated chemicals, and growing demand for safer, more sustainable alternatives
Report Scope and Flame retardant for electronic, electrical and appliances Market Segmentation
|
Attributes |
Flame retardant for electronic, electrical and appliances Key Market Insights |
|
Segments Covered |
|
|
Countries Covered |
North America
|
|
Key Market Players |
|
|
Market Opportunities |
|
|
Value Added Data Infosets |
In addition to the insights on market scenarios such as market value, growth rate, segmentation, geographical coverage, and major players, the market reports curated by the Data Bridge Market Research also include import export analysis, production capacity overview, production consumption analysis, price trend analysis, climate change scenario, supply chain analysis, value chain analysis, raw material/consumables overview, vendor selection criteria, PESTLE Analysis, Porter Analysis, and regulatory framework. |
North-America Flame Retardant for Electronic, Electrical and Appliances Market Trends
“Advancements in Operating Microscopes & 3D Visualization for Intraocular Surgery”
- One prominent trend in the evolution of operating microscopes and 3D visualization systems for intraocular surgery is the increasing integration of advanced optics and digital enhancements
- These innovations enhance surgical precision by offering high-definition, real-time visualization of intraocular structures, improving accuracy in delicate procedures.
- For instance, modern 3D visualization systems provide superior depth perception, enabling surgeons to navigate complex intraocular anatomy with greater clarity, which is particularly beneficial for vitreoretinal surgeries and minimally invasive glaucoma procedures.
- These advancements are transforming intraocular surgery, improving patient outcomes, and driving the demand for next-generation surgical microscopes with cutting-edge visualization capabilities
North-America Flame Retardant for Electronic, Electrical and Appliances Market Dynamics
Driver
“Increasing demand for consumer electronics”
- Demand for electronic devices such as smartphones, tablets, laptops, televisions, and smart home appliances has surged dramatically
- These devices require a complex assembly of components, Printed Circuit Boards (PCBs), connectors, casings, and wires, all of which must comply with stringent fire safety standards to prevent electrical fires and enhance end-user safety
- In emerging markets such as U.S. and Canada, rising disposable incomes and increasing internet penetration are driving higher adoption rates of personal electronics
For instance,
- In July 2023, as per the Department of Ecology, manufacturers added flame retardants to the plastic casings of electronic devices, such as televisions and computers, to meet flammability standards and reduce fire risks. This practice helps prevent the spread of flames in case of internal malfunctions
- The booming consumer electronics industry significantly accelerates demand for flame retardants worldwide. As devices become more integrated, compact, and widespread, the need for advanced, safe, and sustainable fire-resistant materials will only grow—positioning the flame retardant market as a vital enabler of safety and innovation in electronics
Opportunity
“Technological innovation in data centers and 5g infrastructure”
- The rollout of 5G technology and the expansion of data centers are driving the demand for high-performance, flame-retardant materials in the Electrical and Electronics (E&E) sector
- The growing number of data centers, which house high-capacity servers and electrical equipment, amplifies the need for flame-retardant materials.
- With the increased density of components in modern data centers, the risk of electrical fires rises, making flame-retardant cables and circuit boards essential for fire safety and regulatory compliance
For instance,
- In August 2024, the International Telecommunication Union (ITU) emphasized the need for flame-retardant materials in the construction of 5G base stations and equipment. As 5G technology requires denser infrastructure with more powerful electrical components, the use of flame-retardant cables and circuit boards becomes critical to prevent fire hazards in high-density environments. This push for safety standards is driving increased demand for flame-retardant materials in 5G infrastructure
- To meet the demands of both 5G networks and data centers, manufacturers are turning to advanced flame-retardant materials, including halogen-free and low-toxicity solutions. These innovations enhance fire safety while minimizing environmental impact. As both 5G and data center infrastructure continue to grow, the demand for flame-retardant components will increase, presenting significant opportunities for the flame-retardant market.
Restraint/Challenge
“Recycling challenges due to contamination and processing limitations”
- The increasing use of flame-retardant materials in various industries has led to significant challenges in recycling these materials, particularly due to contamination and limitations in processing capabilities
- Flame-retardant chemicals, such as brominated and chlorinated compounds, are often added to plastics, textiles, and electronic components to reduce flammability. However, these substances complicate the recycling process due to their chemical properties
- The presence of flame retardants can contaminate recycled materials, making them unsuitable for reuse in new products. The recycling process typically involves shredding, melting, and remolding materials, but when flame-retardant chemicals are present, they can release toxic fumes or cause undesirable chemical reactions during these stages, leading to unsafe materials for consumer products
For instance,
- In May 2024, a report by the Swedish Environmental Protection Agency addressed the growing concern over the presence of flame-retardant chemicals in textiles and plastic products. The agency highlighted that the use of these chemicals in consumer goods has created barriers to the recycling of post-consumer waste, particularly in clothing and plastic packaging. The challenge is particularly pronounced in the textile industry, where recycling rates are low, and the presence of flame retardants further complicates the process
- Consequently, To ensure sustainability, innovations in safer, recyclable flame retardants and improved recycling technologies are essential for mitigating environmental and health risks
North-America Flame Retardant for Electronic, Electrical and Appliances Market Scope
The market is segmented on the basis application, product type, technology, magnification type, end user, and distribution channel.
|
Segmentation |
Sub-Segmentation |
|
By Type |
|
|
By Plastic |
|
|
By End Use |
|
In 2025, the non-halogenated is projected to dominate the market with a largest share in type segment
The non-halogenated segment is expected to dominate the Flame retardant for electronic, electrical and appliances market with the largest share of 61.14% in 2025 due to its excellent thermal stability, high impact resistance, and optical clarity, making it an ideal choice for electronic, electrical and appliances applications.
The PC is expected to account for the largest share during the forecast period in plastic segment
In 2025, the PC segment is expected to dominate the market with the largest market share of 36.92% due to its excellent thermal stability, high impact resistance, and optical clarity, making it an ideal choice for electronic, electrical and appliances applications.
North-America Flame Retardant for Electronic, Electrical and Appliances Market Regional Analysis
“U.S. Holds the Largest Share in the Flame retardant for electronic, electrical and appliances Market”
- U.S. dominates the Flame retardant for electronic, electrical and appliances market, driven by rapid industrialization, a high concentration of electronics and electrical manufacturing, and strong demand for consumer electronics
- The U.S. holds a significant share due to robust electronics and appliance manufacturing base, favorable government policies, and increasing domestic consumption.
- The country benefits from well-established supply chains, availability of raw materials, and the presence of leading North-America manufacturers
- In addition, the Increasing awareness regarding fire safety regulations and the need for flame retardant materials in household and industrial electronic products further fuels market expansion
“U.S. is Projected to Register the Highest CAGR in the Flame retardant for electronic, electrical and appliances Market”
- The U.S. country is expected to witness the highest growth rate in the Flame retardant for electronic, electrical and appliances market, driven by continuous growth in consumer electronics, increasing adoption of electric and smart appliances, and rising urbanization
- U.S. has been attracting substantial FDI in electronics and electrical manufacturing, with investments focused on expanding production capacity and advancing technological innovation, which in turn drives the demand for flame retardants.
- Increasing awareness about fire safety regulations and the need for fire-resistant materials in household and industrial electronics further boosts market demand
North-America Flame Retardant for Electronic, Electrical and Appliances Market Share
The market competitive landscape provides details by competitor. Details included are company overview, company financials, revenue generated, market potential, investment in research and development, new market initiatives, North-America presence, production sites and facilities, production capacities, company strengths and weaknesses, product launch, product width and breadth, application dominance. The above data points provided are only related to the companies' focus related to market.
The Major Market Leaders Operating in the Market Are:
- BASF (Germany)
- Clariant (Germany)
- DIC CORPORATION (Japan)
- LANXESS (Germany)
- Plastibends (India)
- Albemarle Corporation (U.S.)
- Ampacet Corporation (U.S.)
- Cromex S/A (Brazil)
- Dover Chemical Corporation (U.S.)
- Nouryo (Netherlands)
- Gabriel-Chemie GmbH (Austria)
- Weifang Mingrun Chemical Co., Ltd. (China)
- Americhem (U.S.)
- Dongguan Jiefu Flame Retardant Material Co., Ltd. (China)
- Kandui Industries Private Limited (India)
Latest Developments in North-America Flame Retardant for Electronic, Electrical and Appliances Market
- In January 2025, BASF's advanced flame-retardant grade of Ultramid T6000 polyphthalamide (PPA) was adopted for terminal block applications, replacing non-FR materials to improve safety in inverter and motor systems of Electric Vehicles (EVs). It supports electrical safety enhancement in electric vehicles, making it a functional upgrade with direct implications for thermal protection, reliability, and compliance in automotive electrical systems.
- In July 2022, BASF and THOR GmbH combined their expertise in non-halogenated flame retardant additives to offer a comprehensive solution that improved sustainability and performance in select plastic compounds while meeting strict fire safety standards.
- In May 2022, BASF expanded its Polyphthalamide (PPA) portfolio with various flame-retardant grades offering high thermal stability, excellent electrical insulation, and low water uptake. These halogen-free materials featured RTI values above 140°C, improved color stability, and enabled safer, more reliable applications across e-mobility, electronics, appliances, and power connectors.
- In October 2023, Clariant inaugurated a new USD 66.78 million Exolit OP flame retardant plant in Daya Bay, China. Aimed at meeting Asia’s demand for sustainable fire protection, the facility enhances local supply capabilities. A second production line is under construction, set to launch in 2024
- In September 2022, Gabriel-Chemie introduced a new series of halogen-free flame retardant masterbatches for the electrical conduits and tubes market, emphasizing the company's commitment to sustainability. These masterbatches comply with flame retardant standard EN 61386, halogen-free standard EN 50642, and low smoke standard IEC 61304-2. Benefits include reduced toxic gas emissions during fires, enhanced recyclability, and minimized corrosion of electronic equipment and machinery
SKU-

- Interactive Data Analysis Dashboard
- Company Analysis Dashboard for high growth potential opportunities
- Research Analyst Access for customization & queries
- Competitor Analysis with Interactive dashboard
- Latest News, Updates & Trend analysis
- Harness the Power of Benchmark Analysis for Comprehensive Competitor Tracking
Table of Content
1 INTRODUCTION
1.1 OBJECTIVES OF THE STUDY
1.2 MARKET DEFINITION
1.3 OVERVIEW
1.4 LIMITATIONS
1.5 MARKETS COVERED
2 MARKET SEGMENTATION
2.1 MARKETS COVERED
2.2 GEOGRAPHICAL SCOPE
2.3 YEARS CONSIDERED FOR THE STUDY
2.4 CURRENCY AND PRICING
2.5 DBMR TRIPOD DATA VALIDATION MODEL
2.6 MULTIVARIATE MODELING
2.7 PRIMARY INTERVIEWS WITH KEY OPINION LEADERS
2.8 DBMR MARKET POSITION GRID
2.9 DBMR VENDOR SHARE ANALYSIS
2.1 MARKET END USE COVERAGE GRID
2.11 SECONDARY SOURCES
2.12 ASSUMPTIONS
3 EXECUTIVE SUMMARY
4 PREMIUM INSIGHTS
4.1 PESTEL ANALYSIS
4.1.1 POLITICAL FACTORS
4.1.2 ECONOMIC FACTORS
4.1.3 SOCIAL FACTORS
4.1.4 TECHNOLOGICAL FACTORS
4.1.5 ENVIRONMENTAL FACTORS
4.1.6 LEGAL FACTORS
4.2 PORTER’S FIVE FORCES
4.2.1 THREAT OF NEW ENTRANTS
4.2.2 BARGAINING POWER OF BUYERS
4.2.3 BARGAINING POWER OF SUPPLIERS
4.2.4 THREAT OF SUBSTITUTES
4.2.5 COMPETITIVE RIVALRY
4.3 IMPORT EXPORT SCENARIO
4.4 PRICING ANALYSIS
4.4.1 OVERVIEW OF FLAME RETARDANT FOR ELECTRONIC, ELECTRICAL AND APPLIANCES PRICES
4.4.2 FACTORS INFLUENCING PRICING TRENDS
4.4.3 PRICE VOLATILITY AND MARKET OUTLOOK
4.4.4 CONCLUSION
4.5 PRODUCTION CONSUMPTION ANALYSIS
4.6 VENDOR SELECTION CRITERIA
4.7 CLIMATE CHANGE SCENARIO
4.7.1 ENVIRONMENTAL CONCERNS
4.7.2 INDUSTRY RESPONSE
4.7.3 GOVERNMENT’S ROLE
4.7.4 ANALYST RECOMMENDATIONS
4.8 RAW MATERIAL COVERAGE
4.8.1 SUPPLY CHAIN CONSIDERATIONS:
4.8.2 ENVIRONMENTAL AND REGULATORY TRENDS:
4.8.3 CONCLUSION:
4.9 SUPPLY CHAIN ANALYSIS
4.9.1 OVERVIEW
4.9.2 LOGISTIC COST SCENARIO
4.9.3 IMPORTANCE OF LOGISTICS SERVICE PROVIDERS
4.1 TARIFFS AND THEIR IMPACT ON MARKET
4.10.1 CURRENT TARIFF RATES IN TOP-5 COUNTRY MARKETS
4.10.2 OUTLOOK: LOCAL PRODUCTION VS IMPORT RELIANCE
4.10.3 VENDOR SELECTION CRITERIA DYNAMICS
4.10.4 IMPACT ON SUPPLY CHAIN
4.10.4.1 RAW MATERIAL PROCUREMENT
4.10.4.2 MANUFACTURING AND PRODUCTION
4.10.4.3 LOGISTICS AND DISTRIBUTION
4.10.4.4 PRICE PITCHING AND POSITION OF MARKET
4.10.5 INDUSTRY PARTICIPANTS: PROACTIVE MOVES
4.10.5.1 SUPPLY CHAIN OPTIMIZATION
4.10.5.2 JOINT VENTURE ESTABLISHMENTS
4.10.6 IMPACT ON PRICES
4.10.7 REGULATORY INCLINATION
4.10.7.1 GEOPOLITICAL SITUATION
4.10.7.2 TRADE PARTNERSHIPS BETWEEN COUNTRIES
4.10.7.2.1 FREE TRADE AGREEMENTS
4.10.7.2.2 ALLIANCE ESTABLISHMENTS
4.10.7.3 STATUS ACCREDITATION (INCLUDING MFN)
4.10.7.4 DOMESTIC COURSE OF CORRECTION
4.10.7.4.1 INCENTIVE SCHEMES TO BOOST PRODUCTION OUTPUTS
4.10.7.4.2 ESTABLISHMENT OF SPECIAL ECONOMIC ZONES / INDUSTRIAL PARKS
4.11 TECHNOLOGICAL ADVANCEMENTS BY MANUFACTURERS
4.11.1 DEVELOPMENT OF HALOGEN-FREE FLAME RETARDANTS
4.11.2 ECO-FRIENDLY AND SUSTAINABLE FORMULATIONS
4.11.3 NANO-TECHNOLOGY INTEGRATION
4.11.4 SYNERGISTIC ADDITIVE SYSTEMS
4.11.5 SMART AND REACTIVE FLAME RETARDANTS
4.12 WASTE ELECTRICAL AND ELECTRONIC EQUIPMENT (WEEE) REGULATIONS
4.12.1 RESTRICTION OF HAZARDOUS FLAME RETARDANTS
4.12.2 DESIGN FOR RECYCLING AND ECO-FRIENDLY MATERIALS
4.12.3 EXTENDED PRODUCER RESPONSIBILITY (EPR)
4.12.4 TRANSPARENCY AND MATERIAL DOCUMENTATION
4.12.5 CONCLUSION
4.13 FLAME RETARDANT DATA TABLE
4.14 REQUIREMENT
4.15 DATA SOURCING ANALYSIS
4.15.1 PRIMARY SOURCING
4.15.2 SECONDARY SOURCING
4.15.2.1 CHEMICAL INDUSTRIES
4.15.2.2 SCIENTIFIC RESEARCH
4.15.2.3 ARTICLES & LITERATURE REVIEW
4.15.2.4 AMONG OTHERS
5 REGULATORY COVERAGE
6 MARKET OVERVIEW
6.1 DRIVERS
6.1.1 INCREASING DEMAND FOR CONSUMER ELECTRONICS
6.1.2 EXPANSION OF ELECTRICAL INFRASTRUCTURE
6.1.3 RISING USE IN INDUSTRIAL AND COMMERCIAL APPLICATIONS
6.2 RESTRAINTS
6.2.1 COMPLEXITY OF MANUFACTURING PROCESS
6.2.2 DEPENDENCY ON RAW MATERIALS FROM SPECIFIC REGIONS
6.3 OPPORTUNITIES
6.3.1 TECHNOLOGICAL INNOVATION IN DATA CENTERS AND 5G INFRASTRUCTURE
6.3.2 ADVANCEMENTS IN ECO-FRIENDLY FLAME RETARDANTS
6.4 CHALLENGES
6.4.1 RECYCLING CHALLENGES DUE TO CONTAMINATION AND PROCESSING LIMITATIONS
6.4.2 HEALTH HAZARDS AND ENVIRONMENTAL TOXICITY
7 NORTH AMERICA FLAME RETARDANT FOR ELECTRONIC, ELECTRICAL AND APPLIANCES MARKET, BY TYPE
7.1 OVERVIEW
7.2 NON-HALOGENATED
7.3 HALOGENATED
8 NORTH AMERICA FLAME RETARDANT FOR ELECTRONIC, ELECTRICAL AND APPLIANCES MARKET, BY PLASTIC
8.1 OVERVIEW
8.2 PC
8.3 ABS
8.4 PP
8.5 PE
8.6 PS
8.7 OTHERS
9 NORTH AMERICA FLAME RETARDANT FOR ELECTRONIC, ELECTRICAL AND APPLIANCES MARKET, BY END USE
9.1 OVERVIEW
9.2 ELECTRICAL AND ELECTRONICS
9.3 HOUSEHOLD APPLIANCES
9.4 PROFESSIONAL APPLIANCES
10 NORTH AMERICA FLAME RETARDANT FOR ELECTRONIC, ELECTRICAL AND APPLIANCES MARKET, BY REGION
10.1 NORTH AMERICA
10.1.1 U.S.
10.1.2 CANADA
10.1.3 MEXICO
11 NORTH AMERICA FLAME RETARDANT FOR ELECTRONIC, ELECTRICAL AND APPLIANCES MARKET: COMPANY LANDSCAPE
11.1 COMPANY SHARE ANALYSIS: NORTH AMERICA
12 SWOT ANALYSIS
13 COMPANY PROFILES
13.1 ALBEMARLE CORPORATION
13.1.1 COMPANY SNAPSHOT
13.1.2 REVENUE ANALYSIS
13.1.3 COMPANY SHARE ANALYSIS
13.1.4 PRODUCT PORTFOLIO
13.1.5 RECENT DEVELOPMENT
13.2 BASF
13.2.1 COMPANY SNAPSHOT
13.2.2 REVENUE ANALYSIS
13.2.3 COMPANY SHARE ANALYSIS
13.2.4 PRODUCT PORTFOLIO
13.2.5 RECENT DEVELOPMENTS
13.3 WEIFANG MINGRUN CHEMICAL CO., LTD.
13.3.1 COMPANY SNAPSHOT
13.3.2 COMPANY SHARE ANALYSIS
13.3.3 PRODUCT PORTFOLIO
13.3.4 RECENT DEVELOPMENT
13.4 DIC CORPORATION
13.4.1 COMPANY SNAPSHOT
13.4.2 RECENT FINANCIALS
13.4.3 COMPANY SHARE ANALYSIS
13.4.4 PRODUCT PORTFOLIO
13.4.5 RECENT DEVELOPMENT
13.5 CLARIANT
13.5.1 COMPANY SNAPSHOT
13.5.2 REVENUE ANALYSIS
13.5.3 COMPANY SHARE ANALYSIS
13.5.4 INDUSTRIES PORTFOLIO
13.5.5 RECENT DEVELOPMENT
13.6 AMERICHEM
13.6.1 COMPANY SNAPSHOT
13.6.2 PRODUCT PORTFOLIO
13.6.3 RECENT DEVELOPMENT
13.7 AMPACET CORPORATION
13.7.1 COMPANY SNAPSHOT
13.7.2 PRODUCT PORTFOLIO
13.7.3 RECENT DEVELOPMENT
13.8 BLENDCOLOURS
13.8.1 COMPANY SNAPSHOT
13.8.2 PRODUCT PORTFOLIO
13.8.3 RECENT DEVELOPMENT
13.9 CROMEX S/A
13.9.1 COMPANY SNAPSHOT
13.9.2 PRODUCT PORTFOLIO
13.9.3 RECENT DEVELOPMENT
13.1 DONGGUAN JIEFU FLAME RETARDANT MATERIAL CO., LTD.
13.10.1 COMPANY SNAPSHOT
13.10.2 PRODUCT PORTFOLIO
13.10.3 RECENT DEVELOPMENT
13.11 DOVER CHEMICAL CORPORATION
13.11.1 COMPANY SNAPSHOT
13.11.2 PRODUCT PORTFOLIO
13.11.3 RECENT DEVELOPMENT
13.12 GABRIEL-CHEMIE GESELLSCHAFT M.B.H.
13.12.1 COMPANY SNAPSHOT
13.12.2 PRODUCT PORTFOLIO
13.12.3 RECENT DEVELOPMENT
13.13 GREEN VIEW TECHNOLOGY AND DEVELOPMENT CO., LTD
13.13.1 COMPANY SNAPSHOT
13.13.2 PRODUCT PORTFOLIO
13.13.3 RECENT DEVELOPMENT
13.14 KANDUI INDUSTRIES PRIVATE LIMITED
13.14.1 COMPANY SNAPSHOT
13.14.2 PRODUCT PORTFOLIO
13.14.3 RECENT DEVELOPMENT
13.15 LANXESS
13.15.1 COMPANY SNAPSHOT
13.15.2 RECENT FINANCIALS
13.15.3 PRODUCT PORTFOLIO
13.15.4 RECENT DEVELOPMENT
13.16 NOURYON
13.16.1 COMPANY SNAPSHOT
13.16.2 PRODUCT PORTFOLIO
13.16.3 RECENT DEVELOPMENT
13.17 PLASTIBLENDS
13.17.1 COMPANY SNAPSHOT
13.17.2 REVENUE ANALYSIS
13.17.3 PRODUCT PORTFOLIO
13.17.4 RECENT DEVELOPMENT
13.18 SHANDONG HAIWANG CHEMICAL CO., LTD
13.18.1 COMPANY SNAPSHOT
13.18.2 PRODUCT PORTFOLIO
13.18.3 RECENT DEVELOPMENT
13.19 TOSAF COMPOUNDS LTD.
13.19.1 COMPANY SNAPSHOT
13.19.2 SOLUTION PORTFOLIO
13.19.3 RECENT DEVELOPMENT
13.2 XINOMER AG
13.20.1 COMPANY SNAPSHOT
13.20.2 PRODUCT PORTFOLIO
13.20.3 RECENT DEVELOPMENT
14 QUESTIONNAIRE
15 RELATED REPORTS
List of Table
TABLE 1 NORTH AMERICA -HALOGENATED
TABLE 2 NORTH AMERICA -NON_HALOGENATED
TABLE 3 EUROPE-HALOGENATED
TABLE 4 EUROPE-NON_HALOGENATED
TABLE 5 FRANCE-HALOGENATED
TABLE 6 FRANCE-NON_HALOGENATED
TABLE 7 REGULATORY COVERAGE
TABLE 8 NORTH AMERICA FLAME RETARDANT FOR ELECTRONIC, ELECTRICAL AND APPLIANCES MARKET, BY TYPE, 2018-2032 (USD THOUSAND)
TABLE 9 NORTH AMERICA FLAME RETARDANT FOR ELECTRONIC, ELECTRICAL AND APPLIANCES MARKET, BY TYPE, 2018-2032 (TONS)
TABLE 10 NORTH AMERICA NON-HALOGENATED IN FLAME RETARDANT FOR ELECTRONIC, ELECTRICAL AND APPLIANCES MARKET, BY REGION, 2018-2032 (USD THOUSAND)
TABLE 11 NORTH AMERICA NON-HALOGENATED IN FLAME RETARDANT FOR ELECTRONIC, ELECTRICAL AND APPLIANCES MARKET, BY REGION, 2018-2032 (TONS)
TABLE 12 NORTH AMERICA NON-HALOGENATED IN FLAME RETARDANT FOR ELECTRONIC, ELECTRICAL AND APPLIANCES MARKET, BY TYPE, 2018-2032 (USD THOUSAND)
TABLE 13 NORTH AMERICA PHOSPHORUS IN FLAME RETARDANT FOR ELECTRONIC, ELECTRICAL AND APPLIANCES MARKET, BY TYPE, 2018-2032 (USD THOUSAND)
TABLE 14 NORTH AMERICA CHLOROPHOSPHATE IN FLAME RETARDANT FOR ELECTRONIC, ELECTRICAL AND APPLIANCES MARKET, BY TYPE, 2018-2032 (USD THOUSAND)
TABLE 15 NORTH AMERICA HALOGENATED IN FLAME RETARDANT FOR ELECTRONIC, ELECTRICAL AND APPLIANCES MARKET, BY REGION, 2018-2032 (USD THOUSAND)
TABLE 16 NORTH AMERICA HALOGENATED IN FLAME RETARDANT FOR ELECTRONIC, ELECTRICAL AND APPLIANCES MARKET, BY REGION, 2018-2032 (TONS)
TABLE 17 NORTH AMERICA HALOGENATED IN FLAME RETARDANT FOR ELECTRONIC, ELECTRICAL AND APPLIANCES MARKET, BY TYPE, 2018-2032 (USD THOUSAND)
TABLE 18 NORTH AMERICA BROMINATED IN FLAME RETARDANT FOR ELECTRONIC, ELECTRICAL AND APPLIANCES MARKET, BY TYPE, 2018-2032 (USD THOUSAND)
TABLE 19 NORTH AMERICA FLAME RETARDANT FOR ELECTRONIC, ELECTRICAL AND APPLIANCES MARKET, BY PLASTIC, 2018-2032 (USD THOUSAND)
TABLE 20 NORTH AMERICA PC IN FLAME RETARDANT FOR ELECTRONIC, ELECTRICAL AND APPLIANCES MARKET, BY REGION, 2018-2032 (USD THOUSAND)
TABLE 21 NORTH AMERICA ABS IN FLAME RETARDANT FOR ELECTRONIC, ELECTRICAL AND APPLIANCES MARKET, BY REGION, 2018-2032 (USD THOUSAND)
TABLE 22 NORTH AMERICA PP IN FLAME RETARDANT FOR ELECTRONIC, ELECTRICAL AND APPLIANCES MARKET, BY REGION, 2018-2032 (USD THOUSAND)
TABLE 23 NORTH AMERICA PE IN FLAME RETARDANT FOR ELECTRONIC, ELECTRICAL AND APPLIANCES MARKET, BY REGION, 2018-2032 (USD THOUSAND)
TABLE 24 NORTH AMERICA PS IN FLAME RETARDANT FOR ELECTRONIC, ELECTRICAL AND APPLIANCES MARKET, BY REGION, 2018-2032 (USD THOUSAND)
TABLE 25 NORTH AMERICA OTHERS IN FLAME RETARDANT FOR ELECTRONIC, ELECTRICAL AND APPLIANCES MARKET, BY REGION, 2018-2032 (USD THOUSAND)
TABLE 26 NORTH AMERICA FLAME RETARDANT FOR ELECTRONIC, ELECTRICAL AND APPLIANCES MARKET, BY END USE, 2018-2032 (USD THOUSAND)
TABLE 27 NORTH AMERICA ELECTRICAL AND ELECTRONICS IN FLAME RETARDANT FOR ELECTRONIC, ELECTRICAL AND APPLIANCES MARKET, BY REGION, 2018-2032 (USD THOUSAND)
TABLE 28 NORTH AMERICA ELECTRICAL AND ELECTRONICS IN FLAME RETARDANT FOR ELECTRONIC, ELECTRICAL AND APPLIANCES MARKET, BY APPLICATION, 2018-2032 (USD THOUSAND)
TABLE 29 NORTH AMERICA ELECTRICAL CABLES IN FLAME RETARDANT FOR ELECTRONIC, ELECTRICAL AND APPLIANCES MARKET, BY TYPE, 2018-2032 (USD THOUSAND)
TABLE 30 NORTH AMERICA ELECTRICAL FACILITIES IN FLAME RETARDANT FOR ELECTRONIC, ELECTRICAL AND APPLIANCES MARKET, BY TYPE, 2018-2032 (USD THOUSAND)
TABLE 31 NORTH AMERICA ELECTRICAL AND ELECTRONICS IN FLAME RETARDANT FOR ELECTRONIC, ELECTRICAL AND APPLIANCES MARKET, BY TYPE, 2018-2032 (USD THOUSAND)
TABLE 32 NORTH AMERICA HOUSEHOLD APPLIANCES IN FLAME RETARDANT FOR ELECTRONIC, ELECTRICAL AND APPLIANCES MARKET, BY REGION, 2018-2032 (USD THOUSAND)
TABLE 33 NORTH AMERICA HOUSEHOLD APPLIANCES IN FLAME RETARDANT FOR ELECTRONIC, ELECTRICAL AND APPLIANCES MARKET, BY APPLICATION, 2018-2032 (USD THOUSAND)
TABLE 34 NORTH AMERICA HOUSEHOLD APPLIANCES IN FLAME RETARDANT FOR ELECTRONIC, ELECTRICAL AND APPLIANCES MARKET, BY TYPE, 2018-2032 (USD THOUSAND)
TABLE 35 NORTH AMERICA PROFESSIONAL APPLIANCES IN FLAME RETARDANT FOR ELECTRONIC, ELECTRICAL AND APPLIANCES MARKET, BY REGION, 2018-2032 (USD THOUSAND)
TABLE 36 NORTH AMERICA PROFESSIONAL APPLIANCES IN FLAME RETARDANT FOR ELECTRONIC, ELECTRICAL AND APPLIANCES MARKET, BY APPLICATION, 2018-2032 (USD THOUSAND)
TABLE 37 NORTH AMERICA PROFESSIONAL APPLIANCES IN FLAME RETARDANT FOR ELECTRONIC, ELECTRICAL AND APPLIANCES MARKET, BY TYPE, 2018-2032 (USD THOUSAND)
TABLE 38 NORTH AMERICA FLAME RETARDANT FOR ELECTRONIC, ELECTRICAL AND APPLIANCES MARKET, BY COUNTRY, 2018-2032 (USD THOUSAND)
TABLE 39 NORTH AMERICA FLAME RETARDANT FOR ELECTRONIC, ELECTRICAL AND APPLIANCES MARKET, BY COUNTRY, 2018-2032 (TONS)
TABLE 40 NORTH AMERICA FLAME RETARDANT FOR ELECTRONIC, ELECTRICAL AND APPLIANCES MARKET, BY TYPE, 2018-2032 (USD THOUSAND)
TABLE 41 NORTH AMERICA FLAME RETARDANT FOR ELECTRONIC, ELECTRICAL AND APPLIANCES MARKET, BY TYPE, 2018-2032 (TONS)
TABLE 42 NORTH AMERICA NON-HALOGENATED IN FLAME RETARDANT FOR ELECTRONIC, ELECTRICAL AND APPLIANCES MARKET, BY TYPE, 2018-2032 (USD THOUSAND)
TABLE 43 NORTH AMERICA PHOSPHORUS IN FLAME RETARDANT FOR ELECTRONIC, ELECTRICAL AND APPLIANCES MARKET, BY TYPE, 2018-2032 (USD THOUSAND)
TABLE 44 NORTH AMERICA CHLOROPHOSPHATE IN FLAME RETARDANT FOR ELECTRONIC, ELECTRICAL AND APPLIANCES MARKET, BY TYPE, 2018-2032 (USD THOUSAND)
TABLE 45 NORTH AMERICA HALOGENATED IN FLAME RETARDANT FOR ELECTRONIC, ELECTRICAL AND APPLIANCES MARKET, BY TYPE, 2018-2032 (USD THOUSAND)
TABLE 46 NORTH AMERICA BROMINATED IN FLAME RETARDANT FOR ELECTRONIC, ELECTRICAL AND APPLIANCES MARKET, BY TYPE, 2018-2032 (USD THOUSAND)
TABLE 47 NORTH AMERICA FLAME RETARDANT FOR ELECTRONIC, ELECTRICAL AND APPLIANCES MARKET, BY PLASTIC, 2018-2032 (USD THOUSAND)
TABLE 48 NORTH AMERICA FLAME RETARDANT FOR ELECTRONIC, ELECTRICAL AND APPLIANCES MARKET, BY END USE, 2018-2032 (USD THOUSAND)
TABLE 49 NORTH AMERICA ELECTRICAL AND ELECTRONICS IN FLAME RETARDANT FOR ELECTRONIC, ELECTRICAL AND APPLIANCES MARKET, BY APPLICATION, 2018-2032 (USD THOUSAND)
TABLE 50 NORTH AMERICA ELECTRICAL CABLES IN FLAME RETARDANT FOR ELECTRONIC, ELECTRICAL AND APPLIANCES MARKET, BY TYPE, 2018-2032 (USD THOUSAND)
TABLE 51 NORTH AMERICA ELECTRICAL FACILITIES IN FLAME RETARDANT FOR ELECTRONIC, ELECTRICAL AND APPLIANCES MARKET, BY TYPE, 2018-2032 (USD THOUSAND)
TABLE 52 NORTH AMERICA ELECTRICAL AND ELECTRONICS IN FLAME RETARDANT FOR ELECTRONIC, ELECTRICAL AND APPLIANCES MARKET, BY TYPE, 2018-2032 (USD THOUSAND)
TABLE 53 NORTH AMERICA HOUSEHOLD APPLIANCES IN FLAME RETARDANT FOR ELECTRONIC, ELECTRICAL AND APPLIANCES MARKET, BY APPLICATION, 2018-2032 (USD THOUSAND)
TABLE 54 NORTH AMERICA HOUSEHOLD APPLIANCES IN FLAME RETARDANT FOR ELECTRONIC, ELECTRICAL AND APPLIANCES MARKET, BY TYPE, 2018-2032 (USD THOUSAND)
TABLE 55 NORTH AMERICA PROFESSIONAL APPLIANCES IN FLAME RETARDANT FOR ELECTRONIC, ELECTRICAL AND APPLIANCES MARKET, BY APPLICATION, 2018-2032 (USD THOUSAND)
TABLE 56 NORTH AMERICA PROFESSIONAL APPLIANCES IN FLAME RETARDANT FOR ELECTRONIC, ELECTRICAL AND APPLIANCES MARKET, BY TYPE, 2018-2032 (USD THOUSAND)
TABLE 57 U.S. FLAME RETARDANT FOR ELECTRONIC, ELECTRICAL AND APPLIANCES MARKET, BY TYPE, 2018-2032 (USD THOUSAND)
TABLE 58 U.S. FLAME RETARDANT FOR ELECTRONIC, ELECTRICAL AND APPLIANCES MARKET, BY TYPE, 2018-2032 (TONS)
TABLE 59 U.S. NON-HALOGENATED IN FLAME RETARDANT FOR ELECTRONIC, ELECTRICAL AND APPLIANCES MARKET, BY TYPE, 2018-2032 (USD THOUSAND)
TABLE 60 U.S. PHOSPHORUS IN FLAME RETARDANT FOR ELECTRONIC, ELECTRICAL AND APPLIANCES MARKET, BY TYPE, 2018-2032 (USD THOUSAND)
TABLE 61 U.S. CHLOROPHOSPHATE IN FLAME RETARDANT FOR ELECTRONIC, ELECTRICAL AND APPLIANCES MARKET, BY TYPE, 2018-2032 (USD THOUSAND)
TABLE 62 U.S. HALOGENATED IN FLAME RETARDANT FOR ELECTRONIC, ELECTRICAL AND APPLIANCES MARKET, BY TYPE, 2018-2032 (USD THOUSAND)
TABLE 63 U.S. BROMINATED IN FLAME RETARDANT FOR ELECTRONIC, ELECTRICAL AND APPLIANCES MARKET, BY TYPE, 2018-2032 (USD THOUSAND)
TABLE 64 U.S. FLAME RETARDANT FOR ELECTRONIC, ELECTRICAL AND APPLIANCES MARKET, BY PLASTIC, 2018-2032 (USD THOUSAND)
TABLE 65 U.S. FLAME RETARDANT FOR ELECTRONIC, ELECTRICAL AND APPLIANCES MARKET, BY END USE, 2018-2032 (USD THOUSAND)
TABLE 66 U.S. ELECTRICAL AND ELECTRONICS IN FLAME RETARDANT FOR ELECTRONIC, ELECTRICAL AND APPLIANCES MARKET, BY APPLICATION, 2018-2032 (USD THOUSAND)
TABLE 67 U.S. ELECTRICAL CABLES IN FLAME RETARDANT FOR ELECTRONIC, ELECTRICAL AND APPLIANCES MARKET, BY TYPE, 2018-2032 (USD THOUSAND)
TABLE 68 U.S. ELECTRICAL FACILITIES IN FLAME RETARDANT FOR ELECTRONIC, ELECTRICAL AND APPLIANCES MARKET, BY TYPE, 2018-2032 (USD THOUSAND)
TABLE 69 U.S. ELECTRICAL AND ELECTRONICS IN FLAME RETARDANT FOR ELECTRONIC, ELECTRICAL AND APPLIANCES MARKET, BY TYPE, 2018-2032 (USD THOUSAND)
TABLE 70 U.S. HOUSEHOLD APPLIANCES IN FLAME RETARDANT FOR ELECTRONIC, ELECTRICAL AND APPLIANCES MARKET, BY APPLICATION, 2018-2032 (USD THOUSAND)
TABLE 71 U.S. HOUSEHOLD APPLIANCES IN FLAME RETARDANT FOR ELECTRONIC, ELECTRICAL AND APPLIANCES MARKET, BY TYPE, 2018-2032 (USD THOUSAND)
TABLE 72 U.S. PROFESSIONAL APPLIANCES IN FLAME RETARDANT FOR ELECTRONIC, ELECTRICAL AND APPLIANCES MARKET, BY APPLICATION, 2018-2032 (USD THOUSAND)
TABLE 73 U.S. PROFESSIONAL APPLIANCES IN FLAME RETARDANT FOR ELECTRONIC, ELECTRICAL AND APPLIANCES MARKET, BY TYPE, 2018-2032 (USD THOUSAND)
TABLE 74 CANADA FLAME RETARDANT FOR ELECTRONIC, ELECTRICAL AND APPLIANCES MARKET, BY TYPE, 2018-2032 (USD THOUSAND)
TABLE 75 CANADA FLAME RETARDANT FOR ELECTRONIC, ELECTRICAL AND APPLIANCES MARKET, BY TYPE, 2018-2032 (TONS)
TABLE 76 CANADA NON-HALOGENATED IN FLAME RETARDANT FOR ELECTRONIC, ELECTRICAL AND APPLIANCES MARKET, BY TYPE, 2018-2032 (USD THOUSAND)
TABLE 77 CANADA PHOSPHORUS IN FLAME RETARDANT FOR ELECTRONIC, ELECTRICAL AND APPLIANCES MARKET, BY TYPE, 2018-2032 (USD THOUSAND)
TABLE 78 CANADA CHLOROPHOSPHATE IN FLAME RETARDANT FOR ELECTRONIC, ELECTRICAL AND APPLIANCES MARKET, BY TYPE, 2018-2032 (USD THOUSAND)
TABLE 79 CANADA HALOGENATED IN FLAME RETARDANT FOR ELECTRONIC, ELECTRICAL AND APPLIANCES MARKET, BY TYPE, 2018-2032 (USD THOUSAND)
TABLE 80 CANADA BROMINATED IN FLAME RETARDANT FOR ELECTRONIC, ELECTRICAL AND APPLIANCES MARKET, BY TYPE, 2018-2032 (USD THOUSAND)
TABLE 81 CANADA FLAME RETARDANT FOR ELECTRONIC, ELECTRICAL AND APPLIANCES MARKET, BY PLASTIC, 2018-2032 (USD THOUSAND)
TABLE 82 CANADA FLAME RETARDANT FOR ELECTRONIC, ELECTRICAL AND APPLIANCES MARKET, BY END USE, 2018-2032 (USD THOUSAND)
TABLE 83 CANADA ELECTRICAL AND ELECTRONICS IN FLAME RETARDANT FOR ELECTRONIC, ELECTRICAL AND APPLIANCES MARKET, BY APPLICATION, 2018-2032 (USD THOUSAND)
TABLE 84 CANADA ELECTRICAL CABLES IN FLAME RETARDANT FOR ELECTRONIC, ELECTRICAL AND APPLIANCES MARKET, BY TYPE, 2018-2032 (USD THOUSAND)
TABLE 85 CANADA ELECTRICAL FACILITIES IN FLAME RETARDANT FOR ELECTRONIC, ELECTRICAL AND APPLIANCES MARKET, BY TYPE, 2018-2032 (USD THOUSAND)
TABLE 86 CANADA ELECTRICAL AND ELECTRONICS IN FLAME RETARDANT FOR ELECTRONIC, ELECTRICAL AND APPLIANCES MARKET, BY TYPE, 2018-2032 (USD THOUSAND)
TABLE 87 CANADA HOUSEHOLD APPLIANCES IN FLAME RETARDANT FOR ELECTRONIC, ELECTRICAL AND APPLIANCES MARKET, BY APPLICATION, 2018-2032 (USD THOUSAND)
TABLE 88 CANADA HOUSEHOLD APPLIANCES IN FLAME RETARDANT FOR ELECTRONIC, ELECTRICAL AND APPLIANCES MARKET, BY TYPE, 2018-2032 (USD THOUSAND)
TABLE 89 CANADA PROFESSIONAL APPLIANCES IN FLAME RETARDANT FOR ELECTRONIC, ELECTRICAL AND APPLIANCES MARKET, BY APPLICATION, 2018-2032 (USD THOUSAND)
TABLE 90 CANADA PROFESSIONAL APPLIANCES IN FLAME RETARDANT FOR ELECTRONIC, ELECTRICAL AND APPLIANCES MARKET, BY TYPE, 2018-2032 (USD THOUSAND)
TABLE 91 MEXICO FLAME RETARDANT FOR ELECTRONIC, ELECTRICAL AND APPLIANCES MARKET, BY TYPE, 2018-2032 (USD THOUSAND)
TABLE 92 MEXICO FLAME RETARDANT FOR ELECTRONIC, ELECTRICAL AND APPLIANCES MARKET, BY TYPE, 2018-2032 (TONS)
TABLE 93 MEXICO NON-HALOGENATED IN FLAME RETARDANT FOR ELECTRONIC, ELECTRICAL AND APPLIANCES MARKET, BY TYPE, 2018-2032 (USD THOUSAND)
TABLE 94 MEXICO PHOSPHORUS IN FLAME RETARDANT FOR ELECTRONIC, ELECTRICAL AND APPLIANCES MARKET, BY TYPE, 2018-2032 (USD THOUSAND)
TABLE 95 MEXICO CHLOROPHOSPHATE IN FLAME RETARDANT FOR ELECTRONIC, ELECTRICAL AND APPLIANCES MARKET, BY TYPE, 2018-2032 (USD THOUSAND)
TABLE 96 MEXICO HALOGENATED IN FLAME RETARDANT FOR ELECTRONIC, ELECTRICAL AND APPLIANCES MARKET, BY TYPE, 2018-2032 (USD THOUSAND)
TABLE 97 MEXICO BROMINATED IN FLAME RETARDANT FOR ELECTRONIC, ELECTRICAL AND APPLIANCES MARKET, BY TYPE, 2018-2032 (USD THOUSAND)
TABLE 98 MEXICO FLAME RETARDANT FOR ELECTRONIC, ELECTRICAL AND APPLIANCES MARKET, BY PLASTIC, 2018-2032 (USD THOUSAND)
TABLE 99 MEXICO FLAME RETARDANT FOR ELECTRONIC, ELECTRICAL AND APPLIANCES MARKET, BY END USE, 2018-2032 (USD THOUSAND)
TABLE 100 MEXICO ELECTRICAL AND ELECTRONICS IN FLAME RETARDANT FOR ELECTRONIC, ELECTRICAL AND APPLIANCES MARKET, BY APPLICATION, 2018-2032 (USD THOUSAND)
TABLE 101 MEXICO ELECTRICAL CABLES IN FLAME RETARDANT FOR ELECTRONIC, ELECTRICAL AND APPLIANCES MARKET, BY TYPE, 2018-2032 (USD THOUSAND)
TABLE 102 MEXICO ELECTRICAL FACILITIES IN FLAME RETARDANT FOR ELECTRONIC, ELECTRICAL AND APPLIANCES MARKET, BY TYPE, 2018-2032 (USD THOUSAND)
TABLE 103 MEXICO ELECTRICAL AND ELECTRONICS IN FLAME RETARDANT FOR ELECTRONIC, ELECTRICAL AND APPLIANCES MARKET, BY TYPE, 2018-2032 (USD THOUSAND)
TABLE 104 MEXICO HOUSEHOLD APPLIANCES IN FLAME RETARDANT FOR ELECTRONIC, ELECTRICAL AND APPLIANCES MARKET, BY APPLICATION, 2018-2032 (USD THOUSAND)
TABLE 105 MEXICO HOUSEHOLD APPLIANCES IN FLAME RETARDANT FOR ELECTRONIC, ELECTRICAL AND APPLIANCES MARKET, BY TYPE, 2018-2032 (USD THOUSAND)
TABLE 106 MEXICO PROFESSIONAL APPLIANCES IN FLAME RETARDANT FOR ELECTRONIC, ELECTRICAL AND APPLIANCES MARKET, BY APPLICATION, 2018-2032 (USD THOUSAND)
TABLE 107 MEXICO PROFESSIONAL APPLIANCES IN FLAME RETARDANT FOR ELECTRONIC, ELECTRICAL AND APPLIANCES MARKET, BY TYPE, 2018-2032 (USD THOUSAND)
List of Figure
FIGURE 1 NORTH AMERICA FLAME RETARDANT FOR ELECTRONIC, ELECTRICAL AND APPLIANCES MARKET
FIGURE 2 NORTH AMERICA FLAME RETARDANT FOR ELECTRONIC, ELECTRICAL AND APPLIANCES MARKET: DATA TRIANGULATION
FIGURE 3 NORTH AMERICA FLAME RETARDANT FOR ELECTRONIC, ELECTRICAL AND APPLIANCES MARKET: DROC ANALYSIS
FIGURE 4 NORTH AMERICA FLAME RETARDANT FOR ELECTRONIC, ELECTRICAL AND APPLIANCES MARKET: NORTH AMERICA VS REGIONAL MARKET ANALYSIS
FIGURE 5 NORTH AMERICA FLAME RETARDANT FOR ELECTRONIC, ELECTRICAL AND APPLIANCES MARKET: COMPANY RESEARCH ANALYSIS
FIGURE 6 NORTH AMERICA FLAME RETARDANT FOR ELECTRONIC, ELECTRICAL AND APPLIANCES MARKET: MULTIVARIATE MODELLING
FIGURE 7 NORTH AMERICA FLAME RETARDANT FOR ELECTRONIC, ELECTRICAL AND APPLIANCES MARKET: INTERVIEW DEMOGRAPHICS
FIGURE 8 NORTH AMERICA FLAME RETARDANT FOR ELECTRONIC, ELECTRICAL AND APPLIANCES MARKET: DBMR MARKET POSITION GRID
FIGURE 9 NORTH AMERICA FLAME RETARDANT FOR ELECTRONIC, ELECTRICAL AND APPLIANCES MARKET: VENDOR SHARE ANALYSIS
FIGURE 10 MARKET END USE COVERAGE GRID
FIGURE 11 NORTH AMERICA FLAME RETARDANT FOR ELECTRONIC, ELECTRICAL AND APPLIANCES MARKET: SEGMENTATION
FIGURE 12 NORTH AMERICA FLAME RETARDANT FOR ELECTRONIC, ELECTRICAL AND APPLIANCES MARKET: EXECUTIVE SUMMARY
FIGURE 13 TWO SEGMENTS COMPRISE THE NORTH AMERICA FLAME RETARDANT FOR ELECTRONIC, ELECTRICAL AND APPLIANCES MARKET, BY TYPE (2024)
FIGURE 14 STRATEGIC DECISIONS
FIGURE 15 INCREASING DEMAND FOR CONSUMER ELECTRONICS IS EXPECTED TO DRIVE THE NORTH AMERICA FLAME RETARDANT FOR ELECTRONIC, ELECTRICAL AND APPLIANCES MARKET IN THE FORECAST PERIOD OF 2025 TO 2032
FIGURE 16 THE NON-HALOGENATED SEGMENT IS EXPECTED TO ACCOUNT FOR THE LARGEST MARKET SHARE OF THE NORTH AMERICA FLAME RETARDANT FOR ELECTRONIC, ELECTRICAL AND APPLIANCES MARKET IN 2025 AND 2032
FIGURE 17 PESTEL ANALYSIS
FIGURE 18 PORTER’S FIVE FORCES
FIGURE 19 IMPORT EXPORT SCENARIO (USD THOUSAND)
FIGURE 20 NORTH AMERICA FLAME RETARDANT FOR ELECTRONIC, ELECTRICAL AND APPLIANCES MARKET, 2024-2032, AVERAGE SELLING PRICE (USD/KG)
FIGURE 21 PRODUCTION CONSUMPTION ANALYSIS: NORTH AMERICA FLAME RETARDANT FOR ELECTRONIC, ELECTRICAL AND APPLIANCES MARKET
FIGURE 22 VENDOR SELECTION CRITERIA
FIGURE 23 DRIVERS, RESTRAINTS, OPPORTUNITIES AND CHALLENGES FOR NORTH AMERICA FLAME RETARDANT FOR ELECTRONIC, ELECTRICAL AND APPLIANCES MARKET
FIGURE 24 TOTAL NUMBER OF MOBILE PHONES SOLD WORLDWIDE EACH YEAR
FIGURE 25 TOP STATES FOR UTILITY- AND SMALL-SCALE SOLAR (COMBINED) CAPACITY AND GENERATION IN 2023
FIGURE 26 NORTH AMERICA MOTOR VEHICLE SALES BY COUNTRY IN 2021
FIGURE 27 NORTH AMERICA FLAME RETARDANT FOR ELECTRONIC, ELECTRICAL AND APPLIANCES MARKET: BY TYPE, 2024
FIGURE 28 NORTH AMERICA FLAME RETARDANT FOR ELECTRONIC, ELECTRICAL AND APPLIANCES MARKET: BY PLASTIC, 2024
FIGURE 29 NORTH AMERICA FLAME RETARDANT FOR ELECTRONIC, ELECTRICAL AND APPLIANCES MARKET: BY END USE, 2024
FIGURE 30 NORTH AMERICA FLAME RETARDANT FOR ELECTRONIC, ELECTRICAL AND APPLIANCES MARKET: SNAPSHOT (2024)
FIGURE 31 NORTH AMERICA FLAME RETARDANT FOR ELECTRONIC, ELECTRICAL AND APPLIANCES MARKET: COMPANY SHARE 2024 (%)
North America Flame Retardant For Electronic Electrical And Appliances Market, Supply Chain Analysis and Ecosystem Framework
To support market growth and help clients navigate the impact of geopolitical shifts, DBMR has integrated in-depth supply chain analysis into its North America Flame Retardant For Electronic Electrical And Appliances Market research reports. This addition empowers clients to respond effectively to global changes affecting their industries. The supply chain analysis section includes detailed insights such as North America Flame Retardant For Electronic Electrical And Appliances Market consumption and production by country, price trend analysis, the impact of tariffs and geopolitical developments, and import and export trends by country and HSN code. It also highlights major suppliers with data on production capacity and company profiles, as well as key importers and exporters. In addition to research, DBMR offers specialized supply chain consulting services backed by over a decade of experience, providing solutions like supplier discovery, supplier risk assessment, price trend analysis, impact evaluation of inflation and trade route changes, and comprehensive market trend analysis.
Data collection and base year analysis are done using data collection modules with large sample sizes. The stage includes obtaining market information or related data through various sources and strategies. It includes examining and planning all the data acquired from the past in advance. It likewise envelops the examination of information inconsistencies seen across different information sources. The market data is analysed and estimated using market statistical and coherent models. Also, market share analysis and key trend analysis are the major success factors in the market report. To know more, please request an analyst call or drop down your inquiry.
The key research methodology used by DBMR research team is data triangulation which involves data mining, analysis of the impact of data variables on the market and primary (industry expert) validation. Data models include Vendor Positioning Grid, Market Time Line Analysis, Market Overview and Guide, Company Positioning Grid, Patent Analysis, Pricing Analysis, Company Market Share Analysis, Standards of Measurement, Global versus Regional and Vendor Share Analysis. To know more about the research methodology, drop in an inquiry to speak to our industry experts.
Data Bridge Market Research is a leader in advanced formative research. We take pride in servicing our existing and new customers with data and analysis that match and suits their goal. The report can be customized to include price trend analysis of target brands understanding the market for additional countries (ask for the list of countries), clinical trial results data, literature review, refurbished market and product base analysis. Market analysis of target competitors can be analyzed from technology-based analysis to market portfolio strategies. We can add as many competitors that you require data about in the format and data style you are looking for. Our team of analysts can also provide you data in crude raw excel files pivot tables (Fact book) or can assist you in creating presentations from the data sets available in the report.


