
North America Foundry Chemicals Market
Market Size in USD Billion
 USD
2.68 Billion
USD
3.78 Billion
2025
2033
USD
2.68 Billion
USD
3.78 Billion
2025
2033
| 2026 - 2033 | |
| USD 2.68 Billion | |
| USD 3.78 Billion | |
| % | |
|
North America Foundry Chemicals Market Size
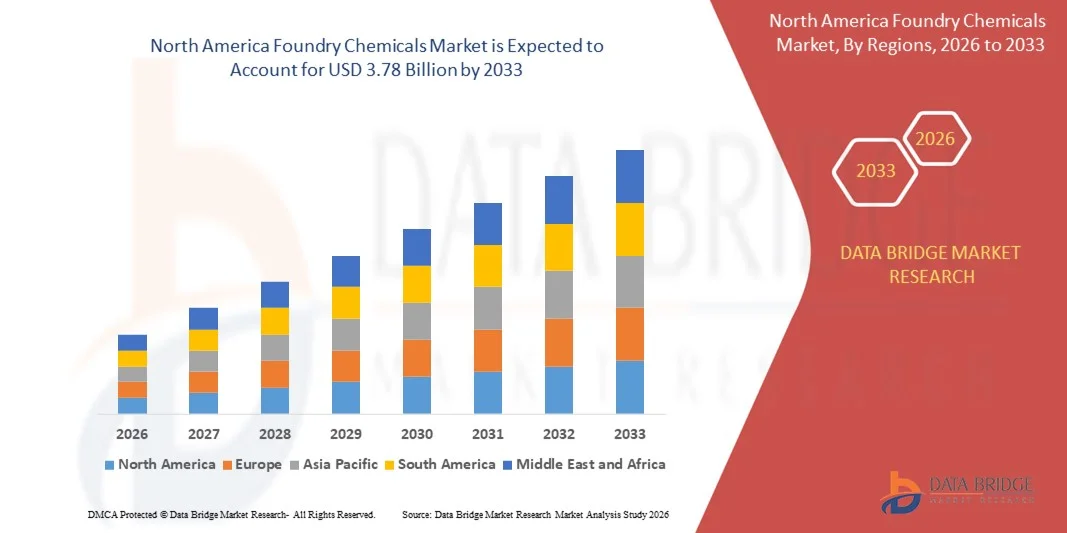
- The North America foundry chemicals market size was valued at USD 2.68 billion in 2025 and is expected to reach USD 3.78 billion by 2033, at a CAGR of 4.4% during the forecast period
- The market growth is largely driven by rising demand for cast metal components across automotive, construction, industrial machinery, and infrastructure sectors, which directly increases the consumption of binders, additives, coatings, and fluxes used in foundry operations
- Furthermore, continuous modernization of foundries, increasing automation, and growing emphasis on improving casting quality, productivity, and defect reduction are accelerating the adoption of advanced and high-performance foundry chemical solutions, thereby supporting sustained market expansion
North America Foundry Chemicals Market Analysis
- Foundry chemicals, which play a critical role in mold and core preparation, metal treatment, and surface finishing, are essential for achieving dimensional accuracy, structural integrity, and consistent quality in ferrous and non-ferrous castings across diverse industrial applications
- The increasing demand for lightweight metals, stringent quality and environmental regulations, and a growing focus on sustainable and low-emission manufacturing practices are key factors driving the steady adoption of innovative and environmentally compliant foundry chemical formulations
- U.S. dominated the foundry chemicals market in 2025, due to strong demand from automotive, aerospace, heavy machinery, and industrial manufacturing sectors, along with the presence of a well-established ferrous and non-ferrous foundry base
- Canada is expected to be the fastest growing country in the foundry chemicals market during the forecast period due to growing investments in automotive manufacturing, infrastructure development, and industrial equipment production
- Ferrous segment dominated the market with a market share of 62.8% in 2025, due to large-scale production of cast iron and steel components for automotive, construction, and industrial machinery sectors. High demand for durable and load-bearing components sustains continuous consumption of foundry chemicals in ferrous applications. Established manufacturing infrastructure and consistent volume production further strengthen segment dominance
Report Scope and Foundry Chemicals Market Segmentation
|
Attributes |
Foundry Chemicals Key Market Insights |
|
Segments Covered |
|
|
Countries Covered |
North America
|
|
Key Market Players |
|
|
Market Opportunities |
|
|
Value Added Data Infosets |
In addition to the insights on market scenarios such as market value, growth rate, segmentation, geographical coverage, and major players, the market reports curated by the Data Bridge Market Research also include import export analysis, production capacity overview, production consumption analysis, price trend analysis, climate change scenario, supply chain analysis, value chain analysis, raw material/consumables overview, vendor selection criteria, PESTLE Analysis, Porter Analysis, and regulatory framework. |
North America Foundry Chemicals Market Trends
Rising Adoption of Eco-Friendly Foundry Chemical Formulations
- A key trend in the foundry chemicals market is the increasing adoption of eco-friendly and low-emission chemical formulations, driven by rising environmental awareness and tightening regulatory standards across global foundry operations. Foundries are gradually shifting toward sustainable binders, additives, and coatings to reduce VOC emissions and improve workplace safety while maintaining casting quality
- For instance, companies such as ASK Chemicals and Hüttenes-Albertus are supplying low-emission and inorganic binder systems that support cleaner production processes and regulatory compliance. These solutions help foundries minimize environmental impact while achieving consistent mold strength and dimensional accuracy
- Automotive and industrial manufacturers are encouraging foundries to adopt greener chemical solutions to align with broader sustainability goals across supply chains. This is strengthening the demand for environmentally responsible foundry chemicals that support high-volume and precision casting
- The trend is further supported by increasing investments in modern foundry technologies that enable efficient use of chemicals and lower material waste. Advanced formulations help improve productivity while reducing rework and scrap rates
- Foundries producing non-ferrous and lightweight metal castings are especially adopting eco-friendly chemicals to meet emission standards and performance expectations. This shift is reinforcing the role of sustainable formulations in modern casting environments
- The growing emphasis on environmental compliance, operational efficiency, and long-term cost optimization is positioning eco-friendly foundry chemicals as a central trend shaping market evolution
North America Foundry Chemicals Market Dynamics
Driver
Growing Demand for Cast Components from Automotive and Industrial Sectors
- The rising demand for cast components from automotive, construction, and industrial machinery sectors is a major driver for the foundry chemicals market. Increased production of engines, transmission systems, structural parts, and industrial equipment directly boosts the consumption of binders, coatings, and additives
- For instance, automotive manufacturers increasingly rely on high-quality cast iron, steel, and aluminium components, driving foundries to adopt advanced chemical systems that ensure strength, precision, and surface finish. This demand strengthens consistent usage of performance-driven foundry chemicals
- Industrial expansion and infrastructure development projects are increasing the need for durable and large-scale cast components. Foundry chemicals play a critical role in supporting high-volume production while maintaining quality standards
- The growth of electric vehicles and lightweight material usage is further intensifying demand for specialized chemical formulations suitable for aluminium and non-ferrous castings. This supports continuous innovation and adoption within the market
- As manufacturers focus on reducing defects and improving productivity, foundries are investing more in high-performance chemical solutions. This sustained industrial demand continues to reinforce market growth
Restraint/Challenge
Strict Environmental Regulations and Compliance Costs
- The foundry chemicals market faces challenges from strict environmental regulations related to emissions, waste disposal, and chemical handling. Compliance with these regulations requires significant investment in cleaner technologies and compliant chemical formulations
- For instance, regulations governing VOC emissions and hazardous substances compel foundries to replace conventional chemicals with advanced alternatives, often at higher costs. This increases operational expenses, particularly for small and mid-sized foundries
- The transition to environmentally compliant chemicals may also require process modifications and employee training, adding to implementation complexity. These factors can slow adoption rates in cost-sensitive regions
- Rising raw material prices and the need for continuous monitoring further increase compliance costs for chemical manufacturers and end users. This creates pricing pressure across the supply chain
- Balancing regulatory compliance with cost efficiency remains a persistent challenge for market participants. These constraints continue to influence purchasing decisions and impact overall market expansion pace
North America Foundry Chemicals Market Scope
The market is segmented on the basis of type, product type, foundry type, foundry tool type, foundry process type, foundry system type, application, and distribution channel.
- By Type
On the basis of type, the foundry chemicals market is segmented into benzene, formaldehyde, naphthalene, phenol, xylene, and others. The phenol segment dominated the market in 2025, driven by its extensive use in phenolic resins for mold and core making across ferrous and non-ferrous foundries. Phenol-based chemicals offer high thermal stability, strong bonding strength, and consistent casting surface quality, making them a preferred choice for large-scale industrial applications. Their compatibility with automated foundry processes and ability to withstand high pouring temperatures further supports strong adoption across automotive and heavy engineering castings.
The formaldehyde segment is expected to witness the fastest growth from 2026 to 2033, supported by rising demand for cost-effective binder systems with improved curing efficiency. Formaldehyde-based formulations enable faster mold setting times and improved productivity, particularly in high-volume casting environments. Increasing investments in infrastructure and machinery manufacturing are also accelerating the uptake of formaldehyde derivatives in modern foundry operations.
- By Product Type
On the basis of product type, the market is segmented into binders, additive agents, coatings, fluxes, and others. The binders segment dominated the market in 2025, as binders play a critical role in providing mold strength, dimensional accuracy, and defect reduction during casting. High consumption of organic and inorganic binders in sand casting processes, especially for automotive and industrial components, continues to drive revenue leadership. Their ability to improve collapsibility and surface finish reinforces their widespread use across foundry types.
The coatings segment is projected to grow at the fastest rate during the forecast period, driven by increasing focus on improving casting surface quality and reducing metal penetration defects. Advanced refractory coatings help enhance thermal insulation and extend mold life, which supports efficiency gains. Growing adoption of precision casting and high-performance alloys further fuels demand for specialized foundry coatings.
- By Foundry Type
On the basis of foundry type, the market is segmented into ferrous and non-ferrous. The ferrous foundry segment held the dominant share of 62.8% in 2025, supported by large-scale production of cast iron and steel components for automotive, construction, and industrial machinery sectors. High demand for durable and load-bearing components sustains continuous consumption of foundry chemicals in ferrous applications. Established manufacturing infrastructure and consistent volume production further strengthen segment dominance.
The non-ferrous segment is expected to register the fastest growth from 2026 to 2033, driven by rising use of aluminium and other lightweight metals in automotive and aerospace industries. Increasing emphasis on fuel efficiency and emission reduction supports higher non-ferrous casting output. This trend directly boosts demand for specialized chemicals tailored to non-ferrous foundry requirements.
- By Foundry Tool Type
On the basis of foundry tool type, the market includes shovel, trowels, lifter, hand riddle, vent wire, rammers, swab, sprue pins and cutters, and others. The rammers segment dominated the market in 2025, as rammers are essential for achieving uniform sand compaction and mold integrity in both manual and semi-automated foundries. Consistent use across small and large foundry setups ensures steady demand for compatible chemical systems. Their role in minimizing casting defects supports continued adoption.
The vent wire segment is anticipated to grow at the fastest pace during the forecast period, driven by increased attention to gas evacuation and defect prevention in complex mold designs. Advanced venting practices improve casting quality and reduce scrap rates, encouraging wider usage. Growth in precision and high-value castings further accelerates this trend.
- By Foundry Process Type
On the basis of foundry process type, the market is segmented into thermal galvanization and electroless nickel plating. The thermal galvanization segment dominated the market in 2025, supported by its widespread use for corrosion protection in structural and industrial castings. The process requires consistent chemical formulations to ensure coating uniformity and durability. High demand from construction and infrastructure projects reinforces segment leadership.
The electroless nickel plating segment is expected to witness the fastest growth from 2026 to 2033, driven by increasing need for high-precision, wear-resistant, and corrosion-resistant cast components. Its ability to provide uniform coating thickness enhances performance in automotive and engineering applications. Rising adoption of advanced surface treatment technologies further supports growth.
- By Foundry System Type
On the basis of foundry system type, the market is segmented into sand cast systems and chemically bonded sand cast systems. The sand cast systems segment dominated the market in 2025, due to its cost efficiency, flexibility, and suitability for a wide range of casting sizes and metals. High consumption of sand-related chemicals in traditional casting operations sustains strong demand. Its widespread adoption across developing manufacturing regions reinforces market share.
The chemically bonded sand cast systems segment is projected to grow at the fastest rate, driven by demand for higher dimensional accuracy and improved surface finish. These systems reduce rework and machining requirements, supporting operational efficiency. Increasing automation in foundries accelerates adoption of chemically bonded systems.
- By Application
On the basis of application, the market is segmented into cast iron, steel, aluminium, and others. The cast iron segment dominated the market in 2025, supported by its extensive use in automotive components, pipes, and machinery parts. High production volumes and established supply chains result in consistent consumption of foundry chemicals. Its cost effectiveness and mechanical strength sustain long-term demand.
The aluminium segment is expected to witness the fastest growth during the forecast period, driven by rising adoption of lightweight materials across automotive and transportation industries. Aluminium casting requires specialized chemical formulations to ensure quality and performance. Growing electric vehicle production further boosts demand in this segment.
- By Distribution Channel
On the basis of distribution channel, the market is segmented into e-commerce, specialty stores, B2B/third party distributors, and others. The B2B/third party distributors segment dominated the market in 2025, as foundries rely on established supplier networks for bulk procurement and technical support. Long-term contracts and reliable logistics ensure consistent supply of critical chemicals. This channel remains central to large-scale industrial operations.
The e-commerce segment is anticipated to grow at the fastest rate from 2026 to 2033, supported by increasing digitalization of industrial procurement. Online platforms offer wider product visibility, faster ordering, and improved price transparency. Small and mid-sized foundries increasingly adopt this channel for efficient sourcing.
North America Foundry Chemicals Market Regional Analysis
- U.S. dominated the foundry chemicals market with the largest revenue share in 2025, driven by strong demand from automotive, aerospace, heavy machinery, and industrial manufacturing sectors, along with the presence of a well-established ferrous and non-ferrous foundry base
- Stringent quality standards, workplace safety regulations, and environmental compliance requirements encourage the adoption of high-performance and low-emission foundry chemicals in the U.S. The strong presence of leading chemical manufacturers, continuous investments in R&D, and increasing automation within foundries further reinforce the country’s leadership position in the regional market
- Rising focus on productivity optimization, defect reduction, and lightweight metal casting, along with modernization of aging foundry infrastructure, ensures that the U.S. maintains its dominant role throughout the forecast period.
Canada Foundry Chemicals Market Insight
Canada is projected to register the fastest CAGR in the North America foundry chemicals market from 2026 to 2033, supported by growing investments in automotive manufacturing, infrastructure development, and industrial equipment production. Increasing adoption of aluminium and non-ferrous castings, coupled with rising demand for advanced binder systems and environmentally compliant chemicals, is accelerating market growth. Collaboration between domestic foundries and global chemical suppliers, along with a focus on efficiency and sustainable manufacturing practices, positions Canada as the fastest-growing market in the region.
Mexico Foundry Chemicals Market Insight
Mexico is expected to grow steadily from 2026 to 2033, driven by expanding automotive and industrial manufacturing activities and increasing foreign direct investment in foundry operations. Government support for industrial development, rising production of cast components for export markets, and gradual adoption of modern foundry chemicals contribute to consistent market expansion. The strengthening presence of regional suppliers and improving access to advanced chemical solutions support steady growth across the forecast period.
North America Foundry Chemicals Market Share
The foundry chemicals industry is primarily led by well-established companies, including:
- Saint-Gobain Performance Ceramics & Refractories (PCR) (France)
- Carpenter Brothers, Inc. (U.S.)
- Compax Industrial Systems Pvt. Ltd (India)
- CS Additive GmbH (Germany)
- CAGroup (A Subsidiary of AMC Group) (U.S.)
- Mancuso Chemicals Limited (Canada)
- Ceraflux India Pvt. Ltd. (India)
- Forace Polymers (P) Ltd. (India)
- DuPont (U.S.)
- John Winter (U.K.)
- Georgia-Pacific Chemicals (U.S.)
- Ultraseal India Pvt. Ltd. (India)
- Hüttenes-Albertus (Germany)
- Vesuvius (U.K.)
- Ashland Global Holdings Inc. (Germany)
- Imerys (France)
- Shandong Crownchem Industries Co., Ltd (China)
- Cavenaghi S.p.A (Italy)
Latest Developments in North America Foundry Chemicals Market
- In June 2024, Clariant strengthened its position in the foundry chemicals market through its participation in Metal China 2024 held in Shanghai, where it showcased advanced and sustainable foundry chemical solutions. This development is expected to influence the market by improving foundry process efficiency, enhancing casting performance, and supporting sustainability goals across large-scale manufacturing hubs. Clariant’s strong focus on innovation and next-generation formulations is likely to accelerate adoption of specialized foundry chemicals in both domestic and global markets
- In January 2024, Loramendi generated strong momentum in the Indian foundry chemicals market by announcing the upcoming launch of a state-of-the-art solution designed to redefine operational benchmarks. This development is anticipated to drive demand for advanced foundry chemicals compatible with high-automation and precision-driven foundry systems. The innovation supports market growth by encouraging modernization of foundry operations and increasing reliance on high-performance chemical formulations in India
- In September 2023, Hüttenes-Albertus introduced a new low-emission inorganic binder technology aimed at reducing VOC emissions while maintaining high casting quality. This development is expected to positively impact the market by supporting regulatory compliance, improving workplace safety, and strengthening sustainability-focused foundry practices. The innovation enhances demand for environmentally responsible foundry chemicals across automotive and industrial casting applications
- In January 2021, ASK Chemicals, a subsidiary of Ashland, launched an environmentally friendly self-curing polyurethane binder system that delivered improved casting results and higher productivity. This development strengthened the company’s market position by addressing the growing need for sustainable yet high-performance binder systems. The launch contributed to long-term sales growth by reinforcing customer trust and increasing adoption of advanced chemical technologies
- In November 2020, Vesuvius expanded its market presence by participating in the ANKIROS 2020 trade fair in Istanbul, where it showcased a broad portfolio of metallurgy and foundry-related solutions. This development supported market growth by increasing product visibility, expanding the company’s customer base, and strengthening engagement with global foundry operators. Participation in the exhibition contributed to steady sales growth and reinforced Vesuvius’s competitive positioning in the foundry chemicals market
SKU-

- Interactive Data Analysis Dashboard
- Company Analysis Dashboard for high growth potential opportunities
- Research Analyst Access for customization & queries
- Competitor Analysis with Interactive dashboard
- Latest News, Updates & Trend analysis
- Harness the Power of Benchmark Analysis for Comprehensive Competitor Tracking
North America Foundry Chemicals Market, Supply Chain Analysis and Ecosystem Framework
To support market growth and help clients navigate the impact of geopolitical shifts, DBMR has integrated in-depth supply chain analysis into its North America Foundry Chemicals Market research reports. This addition empowers clients to respond effectively to global changes affecting their industries. The supply chain analysis section includes detailed insights such as North America Foundry Chemicals Market consumption and production by country, price trend analysis, the impact of tariffs and geopolitical developments, and import and export trends by country and HSN code. It also highlights major suppliers with data on production capacity and company profiles, as well as key importers and exporters. In addition to research, DBMR offers specialized supply chain consulting services backed by over a decade of experience, providing solutions like supplier discovery, supplier risk assessment, price trend analysis, impact evaluation of inflation and trade route changes, and comprehensive market trend analysis.
Data collection and base year analysis are done using data collection modules with large sample sizes. The stage includes obtaining market information or related data through various sources and strategies. It includes examining and planning all the data acquired from the past in advance. It likewise envelops the examination of information inconsistencies seen across different information sources. The market data is analysed and estimated using market statistical and coherent models. Also, market share analysis and key trend analysis are the major success factors in the market report. To know more, please request an analyst call or drop down your inquiry.
The key research methodology used by DBMR research team is data triangulation which involves data mining, analysis of the impact of data variables on the market and primary (industry expert) validation. Data models include Vendor Positioning Grid, Market Time Line Analysis, Market Overview and Guide, Company Positioning Grid, Patent Analysis, Pricing Analysis, Company Market Share Analysis, Standards of Measurement, Global versus Regional and Vendor Share Analysis. To know more about the research methodology, drop in an inquiry to speak to our industry experts.
Data Bridge Market Research is a leader in advanced formative research. We take pride in servicing our existing and new customers with data and analysis that match and suits their goal. The report can be customized to include price trend analysis of target brands understanding the market for additional countries (ask for the list of countries), clinical trial results data, literature review, refurbished market and product base analysis. Market analysis of target competitors can be analyzed from technology-based analysis to market portfolio strategies. We can add as many competitors that you require data about in the format and data style you are looking for. Our team of analysts can also provide you data in crude raw excel files pivot tables (Fact book) or can assist you in creating presentations from the data sets available in the report.


