
North America Gaskets And Seals Market
Market Size in USD Billion
 USD
19.02 Billion
USD
30.32 Billion
2025
2033
USD
19.02 Billion
USD
30.32 Billion
2025
2033
| 2026 - 2033 | |
| USD 19.02 Billion | |
| USD 30.32 Billion | |
| % | |
|
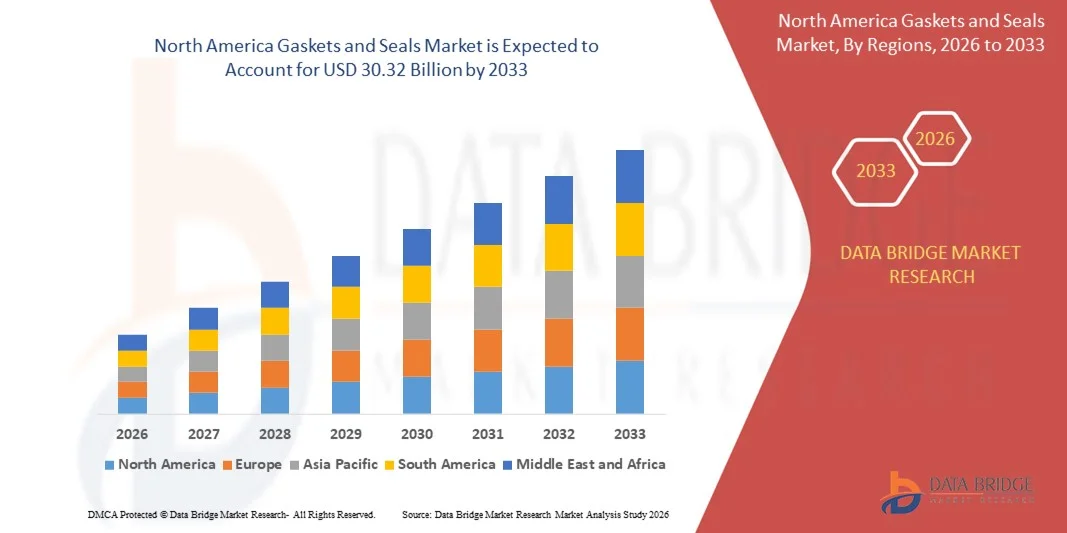
North America Gaskets and Seals Market Size
- The North America gaskets and seals market size was valued at USD 19.02 billion in 2025 and is expected to reach USD 30.32 billion by 2033, at a CAGR of 6.00% during the forecast period
- The market growth is largely fuelled by the rising demand from automotive, aerospace, oil and gas, and manufacturing industries for improved sealing efficiency and leakage prevention
- Growing emphasis on equipment reliability, operational safety, and maintenance cost reduction is further driving adoption
North America Gaskets and Seals Market Analysis
- The market is witnessing steady growth driven by the rising need for high-performance sealing solutions that can withstand extreme pressures, temperatures, and corrosive environments
- Advancements in material technologies such as elastomers, composites, and metal-reinforced seals are enhancing durability and performance
- U.S. gaskets and seals market captured the largest revenue share in 2025 within North America, driven by strong industrial infrastructure, high investment in equipment modernization, and increasing demand for reliable sealing in critical applications
- Canada is expected to witness the highest compound annual growth rate (CAGR) in the North America gaskets and seals market due to increasing industrial automation, rising infrastructure projects, and growing adoption of high-performance sealing components to enhance operational efficiency and reduce downtime
- The seals segment held the largest market revenue share in 2025 driven by their extensive usage in rotating equipment such as pumps, compressors, and engines across manufacturing and automotive industries. Their ability to provide reliable leakage control in high-pressure and high-temperature systems makes them essential in industrial operations
Report Scope and North America Gaskets and Seals Market Segmentation
|
Attributes |
North America Gaskets and Seals Key Market Insights |
|
Segments Covered |
|
|
Countries Covered |
North America
|
|
Key Market Players |
|
|
Market Opportunities |
|
|
Value Added Data Infosets |
In addition to the insights on market scenarios such as market value, growth rate, segmentation, geographical coverage, and major players, the market reports curated by the Data Bridge Market Research also include import export analysis, production capacity overview, production consumption analysis, price trend analysis, climate change scenario, supply chain analysis, value chain analysis, raw material/consumables overview, vendor selection criteria, PESTLE Analysis, Porter Analysis, and regulatory framework. |
North America Gaskets and Seals Market Trends
Rise of Advanced Material Integration in Gaskets and Seals
- The growing adoption of advanced materials such as high-performance elastomers, PTFE composites, and metal-reinforced sealing solutions is transforming the gaskets and seals landscape by enhancing durability, chemical resistance, and thermal stability across industrial applications. These materials offer superior performance in harsh operating environments where traditional sealing components fail. Their widespread integration is supporting higher reliability and efficiency in critical machinery systems
- The demand for sealing components that can withstand extreme temperatures, aggressive fluids, and high-pressure environments is accelerating innovation in material science, particularly in industries such as oil and gas, chemicals, and automotive where operational reliability is highly critical. Manufacturers are focusing on creating formulations that deliver greater resilience while reducing leakage risks. This trend is driving the adoption of advanced sealing technologies in both new installations and maintenance activities
- The shift toward lightweight and energy-efficient machinery is driving the use of engineered materials with improved mechanical properties, supporting longer service life and lower maintenance requirements. These materials contribute to reduced equipment weight while maintaining strong sealing integrity. Their adoption is helping industries achieve energy savings, improved operational output, and enhanced system performance
- For instance, in 2023, several automotive OEMs integrated advanced fluorocarbon and silicone-based seals to improve engine efficiency and reduce leakage incidents, resulting in enhanced performance and reduced warranty claims. These materials enabled better resistance to thermal cycling and chemical exposure. The integration of such solutions is setting new standards for next-generation automotive sealing systems
- While material innovations are improving performance and expanding application scope, their adoption depends on cost efficiency, compatibility testing, and manufacturing scalability. Companies must invest in rigorous validation processes to ensure suitability across diverse operating conditions. Manufacturers need to prioritize localized production, tailored formulations, and cost-effective processes to meet the rising demand efficiently
North America Gaskets and Seals Market Dynamics
Driver
Increasing Industrial Automation and Demand for Asset Reliability
- The rise in industrial automation is pushing manufacturers across sectors to prioritize high-quality sealing solutions that ensure uninterrupted operations and prevent equipment failures. Automated systems rely heavily on components that minimize leakage, maintain pressure integrity, and support long operating cycles. This trend is elevating the need for durable, precision-engineered gaskets and seals across fast-growing industrial environments
- Industries are increasingly aware of the high financial risks associated with equipment downtime, including productivity loss, safety hazards, and costly repairs. This awareness has led to consistent adoption of premium gaskets and seals in critical machinery where reliability is non-negotiable. As a result, preventive maintenance strategies are becoming more robust, further boosting demand for high-performance sealing components
- Government initiatives and industrial safety standards are strengthening infrastructure for preventive maintenance and equipment certification, accelerating the need for reliable sealing components. Compliance frameworks require industries to implement sealing solutions capable of withstanding strict operational benchmarks. This is increasing investment in advanced sealing technologies across manufacturing, processing, and heavy-duty industrial operations
- For instance, multiple industrial facilities upgraded their sealing systems in high-pressure applications to improve operational safety and reduce maintenance-related disruptions. These upgrades helped reduce unplanned shutdowns and equipment failures. The move reflects a broader shift toward performance-driven sealing solutions tailored to modern industrial needs
- While automation and regulatory focus are driving adoption, continuous upgrades in design, performance validation, and integration with evolving machinery are required to sustain long-term market growth. Manufacturers must innovate to meet the increasing complexity of automated systems. This includes creating seals that offer higher durability, longer lifespans, and compatibility with advanced system architectures
Restraint/Challenge
Fluctuating Raw Material Prices and High Production Costs
- The high cost of key raw materials such as synthetic rubber, fluoropolymers, and specialized metals creates pricing challenges for manufacturers, particularly small and mid-sized suppliers. Volatility in crude oil prices directly impacts elastomer availability, affecting material planning and cost stability. These fluctuations often force producers to adjust pricing structures, impacting market competitiveness
- Many industries face limitations in adopting advanced sealing solutions due to high production costs and the need for precision manufacturing technologies. The requirement for specialized machinery and skilled labor further elevates production expenses. This restricts adoption in cost-sensitive sectors, where traditional low-cost alternatives continue to dominate despite performance limitations
- Supply chain disruptions and inconsistent availability of raw materials pose challenges to timely production and delivery, often leading to reliance on lower-grade alternatives with reduced performance. Transportation delays, global sourcing constraints, and material shortages contribute to prolonged lead times. These issues ultimately impact end-users who depend on consistent sealing performance for operational continuity
- For instance, several manufacturers reported production delays due to shortages in high-grade elastomers, affecting supply timelines for automotive and machinery applications. These shortages impacted OEM schedules and aftermarket availability, creating bottlenecks across supply chains. Such incidents highlight the importance of robust sourcing strategies and diversified material procurement
- While technology advancements are improving manufacturing efficiency, addressing cost barriers and securing stable supply chains remains critical. Manufacturers must invest in cost-optimized production frameworks and advanced material engineering. Localized sourcing, recyclable materials, and scalable manufacturing models will play a central role in overcoming long-term supply and cost challenges
North America Gaskets and Seals Market Scope
The market is segmented on the basis of type, application, distribution channel, and industry.
- By Type
On the basis of type, the North America gaskets and seals market is segmented into gaskets and seals. The seals segment held the largest market revenue share in 2025 driven by their extensive usage in rotating equipment such as pumps, compressors, and engines across manufacturing and automotive industries. Their ability to provide reliable leakage control in high-pressure and high-temperature systems makes them essential in industrial operations.
The gaskets segment is expected to witness the fastest growth rate from 2026 to 2033, supported by increasing demand in pipeline systems, heat exchangers, and process equipment. The rising focus on equipment efficiency, maintenance reduction, and improved sealing performance is further accelerating the adoption of advanced gasket materials across diverse industrial environments.
- By Application
On the basis of application, the North America gaskets and seals market is segmented into heat exchangers, pressure vessels, manhole covers, handhole, valve bonnets, pipe flanges, and others. The pipe flanges segment held the largest market revenue share in 2025 owing to their widespread deployment in oil and gas, petrochemical, and water treatment infrastructure. Their critical role in ensuring secure and leak-proof connections across pipelines drives consistent demand.
The heat exchangers segment is expected to witness the fastest growth rate from 2026 to 2033, driven by industrial expansion, growth in chemical processing, and rising energy efficiency requirements. Increasing investments in HVAC systems, power plants, and manufacturing facilities are further contributing to the accelerated adoption of sealing solutions in heat exchanger assemblies.
- By Distribution Channel
On the basis of distribution channel, the North America gaskets and seals market is segmented into OEMs and aftermarket. The OEM segment held the largest market revenue share in 2025 due to the growing production of industrial machinery, automotive components, and heavy equipment in the region. Manufacturers increasingly integrate high-quality sealing components during initial assembly to enhance equipment reliability and lifespan.
The aftermarket segment is expected to witness the fastest growth rate from 2026 to 2033, supported by rising maintenance activities, machinery refurbishment, and replacement of worn-out sealing components. The growing emphasis on preventive maintenance and cost-effective operational performance across industries is further boosting aftermarket demand.
- By Industry
On the basis of industry, the North America gaskets and seals market is segmented into paper and pulp industry, oil and gas, electrical, automotive, aerospace, industrial manufacturing, marine and rail, and others. The automotive segment held the largest market revenue share in 2025 owing to the region’s strong vehicle production base and the widespread use of sealing solutions in engines, transmissions, braking systems, and thermal management units.
The industrial manufacturing segment is expected to witness the fastest growth rate from 2026 to 2033, driven by rapid industrialization, expansion of production facilities, and rising adoption of automated machinery. Industries are increasingly investing in durable sealing components to enhance safety, minimize downtime, and achieve higher operational efficiency across complex manufacturing environments.
North America Gaskets and Seals Market Regional Analysis
- U.S. gaskets and seals market captured the largest revenue share in 2025 within North America, driven by strong industrial infrastructure, high investment in equipment modernization, and increasing demand for reliable sealing in critical applications
- Industries are prioritizing high-performance sealing components to minimize downtime, enhance safety, and improve asset longevity
- The widespread use of advanced machinery across automotive, oil and gas, aerospace, and manufacturing sectors further supports market dominance, solidifying the U.S. as the leading country in the region
Canada Gaskets and Seals Market Insight
Canada is expected to witness the fastest growth in the North American gaskets and seals market from 2026 to 2033, supported by expanding industrial manufacturing, investments in energy projects, and rising adoption of automation technologies. The growing focus on improving operational efficiency, ensuring leak-proof systems, and complying with safety standards is accelerating demand for advanced sealing solutions. Increasing modernization of equipment across industrial facilities is further contributing to Canada’s strong growth trajectory in the market.
North America Gaskets and Seals Market Share
The North America gaskets and seals industry is primarily led by well-established companies, including:
• Parker Hannifin (U.S.)
• Garlock Sealing Technologies (U.S.)
• Dana Incorporated (U.S.)
• Flexitallic Group (U.S.)
• Lamons Gasket Company (U.S.)
• Stockwell Elastomerics (U.S.)
• American Seal & Packing (U.S.)
• Triangle Fluid Controls (Canada)
• Technetics Group (U.S.)
SKU-

- Interactive Data Analysis Dashboard
- Company Analysis Dashboard for high growth potential opportunities
- Research Analyst Access for customization & queries
- Competitor Analysis with Interactive dashboard
- Latest News, Updates & Trend analysis
- Harness the Power of Benchmark Analysis for Comprehensive Competitor Tracking
North America Gaskets And Seals Market, Supply Chain Analysis and Ecosystem Framework
To support market growth and help clients navigate the impact of geopolitical shifts, DBMR has integrated in-depth supply chain analysis into its North America Gaskets And Seals Market research reports. This addition empowers clients to respond effectively to global changes affecting their industries. The supply chain analysis section includes detailed insights such as North America Gaskets And Seals Market consumption and production by country, price trend analysis, the impact of tariffs and geopolitical developments, and import and export trends by country and HSN code. It also highlights major suppliers with data on production capacity and company profiles, as well as key importers and exporters. In addition to research, DBMR offers specialized supply chain consulting services backed by over a decade of experience, providing solutions like supplier discovery, supplier risk assessment, price trend analysis, impact evaluation of inflation and trade route changes, and comprehensive market trend analysis.
Data collection and base year analysis are done using data collection modules with large sample sizes. The stage includes obtaining market information or related data through various sources and strategies. It includes examining and planning all the data acquired from the past in advance. It likewise envelops the examination of information inconsistencies seen across different information sources. The market data is analysed and estimated using market statistical and coherent models. Also, market share analysis and key trend analysis are the major success factors in the market report. To know more, please request an analyst call or drop down your inquiry.
The key research methodology used by DBMR research team is data triangulation which involves data mining, analysis of the impact of data variables on the market and primary (industry expert) validation. Data models include Vendor Positioning Grid, Market Time Line Analysis, Market Overview and Guide, Company Positioning Grid, Patent Analysis, Pricing Analysis, Company Market Share Analysis, Standards of Measurement, Global versus Regional and Vendor Share Analysis. To know more about the research methodology, drop in an inquiry to speak to our industry experts.
Data Bridge Market Research is a leader in advanced formative research. We take pride in servicing our existing and new customers with data and analysis that match and suits their goal. The report can be customized to include price trend analysis of target brands understanding the market for additional countries (ask for the list of countries), clinical trial results data, literature review, refurbished market and product base analysis. Market analysis of target competitors can be analyzed from technology-based analysis to market portfolio strategies. We can add as many competitors that you require data about in the format and data style you are looking for. Our team of analysts can also provide you data in crude raw excel files pivot tables (Fact book) or can assist you in creating presentations from the data sets available in the report.


