
North America Genetic Testing Market
Market Size in USD Billion
 USD
5,688.94 Billion
USD
17,887.74 Billion
2021
2029
USD
5,688.94 Billion
USD
17,887.74 Billion
2021
2029
| 2022 - 2029 | |
| USD 5,688.94 Billion | |
| USD 17,887.74 Billion | |
| % | |
Market Analysis and Insights
North America genetic testing market is driven by the factors such as the high prevalence of genetic disorders, growing technological advancements in the genetic testing market which enhance its demand, as well as increasing investment in research and development, which leads to market growth. Currently, healthcare expenditure has increased across developed and emerging countries which is expected to create a competitive advantage for manufacturers to develop new and innovative genetic testing markets. However, the high cost associated with genetic testing and stringent regulatory frameworks for genetic testing.
North America genetic testing market report provides details of market share, new developments, and product pipeline analysis, the impact of domestic and localized market players, analyses opportunities in terms of emerging revenue pockets, changes in market regulations, product approvals, strategic decisions, product launches, geographic expansions, and technological innovations in the market. To understand the analysis and the market scenario contact us for an analyst brief, our team will help you create a revenue impact solution to achieve your desired goal. The scalability and business expansion of the retail units in the developing countries of various region and partnership with suppliers for safe distribution of machine and drugs products are the major drivers which propelled the demand of the market in the forecast period.
Market Definition
Genetic testing is a kind of medical test that identifies changes in genes, chromosomes, or proteins. The outcome of a genetic test can confirm or rule out a suspected genetic condition or aid in determining a person’s chance of developing or passing on a genetic disorder. Over 77,000 genetic tests are currently in use, and others are being developed.
The increasing innovations and technologies and rising number of players in the market, and novel product launches are also propelling the growth of the North America genetic testing market.
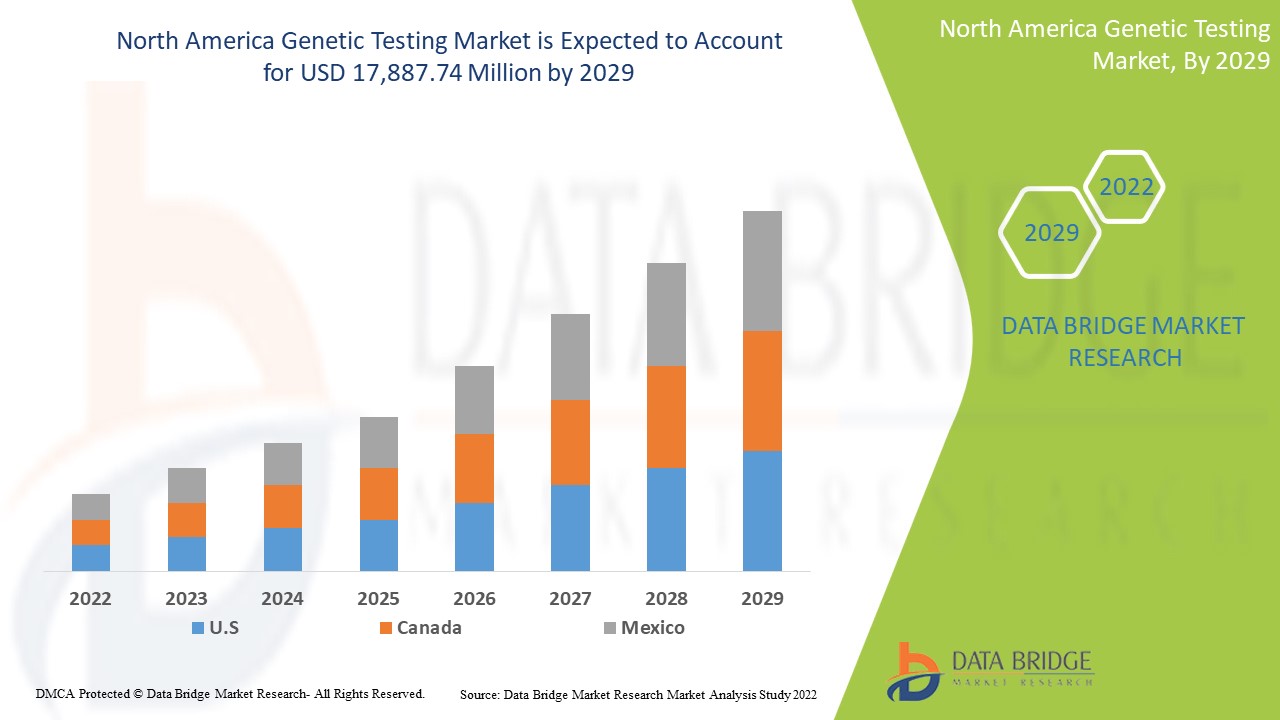
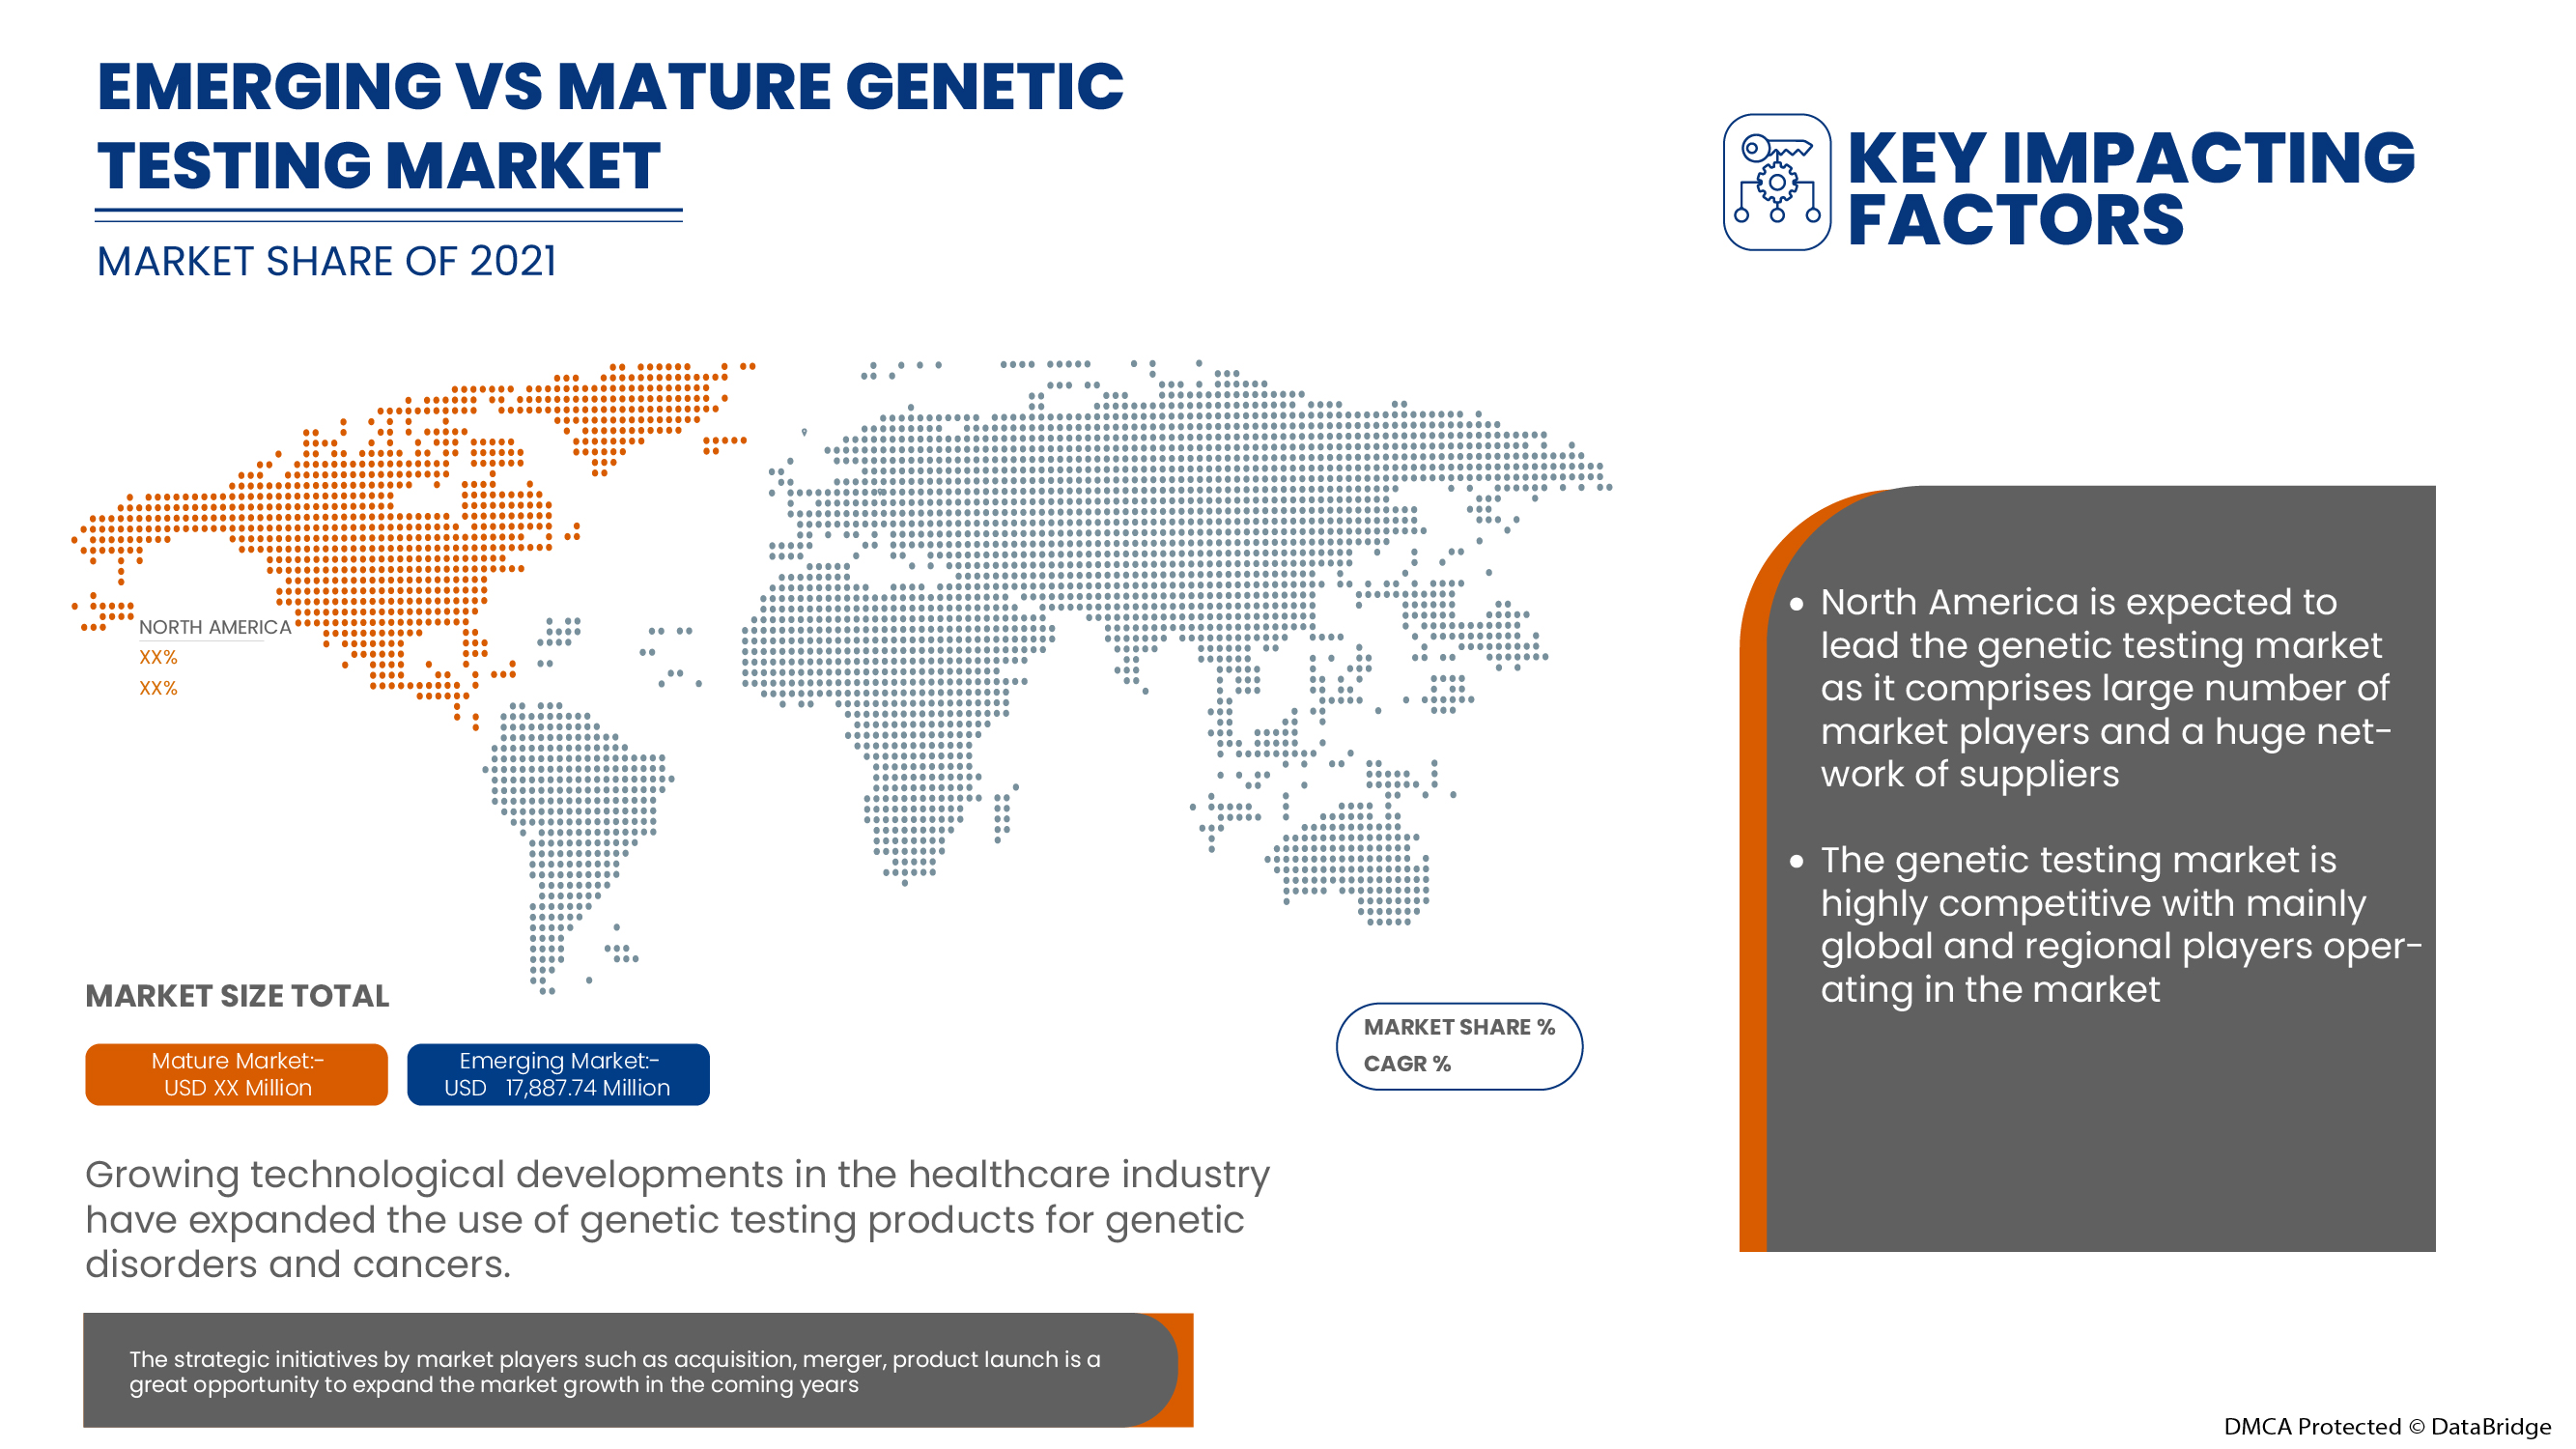
North America genetic testing market is expected to gain market growth in the forecast period of 2022 to 2029. Data Bridge Market Research analyses that the market is growing with a CAGR of 15.6% in the forecast period of 2022 to 2029 and is expected to reach USD 17,887.74 million by 2029 from USD 5,688.94 million in 2021.
|
Report Metric |
Details |
|
Forecast Period |
2022 to 2029 |
|
Base Year |
2021 |
|
Historic Years |
2020 |
|
Quantitative Units |
Revenue in USD Million |
|
Segments Covered |
By Type (Carrier Testing, Diagnostic Testing, Prenatal Testing, New Born Screening, Predictive And Presymptomatic Testing, Other Types), Technology (DNA Sequencing (NGS-Based Testing), Polymerase Chain Reaction, Microarrays, Whole Genome Sequencing, Fluorescence In Situ Hybridization (FISH), Others), Diseases (Rare Genetic Disorder, Cancer, Cystic Fibrosis, Sickle Cell Anemia, Duchenne Muscular Dystrophy, Thalassemia, Huntington’s Disease, Fragile X Syndrome, Duchenne Muscular Dystrophy, Others) End User (Hospitals, Clinics, Diagnostic Centres, Private Clinics, Laboratory Service Providers, Private Laboratories) |
|
Countries Covered |
U.S., Canada, Mexico |
|
Market Players Covered |
Thermo Fisher Scientific Inc., Invitae Corporation, Bio-Rad Laboratories, Inc., PerkinElmer Inc., Illumina, Inc., QIAGEN, F. Hoffmann-La Roche Ltd., Fulgent Genetics, Myriad Genetics, Inc., Abbott, Eurofins Scientific, Sorenson Genomics, Biocartis, Cepheid ( A subsidiary of Danaher), PacBio, Otogenetics, BioReference, Sema4 OpCo, Inc., Natera, Inc. among others |
North America Genetic Testing Market Dynamics
Drivers
-
Growing Prevalence Of Genetic Diseases
Genetic disorders may cause such severe health problems that they are incompatible with life. In the most severe cases, these conditions may cause a miscarriage of an affected embryo or fetus. The rising prevalence of genetic diseases and birth defects boosts the demand for genetic testing
As per the article, Genetic disorders and congenital abnormalities: strategies for reducing the burden in the Region, 2022,
-
Genetic disorders and congenital abnormalities occur in about 2%-5% of all live births, which accounts for up to 30% of pediatric hospital admissions and cause about 50% of childhood deaths in industrialized countries
Therefore, this is raising the demand for genetic testing market.
-
Increase In The Adoption Of Next Generation Sequencing
As genomics-focused pharmacology continues to play a greater role in the treatment of various chronic diseases, especially cancer, next-generation sequencing (NGS) is evolving as a powerful tool for providing a deeper and more precise insight into the molecular underpinnings of individual tumors and specific receptors.
NGS offers advantages in accuracy, sensitivity, and speed compared to traditional methods that have the potential to make a significant impact on the field of oncology. Because NGS can assess multiple genes in a single assay, the need to order multiple tests to identify the causative mutation is eliminated.
For instance,
-
NGS has been also explored for comprehensive profiling of pharmacogenetics with relevance to drug Pharmacokinetics and Pharmacodynamics, initial reports of 2017 suggest that this technology may represent a reliable and efficient tool to discover both common and rare genetic variations in these genes.
Thus, this is expected to act as a driver for the growth of the genetic testing market.
Opportunities
-
Rising Disposable Income
The expense of money used by a country on its healthcare and its growth rate over time is inclined by a wide variety of economic and social factors including the financing arrangements and structure of the organization of the health system. In particular, there is a strong association between the complete income level of a country and how much the population of that country spends on health care.
Also, the strategic initiatives taken by key market players will provide structural integrity and future opportunities for the genetic testing market in the forecast period of 2022-2029.
Restraints/Challenges
- High Cost Of Genetic Testing
Genetic testing can be expensive and may not be covered by some health insurance plans. The numerous genetic tests differ in costs as per the targeted disease for which it is tested.
According to Breastcancer.org, the cost of genetic testing for cancer can vary greatly and can be between $300 and $5,000. How much genetic testing costs can depend on the type of test as well as how complex it is.
Genetic testing can cost anywhere from $100 to more than $2,000, depending on the test's nature and complexity. If more than one test is required or numerous family members must be tested to acquire a significant result, the expense rises. The cost of neonatal screening varies by state.
Covid-19 Impact on the North America Genetic Testing Market
The COVID-19 has positively affected the market as many genetic and serological tests were conducted for COVID-19 which raises the demand for genetic testing during this period.
Recent Development
- In December 2021, Thermo Fisher Scientific Inc., announced that it has completed its acquisition of PPD, Inc., a leading global provider of clinical research services to the biopharma and biotech industry, for $17.4 billion. This acquisition helped to generate more revenue and boosted the market growth.
North America Genetic Testing Market Scope
North America genetic testing market is segmented into type, technology, diseases and end user. The growth amongst these segments will help you analyse meagre growth segments in the industries and provide the users with a valuable market overview and market insights to make strategic decisions to identify core market applications.
Type
- Diagnostic Testing
- Prenatal Testing
- New Born Screening
- Predictive and Presymptomatic Testing
- Carrier Testing
- Other Types
On the basis of type, the North America genetic testing market is segmented into diagnostic testing, prenatal testing, new born screening, predictive and presymptomatic testing, carrier testing and other types.
Technology
- Polymerase Chain Reaction
- DNA Sequencing (NGS-Based Testing)
- Whole Genome Sequencing
- Microarrays
- Fluorescence In Situ Hybridization (FISH)
- Others
On the basis of technology, the North America genetic testing market is segmented into DNA sequencing (NGS-based testing), polymerase chain reaction, microarrays, whole genome sequencing, fluorescence in situ hybridization (FISH), others.
Diseases
- Cancer
- Sickle Cell Anemia
- Thalassemia
- Rare Genetic Disorder
- Fragile X Syndrome
- Duchenne Muscular Dystrophy
- Huntington's Disease
- Cystic Fibrosis
- Others
On the basis of diseases, the North America genetic testing market is segmented into rare genetic disorder, cancer, cystic fibrosis, sickle cell anemia, duchenne muscular dystrophy, thalassemia, huntington’s disease, fragile X syndrome, other.
End User
- Hospitals
- Clinics
- Diagnostic Centers
- Private Clinics
- Laboratory Service Providers
- Private Laboratories
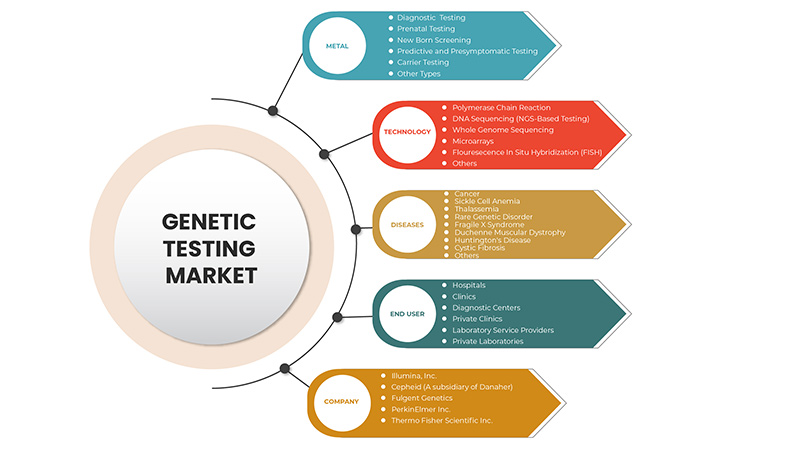
On the basis of end users, the North America genetic testing market is segmented into hospitals, clinics, diagnostic centers, private clinics, laboratory service providers, private laboratories.
Genetic Testing Market Regional Analysis/Insights
The genetic testing market is analysed and market size insights and trends are provided by country, type, technology, diseases and end user as referenced above.
The U.S. is the major dominating country in the market due to the growing prevalence of genetic disorders amongst the population in these countries. And they are dominating the genetic testing market in terms of market share and market revenue and will continue to flourish its dominance during the forecast period. This is due to genetic defects and chromosomal aberrations in the population in the regions and rapid research development is boosting the market.
The country section of the report also provides individual market impacting factors and changes in regulations in the market that impact the current and future trends of the market. Data points, such as new and replacement sales, country demographics, disease epidemiology, and import-export tariffs, are some of the major pointers used to forecast the market scenario for individual countries. In addition, the presence and availability of global brands and their challenges faced due to high competition from local and domestic brands, and impact of sales channels are considered while providing forecast analysis of the country data.
Competitive Landscape and Genetic Testing Market Share Analysis
The genetic testing market competitive landscape provides details about the competitors. Details included are company overview, company financials, revenue generated, market potential, investment in research and development, new market initiatives, global presence, production sites and facilities, production capacities, company strengths and weaknesses, product launch, product width and breadth, and application dominance. The above data points provided are only related to the companies' focus on the genetic testing market.
Some of the major players operating in the genetic testing market are Thermo Fisher Scientific Inc., Invitae Corporation, Bio-Rad Laboratories, Inc., PerkinElmer Inc., Illumina, Inc., QIAGEN, F. Hoffmann-La Roche Ltd., Fulgent Genetics, Myriad Genetics, Inc., Abbott, Eurofins Scientific, Sorenson Genomics, Biocartis, Cepheid (A subsidiary of Danaher), PacBio, Otogenetics, BioReference, Sema4 OpCo, Inc., Natera, Inc. among others
Research Methodology
Data collection and base year analysis are done using data collection modules with large sample sizes. The market data is analysed and estimated using market statistical and coherent models. In addition, market share analysis and key trend analysis are the major success factors in the market report. The key research methodology used by DBMR research team is data triangulation which involves data mining, analysis of the impact of data variables on the market, and primary (industry expert) validation. Apart from this, data models include Vendor Positioning Grid, Market Time Line Analysis, Market Overview and Guide, Company Positioning Grid, Company Market Share Analysis, Standards of Measurement, Global vs. Regional and Vendor Share Analysis. Please request analyst call in case of further inquiry.
SKU-

- Interactive Data Analysis Dashboard
- Company Analysis Dashboard for high growth potential opportunities
- Research Analyst Access for customization & queries
- Competitor Analysis with Interactive dashboard
- Latest News, Updates & Trend analysis
- Harness the Power of Benchmark Analysis for Comprehensive Competitor Tracking
Table of Content
1 INTRODUCTION
1.1 OBJECTIVES OF THE STUDY
1.2 MARKET DEFINITION
1.3 OVERVIEW OF THE NORTH AMERICA GENETIC TESTING MARKET
1.4 LIMITATIONS
1.5 MARKETS COVERED
2 MARKET SEGMENTATION
2.1 MARKETS COVERED
2.2 GEOGRAPHICAL SCOPE
2.3 YEARS CONSIDERED FOR THE STUDY
2.4 CURRENCY AND PRICING
2.5 DBMR TRIPOD DATA VALIDATION MODEL
2.6 MULTIVARIATE MODELLING
2.7 TYPE LIFELINE CURVE
2.8 PRIMARY INTERVIEWS WITH KEY OPINION LEADERS
2.9 DBMR MARKET POSITION GRID
2.1 MARKET APPLICATION COVERAGE GRID
2.11 VENDOR SHARE ANALYSIS
2.12 SECONDARY SOURCES
2.13 ASSUMPTIONS
3 EXECUTIVE SUMMARY
4 PREMIUM INSIGHTS
4.1 PESTEL ANALYSIS
4.2 PORTER’S FIVE FORCES
4.3 STRATEGIC INITIATIVES:
4.4 CONCLUSION:
4.5 INDUSTRY INSIGHTS
4.5.1 CANCER GENETICS RISK ASSESSMENT AND COUNSELING
4.5.2 GENETIC TESTS PRICING
4.5.3 KEY INSIGHTS
5 EPIDERMIOLOGY
6 NORTH AMERICA GENETIC TESTING MARKET: REGULATIONS
7 MARKET OVERVIEW
7.1 DRIVERS
7.1.1 GROWING PREVALENCE OF GENETIC DISORDERS
7.1.2 INCREASE IN THE ADOPTION OF NEXT GENERATION SEQUENCING
7.1.3 WIDE PRODUCT PORTFOLIO OFFERED BY A MAJOR PLAYER
7.1.4 INCREASE TREND TOWARD PERSONALIZED MEDICATION
7.2 RESTRAINTS
7.2.1 HIGH COST OF GENETIC TESTING
7.2.2 CYBER SECURITY CONCERNS IN GENOMICS
7.3 OPPORTUNITIES
7.3.1 STRATEGIC INITIATIVES BY THE KEY MARKET PLAYER
7.3.2 TECHNOLOGICAL ADVANCEMENT
7.3.3 INCREASING RESEARCH AND DEVELOPMENT
7.3.4 RISING DISPOSABLE INCOME
7.4 CHALLENGES
7.4.1 LACK OF SKILLED PROFESSIONALS TO PERFORM GENETIC TESTING
7.4.2 STRINGENT REGULATION POLICY
8 NORTH AMERICA GENETIC TESTING MARKET, BY TYPE
8.1 OVERVIEW
8.2 DIAGNOSTIC TESTING
8.3 PRENATAL TESTING
8.3.1 NON-INVASIVE SCREENING
8.3.1.1 BY SCREENING METHOD
8.3.1.1.1 WHOLE GENOME SEQUENCING
8.3.1.1.2 COUNTING OF cfDNA FRAGMENTS
8.3.1.1.3 OTHERS
8.3.1.2 BY CONDITION
8.3.1.2.1 TRISOMY 21
8.3.1.2.2 KLINEFELTER SYNDROME
8.3.1.2.3 JACOBS SYNDROME
8.3.1.2.4 CYSTIC FIBROSIS
8.3.1.2.5 TURNER SYNDROME
8.3.1.2.6 TRISOMY 18
8.3.1.2.7 HEMOPHILIA
8.3.1.2.8 TRISOMY 13
8.3.1.2.9 MICRODELETION SYNDROME
8.3.1.2.10 FETAL GENDER
8.3.1.2.11 OTHERS
8.3.1.3 BY SCREENING TYPE
8.3.1.3.1 CARRIER SEQUENCING
8.3.1.3.2 SEQUENTIAL SEQUENCING
8.3.2 MATERNAL SERUM QUAD SCREENING
8.4 NEW BORN SCREENING
8.4.1.1 SICKLE CELL DISEASE
8.4.1.2 CONGENITAL HYPOTHYROIDISM
8.4.1.3 PHENYLKETONURIA (PKU)
8.4.1.4 GALACTOSEMIA
8.4.1.5 MAPLE SYRUP URINE DISEASE
8.4.1.6 OTHERS
8.5 PREDICTIVE AND PRESYMPTOMATIC TESTING
8.6 CARRIER TESTING
8.6.1 BY TEST TYPE
8.6.1.1 MOLECULAR SCREENING TEST
8.6.1.2 BIOCHEMICAL SCREENING TEST
8.6.2 BY TYPE
8.6.2.1 EXPANDED CARRIER SCREENING
8.6.2.1.1 PREDESIGNED PANEL TESTING
8.6.2.1.2 CUSTOM-MADE PANEL TESTING
8.6.2.2 TARGETED DISEASE CARRIER SCREENING
8.6.2.2.1 BY MEDICAL CONDITION
8.6.2.2.2 HEMATOLOGICAL CONDITIONS
8.6.2.2.3 PULMONARY CONDITIONS
8.6.2.2.4 NEUROLOGICAL CONDITIONS
8.6.2.2.5 OTHER CONDITIONS
8.7 OTHER TYPES
9 NORTH AMERICA GENETIC TESTING MARKET, BY TECHNOLOGY
9.1 OVERVIEW
9.2 POLYMERASE CHAIN REACTION
9.2.1 REAL-TIME PCR (QPCR)
9.2.2 DIGITAL PCR (DPCR)
9.2.3 REVERSE TRANSCRIPTION PCR (RT-PCR)
9.2.4 HOT-START PCR
9.2.5 MULTIPLEX PCR
9.2.6 OTHER PCR
9.3 DNA SEQUENCING (NGS-BASED TESTING)
9.3.1 NEXT GENERATION SEQUENCING (NGS)
9.3.2 SANGER SEQUENCING (SINGLE GENE)
9.3.3 OTHER
9.4 WHOLE GENOME SEQUENCING
9.5 MICROARRAYS
9.5.1 DNA MICROARRAYS
9.5.2 PROTEIN MICROARRAYS
9.5.3 OTHER MICROARRAYS
9.6 FLUORESCENCE IN SITU HYBRIDIZATION (FISH)
9.7 OTHERS
10 NORTH AMERICA GENETIC TESTING MARKET, BY DISEASES
10.1 OVERVIEW
10.2 CANCER
10.2.1 BREAST
10.2.2 COLON
10.2.3 LUNG
10.2.4 PROSTATE
10.2.5 OTHERS
10.3 SICKLE CELL ANEMIA
10.4 THALASSEMIA
10.5 RARE GENETIC DISORDER
10.5.1 TRISOMY 21
10.5.2 MONOSOMY X
10.5.3 TRISOMY 13
10.5.4 MICRODELETION SYNDROME
10.5.5 TRISOMY 18
10.5.6 OTHERS
10.6 FRAGILE X SYNDROME
10.7 DUCHENNE MUSCULAR DYSTROPHY
10.8 HUNTINGTON'S DISEASE
10.9 CYSTIC FIBROSIS
10.1 OTHERS
11 NORTH AMERICA GENETIC TESTING MARKET, BY END USER
11.1 OVERVIEW
11.2 HOSPITALS
11.3 CLINICS
11.4 DIAGNOSTIC CENTERS
11.5 PRIVATE CLINICS
11.6 LABORATORY SERVICE PROVIDERS
11.7 PRIVATE LABORATORIES
12 NORTH AMERICA GENETIC TESTING MARKET, BY REGION
12.1 NORTH AMERICA
12.1.1 U.S.
12.1.2 CANADA
12.1.3 MEXICO
13 NORTH AMERICA GENETIC TESTING MARKET, COMPANY LANDSCAPE
13.1 COMPANY SHARE ANALYSIS: NORTH AMERICA
14 SWOT ANALYSIS
15 COMPANY PROFILE
15.1 ILLUMINA, INC.
15.1.1 COMPANY SNAPSHOT
15.1.2 COMPANY SHARE ANALYSIS
15.1.3 PRODUCT PORTFOLIO
15.1.4 RECENT DEVELOPMENT
15.1.4.1 ACQUISITION
15.1.4.2 COLLABORATION
15.2 CEPHEID
15.2.1 COMPANY SNAPSHOT
15.2.2 REVENUE ANALYSIS
15.2.3 COMPANY SHARE ANALYSIS
15.2.4 PRODUCT PORTFOLIO
15.2.5 RECENT DEVELOPMENT
15.2.5.1 BUSINEES EXPANSION
15.3 FULGENT GENETICS
15.3.1 COMPANY SNAPSHOT
15.3.2 REVENUE ANALYSIS
15.3.3 COMPANY SHARE ANALYSIS
15.3.4 PRODUCT PORTFOLIO
15.3.5 RECENT DEVELOPMENT
15.3.5.1 ACQUISITION
15.4 PERKINELMER INC.
15.4.1 COMPANY SNAPSHOT
15.4.2 REVENUE ANALYSIS
15.4.3 COMPANY SHARE ANALYSIS
15.4.4 PRODUCT PORTFOLIO
15.4.5 RECENT DEVELOPMENT
15.4.5.1 PRODUCT LAUNCH
15.5 THERMO FISHER SCIENTIFIC INC.
15.5.1 COMPANY SNAPSHOT
15.5.2 REVENUE ANALYSIS
15.5.3 COMPANY SHARE ANALYSIS
15.5.4 PRODUCT PORTFOLIO
15.5.5 RECENT DEVELOPMENT
15.5.5.1 COLLABORATION
15.6 ABBOTT
15.6.1 COMPANY SNAPSHOT
15.6.2 REVENUE ANALYSIS
15.6.3 PRODUCT PORTFOLIO
15.6.4 RECENT DEVELOPMENT
15.7 BIOCARTIS
15.7.1 COMPANY SNAPSHOT
15.7.2 REVENUE ANALYSIS
15.7.3 PRODUCT PORTFOLIO
15.7.4 RECENT DEVELOPMENT
15.7.4.1 PARTNERSHIP
15.7.4.2 AGREEMENT
15.8 BIO-HELIX
15.8.1 COMPANY SNAPSHOT
15.8.2 PRODUCT PORTFOLIO
15.8.3 RECENT DEVELOPMENT
15.9 BIO-RAD LABORATORIES, INC.
15.9.1 COMPANY SNAPSHOT
15.9.2 REVENUE ANALYSIS
15.9.3 PRODUCT PORTFOLIO
15.9.4 RECENT DEVELOPMENTS
15.9.4.1 ACQUISITION
15.9.4.2 PARTNERSHIP
15.1 BIOREFERENCE
15.10.1 COMPANY SNAPSHOT
15.10.2 REVENUE ANALYSIS
15.10.3 PRODUCT PORTFOLIO
15.10.4 RECENT DEVELOPMENT
15.10.4.1 ACQUISITION
15.11 ELITECHGROUP
15.11.1 COMPANY SNAPSHOT
15.11.2 PRODUCT PORTFOLIO
15.11.3 RECENT DEVELOPMENTS
15.11.3.1 PRODUCT LAUNCH
15.11.3.2 BUSINESS EXPANSION
15.12 EUROFINS SCIENTIFIC
15.12.1 COMPANY SNAPSHOT
15.12.2 REVENUE ANALYSIS
15.12.3 PRODUCT PORTFOLIO
15.12.4 RECENT DEVELOPMENT
15.12.4.1 PRODUCT LAUNCH
15.13 EUGENE LABS
15.13.1 COMPANY SNAPSHOT
15.13.2 PRODUCT PORTFOLIO
15.13.3 RECENT DEVELOPMENT
15.14 F. HOFFMANN-LA ROCHE LTD)
15.14.1 COMPANY SNAPSHOT
15.14.2 REVENUE ANALYSIS (PARENT COMPANY)
15.14.3 PRODUCT PORTFOLIO
15.14.4 RECENT DEVELOPMENTS
15.14.4.1 PRODUCT LAUNCH
15.15 GENES2ME
15.15.1 COMPANY SNAPSHOT
15.15.2 PRODUCT PORTFOLIO
15.15.3 RECENT DEVELOPMENT
15.16 INVITAE CORPORATION
15.16.1 COMPANY SNAPSHOT
15.16.2 REVENUE ANALYSIS
15.16.3 PRODUCT PORTFOLIO
15.16.4 RECENT DEVELOPMENTS
15.17 MAPMYGENOME
15.17.1 COMPANY SNAPSHOT
15.17.2 PRODUCT PORTFOLIO
15.17.3 RECENT DEVELOPMENT
15.18 MEDGENOME
15.18.1 COMPANY SNAPSHOT
15.18.2 PRODUCT PORTFOLIO
15.18.3 RECENT DEVELOPMENT
15.19 MYRIAD GENETICS
15.19.1 COMPANY SNAPSHOT
15.19.2 REVENUE ANALYSIS
15.19.3 PRODUCT PORTFOLIO
15.19.4 RECENT DEVELOPMENT
15.2 NATERA, INC.
15.20.1 COMPANY SNAPSHOT
15.20.2 PRODUCT PORTFOLIO
15.20.3 RECENT DEVELOPMENT
15.20.3.1 PARTNERSHIP
15.21 OTOGENRTICS
15.21.1 COMPANY SNAPSHOT
15.21.2 PRODUCT PORTFOLIO
15.21.3 RECENT DEVELOPMENT
15.22 PACBIO
15.22.1 COMPANY SNAPSHOT
15.22.2 REVENUE ANALYSIS
15.22.3 PRODUCT PORTFOLIO
15.22.4 RECENT DEVELOPMENT
15.23 QIAGEN
15.23.1 COMPANY SNAPSHOT
15.23.2 PRODUCT PORTFOLIO
15.23.3 RECENT DEVELOPMENTS
15.23.3.1 PARTNERSHIP
15.23.3.2 PRODUCT LAUNCH
15.24 SEMA4 OPCO, INC.
15.24.1 COMPANY SNAPSHOT
15.24.2 REVENUE ANALYSIS
15.24.3 PRODUCT PORTFOLIO
15.24.4 RECENT DEVELOPMENT
15.25 SORENSON GENOMICS
15.25.1 COMPANY SNAPSHOT
15.25.2 PRODUCT PORTFOLIO
15.25.3 RECENT DEVELOPMENT
16 QUESTIONNAIRE
17 RELATED REPORTS
List of Table
TABLE 1 NORTH AMERICA GENETIC TESTING MARKET, BY TYPE, 2020-2029 (USD MILLION)
TABLE 2 NORTH AMERICA GENETIC TESTING MARKET, BY TYPE, 2020-2029 (UNITS)
TABLE 3 NORTH AMERICA GENETIC TESTING MARKET, BY TYPE, 2020-2029 (ASP)
TABLE 4 NORTH AMERICA DIAGNOSTIC TESTING IN GENETIC TESTING MARKET, BY REGION, 2020-2029 (USD MILLION)
TABLE 5 NORTH AMERICA PRENATAL TESTING IN GENETIC TESTING MARKET, BY REGION, 2020-2029 (USD MILLION)
TABLE 6 NORTH AMERICA PRENATAL TESTING IN GENETIC TESTING MARKET, BY TYPE, 2020-2029 (USD MILLION)
TABLE 7 NORTH AMERICA PRENATAL TESTING IN GENETIC TESTING MARKET, BY TYPE, 2020-2029 (UNITS)
TABLE 8 NORTH AMERICA PRENATAL TESTING IN GENETIC TESTING MARKET, BY TYPE, 2020-2029 (ASP)
TABLE 9 NORTH AMERICA NON-INVASIVE SCREENING IN GENETIC TESTING MARKET, BY SCREENING METHOD, 2020-2029 (USD MILLION)
TABLE 10 NORTH AMERICA NON-INVASIVE SCREENING IN GENETIC TESTING MARKET, BY SCREENING METHOD, 2020-2029 (UNITS)
TABLE 11 NORTH AMERICA NON-INVASIVE SCREENING IN GENETIC TESTING MARKET, BY SCREENING METHOD, 2020-2029 (ASP)
TABLE 12 NORTH AMERICA NON-INVASIVE SCREENING IN GENETIC TESTING MARKET, BY CONDITION, 2020-2029 (USD MILLION)
TABLE 13 NORTH AMERICA NON-INVASIVE SCREENING IN GENETIC TESTING MARKET, BY SCREENING TYPE, 2020-2029 (USD MILLION)
TABLE 14 NORTH AMERICA NON-INVASIVE SCREENING IN GENETIC TESTING MARKET, BY SCREENING TYPE, 2020-2029 (UNITS)
TABLE 15 NORTH AMERICA NON-INVASIVE SCREENING IN GENETIC TESTING MARKET, BY SCREENING TYPE, 2020-2029 (ASP)
TABLE 16 NORTH AMERICA NEW BORN SCREENING IN GENETIC TESTING MARKET, BY REGION, 2020-2029 (USD MILLION)
TABLE 17 NORTH AMERICA NEW-BORN SCREENING IN GENETIC TESTING MARKET, BY TYPE, 2020-2029 (USD MILLION)
TABLE 18 NORTH AMERICA PREDICTIVE AND PRESYMPTOMATIC TESTING IN GENETIC TESTING MARKET, BY REGION, 2020-2029 (USD MILLION)
TABLE 19 NORTH AMERICA CARRIER TESTING IN GENETIC TESTING MARKET, BY REGION, 2020-2029 (USD MILLION)
TABLE 20 NORTH AMERICA CARRIER TESTING IN GENETIC TESTING MARKET, BY TEST TYPE, 2020-2029 (USD MILLION)
TABLE 21 NORTH AMERICA CARRIER TESTING IN GENETIC TESTING MARKET, BY TEST TYPE, 2020-2029 (UNITS)
TABLE 22 NORTH AMERICA CARRIER TESTING IN GENETIC TESTING MARKET, BY TEST TYPE, 2020-2029 (ASP)
TABLE 23 NORTH AMERICA CARRIER TESTING IN GENETIC TESTING MARKET, BY TYPE, 2020-2029 (USD MILLION)
TABLE 24 NORTH AMERICA CARRIER TESTING IN GENETIC TESTING MARKET, BY TYPE, 2020-2029 (UNITS)
TABLE 25 NORTH AMERICA CARRIER TESTING IN GENETIC TESTING MARKET, BY TYPE, 2020-2029 (ASP)
TABLE 26 NORTH AMERICA EXPANDED CARRIER SCREENING IN GENETIC TESTING MARKET, BY TYPE, 2020-2029 (USD MILLION)
TABLE 27 NORTH AMERICA EXPANDED CARRIER SCREENING IN GENETIC TESTING MARKET, BY TYPE, 2020-2029 (UNITS)
TABLE 28 NORTH AMERICA EXPANDED CARRIER SCREENING IN GENETIC TESTING MARKET, BY TYPE, 2020-2029 (ASP)
TABLE 29 NORTH AMERICA CARRIER TESTING IN GENETIC TESTING MARKET, BY MEDICAL CONDITION, 2020-2029 (USD MILLION)
TABLE 30 NORTH AMERICA OTHER TYPES IN GENETIC TESTING MARKET, BY REGION, 2020-2029 (USD MILLION)
TABLE 31 NORTH AMERICA GENETIC TESTING MARKET, BY TECHNOLOGY, 2020-2029 (USD MILLION)
TABLE 32 NORTH AMERICA POLYMERASE CHAIN REACTION IN GENETIC TESTING MARKET, BY REGION, 2020-2029 (USD MILLION)
TABLE 33 NORTH AMERICA POLYMERASE CHAIN REACTION IN GENETIC TESTING MARKET, BY TECHNOLOGY, 2020-2029 (USD MILLION)
TABLE 34 NORTH AMERICA DNA SEQUENCING (NGS-BASED TESTING) IN GENETIC TESTING MARKET, BY REGION, 2020-2029 (USD MILLION)
TABLE 35 NORTH AMERICA DNA SEQUENCING (NGS-BASED TESTING) IN GENETIC TESTING MARKET, BY TECHNOLOGY, 2020-2029 (USD MILLION)
TABLE 36 NORTH AMERICA WHOLE GENOME SEQUENCING IN GENETIC TESTING MARKET, BY REGION, 2020-2029 (USD MILLION)
TABLE 37 NORTH AMERICA MICROARRAYS IN GENETIC TESTING MARKET, BY REGION, 2020-2029 (USD MILLION)
TABLE 38 NORTH AMERICA MICROARRAYS IN GENETIC TESTING MARKET, BY TECHNOLOGY, 2020-2029 (USD MILLION)
TABLE 39 NORTH AMERICA FLUORESCENCE IN SITU HYBRIDIZATION (FISH) IN GENETIC TESTING MARKET, BY REGION, 2020-2029 (USD MILLION)
TABLE 40 NORTH AMERICA OTHERS IN GENETIC TESTING MARKET, BY REGION, 2020-2029 (USD MILLION)
TABLE 41 NORTH AMERICA GENETIC TESTING MARKET, BY DISEASES, 2020-2029 (USD MILLION)
TABLE 42 NORTH AMERICA CANCER IN GENETIC TESTING MARKET, BY REGION, 2020-2029 (USD MILLION)
TABLE 43 NORTH AMERICA CANCER IN GENETIC TESTING MARKET, BY DISEASES, 2020-2029 (USD MILLION)
TABLE 44 NORTH AMERICA SICKLE CELL ANEMIA IN GENETIC TESTING MARKET, BY REGION, 2020-2029 (USD MILLION)
TABLE 45 NORTH AMERICA THALASSEMIA IN GENETIC TESTING MARKET, BY REGION, 2020-2029 (USD MILLION)
TABLE 46 NORTH AMERICA RARE GENETIC DISORDER IN GENETIC TESTING MARKET, BY REGION, 2020-2029 (USD MILLION)
TABLE 47 NORTH AMERICA RARE GENETIC DISORDER IN GENETIC TESTING MARKET, BY DISEASES, 2020-2029 (USD MILLION)
TABLE 48 NORTH AMERICA FRAGILE X SYNDROME IN GENETIC TESTING MARKET, BY REGION, 2020-2029 (USD MILLION)
TABLE 49 NORTH AMERICA DUCHENNE MUSCULAR DYSTROPHY IN GENETIC TESTING MARKET, BY REGION, 2020-2029 (USD MILLION)
TABLE 50 NORTH AMERICA HUNTINGTON'S DISEASE IN GENETIC TESTING MARKET, BY REGION, 2020-2029 (USD MILLION)
TABLE 51 NORTH AMERICA CYSTIC FIBROSIS IN GENETIC TESTING MARKET, BY REGION, 2020-2029 (USD MILLION)
TABLE 52 NORTH AMERICA OTHERS IN GENETIC TESTING MARKET, BY REGION, 2020-2029 (USD MILLION)
TABLE 53 NORTH AMERICA GENETIC TESTING MARKET, BY END USER, 2020-2029 (USD MILLION)
TABLE 54 NORTH AMERICA HOSPITALS IN GENETIC TESTING MARKET, BY REGION, 2020-2029 (USD MILLION)
TABLE 55 NORTH AMERICA CLINICS IN GENETIC TESTING MARKET, BY REGION, 2020-2029 (USD MILLION)
TABLE 56 NORTH AMERICA DIAGNOSTIC CENTERS IN GENETIC TESTING MARKET, BY REGION, 2020-2029 (USD MILLION)
TABLE 57 NORTH AMERICA PRIVATE CLINICS IN GENETIC TESTING MARKET, BY REGION, 2020-2029 (USD MILLION)
TABLE 58 NORTH AMERICA LABORATORY SERVICE PROVIDERS IN GENETIC TESTING MARKET, BY REGION, 2020-2029 (USD MILLION)
TABLE 59 NORTH AMERICA PRIVATE LABORATORIES IN GENETIC TESTING MARKET, BY REGION, 2020-2029 (USD MILLION)
TABLE 60 NORTH AMERICA GENETIC TESTING MARKET, BY COUNTRY, 2020-2029 (USD MILLION)
TABLE 61 NORTH AMERICA GENETIC TESTING MARKET, BY TYPE, 2020-2029 (USD MILLION)
TABLE 62 NORTH AMERICA GENETIC TESTING MARKET, BY TYPE, 2020-2029 (UNITS)
TABLE 63 NORTH AMERICA GENETIC TESTING MARKET, BY TYPE, 2020-2029 (ASP)
TABLE 64 NORTH AMERICA PRENATAL TESTING IN GENETIC TESTING MARKET, BY TYPE, 2020-2029 (USD MILLION)
TABLE 65 NORTH AMERICA PRENATAL TESTING IN GENETIC TESTING MARKET, BY TYPE, 2020-2029 (UNITS)
TABLE 66 NORTH AMERICA PRENATAL TESTING IN GENETIC TESTING MARKET, BY TYPE, 2020-2029 (ASP)
TABLE 67 NORTH AMERICA NON-INVASIVE SCREENING IN GENETIC TESTING MARKET, BY SCREENING METHOD, 2020-2029 (USD MILLION)
TABLE 68 NORTH AMERICA NON-INVASIVE SCREENING IN GENETIC TESTING MARKET, BY SCREENING METHOD, 2020-2029 (UNITS)
TABLE 69 NORTH AMERICA NON-INVASIVE SCREENING IN GENETIC TESTING MARKET, BY SCREENING METHOD, 2020-2029 (ASP)
TABLE 70 NORTH AMERICA NON-INVASIVE SCREENING IN GENETIC TESTING MARKET, BY CONDITION, 2020-2029 (USD MILLION)
TABLE 71 NORTH AMERICA NON-INVASIVE SCREENING IN GENETIC TESTING MARKET, BY SCREENING TYPE, 2020-2029 (USD MILLION)
TABLE 72 NORTH AMERICA NON-INVASIVE SCREENING IN GENETIC TESTING MARKET, BY SCREENING TYPE, 2020-2029 (UNITS)
TABLE 73 NORTH AMERICA NON-INVASIVE SCREENING IN GENETIC TESTING MARKET, BY SCREENING TYPE, 2020-2029 (ASP)
TABLE 74 NORTH AMERICA NEW-BORN SCREENING IN GENETIC TESTING MARKET, BY TYPE, 2020-2029 (USD MILLION)
TABLE 75 NORTH AMERICA CARRIER TESTING IN GENETIC TESTING MARKET, BY TEST TYPE, 2020-2029 (USD MILLION)
TABLE 76 NORTH AMERICA CARRIER TESTING IN GENETIC TESTING MARKET, BY TEST TYPE, 2020-2029 (UNITS)
TABLE 77 NORTH AMERICA CARRIER TESTING IN GENETIC TESTING MARKET, BY TEST TYPE, 2020-2029 (ASP)
TABLE 78 NORTH AMERICA CARRIER TESTING IN GENETIC TESTING MARKET, BY TYPE, 2020-2029 (USD MILLION)
TABLE 79 NORTH AMERICA CARRIER TESTING IN GENETIC TESTING MARKET, BY TYPE, 2020-2029 (UNITS)
TABLE 80 NORTH AMERICA CARRIER TESTING IN GENETIC TESTING MARKET, BY TYPE, 2020-2029 (ASP)
TABLE 81 NORTH AMERICA EXPANDED CARRIER SCREENING IN GENETIC TESTING MARKET, BY TYPE, 2020-2029 (USD MILLION)
TABLE 82 NORTH AMERICA EXPANDED CARRIER SCREENING IN GENETIC TESTING MARKET, BY TYPE, 2020-2029 (UNITS)
TABLE 83 NORTH AMERICA EXPANDED CARRIER SCREENING IN GENETIC TESTING MARKET, BY TYPE, 2020-2029 (ASP)
TABLE 84 NORTH AMERICA CARRIER TESTING IN GENETIC TESTING MARKET, BY MEDICAL CONDITION, 2020-2029 (USD MILLION)
TABLE 85 NORTH AMERICA GENETIC TESTING MARKET, BY TECHNOLOGY, 2020-2029 (USD MILLION)
TABLE 86 NORTH AMERICA POLYMERASE CHAIN REACTION IN GENETIC TESTING MARKET, BY TECHNOLOGY, 2020-2029 (USD MILLION)
TABLE 87 NORTH AMERICA DNA SEQUENCING IN GENETIC TESTING MARKET, BY TECHNOLOGY, 2020-2029 (USD MILLION)
TABLE 88 NORTH AMERICA MICROARRAYS IN GENETIC TESTING MARKET, BY TECHNOLOGY, 2020-2029 (USD MILLION)
TABLE 89 NORTH AMERICA GENETIC TESTING MARKET, BY DISEASES, 2020-2029 (USD MILLION)
TABLE 90 NORTH AMERICA RARE GENETIC DISORDER IN GENETIC TESTING MARKET, BY DISEASES, 2020-2029 (USD MILLION)
TABLE 91 NORTH AMERICA CANCER IN GENETIC TESTING MARKET, BY DISEASES, 2020-2029 (USD MILLION)
TABLE 92 NORTH AMERICA GENETIC TESTING MARKET, BY END USER, 2020-2029 (USD MILLION)
TABLE 93 U.S. GENETIC TESTING MARKET, BY TYPE, 2020-2029 (USD MILLION)
TABLE 94 U.S. GENETIC TESTING MARKET, BY TYPE, 2020-2029 (UNITS)
TABLE 95 U.S. GENETIC TESTING MARKET, BY TYPE, 2020-2029 (ASP)
TABLE 96 U.S. PRENATAL TESTING IN GENETIC TESTING MARKET, BY TYPE, 2020-2029 (USD MILLION)
TABLE 97 U.S. PRENATAL TESTING IN GENETIC TESTING MARKET, BY TYPE, 2020-2029 (UNITS)
TABLE 98 U.S. PRENATAL TESTING IN GENETIC TESTING MARKET, BY TYPE, 2020-2029 (ASP)
TABLE 99 U.S. NON-INVASIVE SCREENING IN GENETIC TESTING MARKET, BY SCREENING METHOD, 2020-2029 (USD MILLION)
TABLE 100 U.S. NON-INVASIVE SCREENING IN GENETIC TESTING MARKET, BY SCREENING METHOD, 2020-2029 (UNITS)
TABLE 101 U.S. NON-INVASIVE SCREENING IN GENETIC TESTING MARKET, BY SCREENING METHOD, 2020-2029 (ASP)
TABLE 102 U.S. NON-INVASIVE SCREENING IN GENETIC TESTING MARKET, BY CONDITION, 2020-2029 (USD MILLION)
TABLE 103 U.S. NON-INVASIVE SCREENING IN GENETIC TESTING MARKET, BY SCREENING TYPE, 2020-2029 (USD MILLION)
TABLE 104 U.S. NON-INVASIVE SCREENING IN GENETIC TESTING MARKET, BY SCREENING TYPE, 2020-2029 (UNITS)
TABLE 105 U.S. NON-INVASIVE SCREENING IN GENETIC TESTING MARKET, BY SCREENING TYPE, 2020-2029 (ASP)
TABLE 106 U.S. NEW-BORN SCREENING IN GENETIC TESTING MARKET, BY TYPE, 2020-2029 (USD MILLION)
TABLE 107 U.S. CARRIER TESTING IN GENETIC TESTING MARKET, BY TEST TYPE, 2020-2029 (USD MILLION)
TABLE 108 U.S. CARRIER TESTING IN GENETIC TESTING MARKET, BY TEST TYPE, 2020-2029 (UNITS)
TABLE 109 U.S. CARRIER TESTING IN GENETIC TESTING MARKET, BY TEST TYPE, 2020-2029 (ASP)
TABLE 110 U.S. CARRIER TESTING IN GENETIC TESTING MARKET, BY TYPE, 2020-2029 (USD MILLION)
TABLE 111 U.S. CARRIER TESTING IN GENETIC TESTING MARKET, BY TYPE, 2020-2029 (UNITS)
TABLE 112 U.S. CARRIER TESTING IN GENETIC TESTING MARKET, BY TYPE, 2020-2029 (ASP)
TABLE 113 U.S. EXPANDED CARRIER SCREENING IN GENETIC TESTING MARKET, BY TYPE, 2020-2029 (USD MILLION)
TABLE 114 U.S. EXPANDED CARRIER SCREENING IN GENETIC TESTING MARKET, BY TYPE, 2020-2029 (UNITS)
TABLE 115 U.S. EXPANDED CARRIER SCREENING IN GENETIC TESTING MARKET, BY TYPE, 2020-2029 (ASP)
TABLE 116 U.S. CARRIER TESTING IN GENETIC TESTING MARKET, BY MEDICAL CONDITION, 2020-2029 (USD MILLION)
TABLE 117 U.S. GENETIC TESTING MARKET, BY TECHNOLOGY, 2020-2029 (USD MILLION)
TABLE 118 U.S. POLYMERASE CHAIN REACTION IN GENETIC TESTING MARKET, BY TECHNOLOGY, 2020-2029 (USD MILLION)
TABLE 119 U.S. DNA SEQUENCING IN GENETIC TESTING MARKET, BY TECHNOLOGY, 2020-2029 (USD MILLION)
TABLE 120 U.S. MICROARRAYS IN GENETIC TESTING MARKET, BY TECHNOLOGY, 2020-2029 (USD MILLION)
TABLE 121 U.S. GENETIC TESTING MARKET, BY DISEASES, 2020-2029 (USD MILLION)
TABLE 122 U.S. RARE GENETIC DISORDER IN GENETIC TESTING MARKET, BY DISEASES, 2020-2029 (USD MILLION)
TABLE 123 U.S. CANCER IN GENETIC TESTING MARKET, BY DISEASES, 2020-2029 (USD MILLION)
TABLE 124 U.S. GENETIC TESTING MARKET, BY END USER, 2020-2029 (USD MILLION)
TABLE 125 CANADA GENETIC TESTING MARKET, BY TYPE, 2020-2029 (USD MILLION)
TABLE 126 CANADA GENETIC TESTING MARKET, BY TYPE, 2020-2029 (UNITS)
TABLE 127 CANADA GENETIC TESTING MARKET, BY TYPE, 2020-2029 (ASP)
TABLE 128 CANADA PRENATAL TESTING IN GENETIC TESTING MARKET, BY TYPE, 2020-2029 (USD MILLION)
TABLE 129 CANADA PRENATAL TESTING IN GENETIC TESTING MARKET, BY TYPE, 2020-2029 (UNITS)
TABLE 130 CANADA PRENATAL TESTING IN GENETIC TESTING MARKET, BY TYPE, 2020-2029 (ASP)
TABLE 131 CANADA NON-INVASIVE SCREENING IN GENETIC TESTING MARKET, BY SCREENING METHOD, 2020-2029 (USD MILLION)
TABLE 132 CANADA NON-INVASIVE SCREENING IN GENETIC TESTING MARKET, BY SCREENING METHOD, 2020-2029 (UNITS)
TABLE 133 CANADA NON-INVASIVE SCREENING IN GENETIC TESTING MARKET, BY SCREENING METHOD, 2020-2029 (ASP)
TABLE 134 CANADA NON-INVASIVE SCREENING IN GENETIC TESTING MARKET, BY CONDITION, 2020-2029 (USD MILLION)
TABLE 135 CANADA NON-INVASIVE SCREENING IN GENETIC TESTING MARKET, BY SCREENING TYPE, 2020-2029 (USD MILLION)
TABLE 136 CANADA NON-INVASIVE SCREENING IN GENETIC TESTING MARKET, BY SCREENING TYPE, 2020-2029 (UNITS)
TABLE 137 CANADA NON-INVASIVE SCREENING IN GENETIC TESTING MARKET, BY SCREENING TYPE, 2020-2029 (ASP)
TABLE 138 CANADA NEW-BORN SCREENING IN GENETIC TESTING MARKET, BY TYPE, 2020-2029 (USD MILLION)
TABLE 139 CANADA CARRIER TESTING IN GENETIC TESTING MARKET, BY TEST TYPE, 2020-2029 (USD MILLION)
TABLE 140 CANADA CARRIER TESTING IN GENETIC TESTING MARKET, BY TEST TYPE, 2020-2029 (UNITS)
TABLE 141 CANADA CARRIER TESTING IN GENETIC TESTING MARKET, BY TEST TYPE, 2020-2029 (ASP)
TABLE 142 CANADA CARRIER TESTING IN GENETIC TESTING MARKET, BY TYPE, 2020-2029 (USD MILLION)
TABLE 143 CANADA CARRIER TESTING IN GENETIC TESTING MARKET, BY TYPE, 2020-2029 (UNITS)
TABLE 144 CANADA CARRIER TESTING IN GENETIC TESTING MARKET, BY TYPE, 2020-2029 (ASP)
TABLE 145 CANADA EXPANDED CARRIER SCREENING IN GENETIC TESTING MARKET, BY TYPE, 2020-2029 (USD MILLION)
TABLE 146 CANADA EXPANDED CARRIER SCREENING IN GENETIC TESTING MARKET, BY TYPE, 2020-2029 (UNITS)
TABLE 147 CANADA EXPANDED CARRIER SCREENING IN GENETIC TESTING MARKET, BY TYPE, 2020-2029 (ASP)
TABLE 148 CANADA CARRIER TESTING IN GENETIC TESTING MARKET, BY MEDICAL CONDITION, 2020-2029 (USD MILLION)
TABLE 149 CANADA GENETIC TESTING MARKET, BY TECHNOLOGY, 2020-2029 (USD MILLION)
TABLE 150 CANADA POLYMERASE CHAIN REACTION IN GENETIC TESTING MARKET, BY TECHNOLOGY, 2020-2029 (USD MILLION)
TABLE 151 CANADA DNA SEQUENCING IN GENETIC TESTING MARKET, BY TECHNOLOGY, 2020-2029 (USD MILLION)
TABLE 152 CANADA MICROARRAYS IN GENETIC TESTING MARKET, BY TECHNOLOGY, 2020-2029 (USD MILLION)
TABLE 153 CANADA GENETIC TESTING MARKET, BY DISEASES, 2020-2029 (USD MILLION)
TABLE 154 CANADA RARE GENETIC DISORDER IN GENETIC TESTING MARKET, BY DISEASES, 2020-2029 (USD MILLION)
TABLE 155 CANADA CANCER IN GENETIC TESTING MARKET, BY DISEASES, 2020-2029 (USD MILLION)
TABLE 156 CANADA GENETIC TESTING MARKET, BY END USER, 2020-2029 (USD MILLION)
TABLE 157 MEXICO GENETIC TESTING MARKET, BY TYPE, 2020-2029 (USD MILLION)
TABLE 158 MEXICO GENETIC TESTING MARKET, BY TYPE, 2020-2029 (UNITS)
TABLE 159 MEXICO GENETIC TESTING MARKET, BY TYPE, 2020-2029 (ASP)
TABLE 160 MEXICO PRENATAL TESTING IN GENETIC TESTING MARKET, BY TYPE, 2020-2029 (USD MILLION)
TABLE 161 MEXICO PRENATAL TESTING IN GENETIC TESTING MARKET, BY TYPE, 2020-2029 (UNITS)
TABLE 162 MEXICO PRENATAL TESTING IN GENETIC TESTING MARKET, BY TYPE, 2020-2029 (ASP)
TABLE 163 MEXICO NON-INVASIVE SCREENING IN GENETIC TESTING MARKET, BY SCREENING METHOD, 2020-2029 (USD MILLION)
TABLE 164 MEXICO NON-INVASIVE SCREENING IN GENETIC TESTING MARKET, BY SCREENING METHOD, 2020-2029 (UNITS)
TABLE 165 MEXICO NON-INVASIVE SCREENING IN GENETIC TESTING MARKET, BY SCREENING METHOD, 2020-2029 (ASP)
TABLE 166 MEXICO NON-INVASIVE SCREENING IN GENETIC TESTING MARKET, BY CONDITION, 2020-2029 (USD MILLION)
TABLE 167 MEXICO NON-INVASIVE SCREENING IN GENETIC TESTING MARKET, BY SCREENING TYPE, 2020-2029 (USD MILLION)
TABLE 168 MEXICO NON-INVASIVE SCREENING IN GENETIC TESTING MARKET, BY SCREENING TYPE, 2020-2029 (UNITS)
TABLE 169 MEXICO NON-INVASIVE SCREENING IN GENETIC TESTING MARKET, BY SCREENING TYPE, 2020-2029 (ASP)
TABLE 170 MEXICO NEW-BORN SCREENING IN GENETIC TESTING MARKET, BY TYPE, 2020-2029 (USD MILLION)
TABLE 171 MEXICO CARRIER TESTING IN GENETIC TESTING MARKET, BY TEST TYPE, 2020-2029 (USD MILLION)
TABLE 172 MEXICO CARRIER TESTING IN GENETIC TESTING MARKET, BY TEST TYPE, 2020-2029 (UNITS)
TABLE 173 MEXICO CARRIER TESTING IN GENETIC TESTING MARKET, BY TEST TYPE, 2020-2029 (ASP)
TABLE 174 MEXICO CARRIER TESTING IN GENETIC TESTING MARKET, BY TYPE, 2020-2029 (USD MILLION)
TABLE 175 MEXICO CARRIER TESTING IN GENETIC TESTING MARKET, BY TYPE, 2020-2029 (UNITS)
TABLE 176 MEXICO CARRIER TESTING IN GENETIC TESTING MARKET, BY TYPE, 2020-2029 (ASP)
TABLE 177 MEXICO EXPANDED CARRIER SCREENING IN GENETIC TESTING MARKET, BY TYPE, 2020-2029 (USD MILLION)
TABLE 178 MEXICO EXPANDED CARRIER SCREENING IN GENETIC TESTING MARKET, BY TYPE, 2020-2029 (UNITS)
TABLE 179 MEXICO EXPANDED CARRIER SCREENING IN GENETIC TESTING MARKET, BY TYPE, 2020-2029 (ASP)
TABLE 180 MEXICO CARRIER TESTING IN GENETIC TESTING MARKET, BY MEDICAL CONDITION, 2020-2029 (USD MILLION)
TABLE 181 MEXICO GENETIC TESTING MARKET, BY TECHNOLOGY, 2020-2029 (USD MILLION)
TABLE 182 MEXICO POLYMERASE CHAIN REACTION IN GENETIC TESTING MARKET, BY TECHNOLOGY, 2020-2029 (USD MILLION)
TABLE 183 MEXICO DNA SEQUENCING IN GENETIC TESTING MARKET, BY TECHNOLOGY, 2020-2029 (USD MILLION)
TABLE 184 MEXICO MICROARRAYS IN GENETIC TESTING MARKET, BY TECHNOLOGY, 2020-2029 (USD MILLION)
TABLE 185 MEXICO GENETIC TESTING MARKET, BY DISEASES, 2020-2029 (USD MILLION)
TABLE 186 MEXICO RARE GENETIC DISORDER IN GENETIC TESTING MARKET, BY DISEASES, 2020-2029 (USD MILLION)
TABLE 187 MEXICO CANCER IN GENETIC TESTING MARKET, BY DISEASES, 2020-2029 (USD MILLION)
TABLE 188 MEXICO GENETIC TESTING MARKET, BY END USER, 2020-2029 (USD MILLION)
List of Figure
FIGURE 1 NORTH AMERICA GENETIC TESTING MARKET: SEGMENTATION
FIGURE 2 NORTH AMERICA GENETIC TESTING MARKET: DATA TRIANGULATION
FIGURE 3 NORTH AMERICA GENETIC TESTING MARKET: DROC ANALYSIS
FIGURE 4 NORTH AMERICA GENETIC TESTING MARKET: NORTH AMERICA VS REGIONAL MARKET ANALYSIS
FIGURE 5 NORTH AMERICA GENETIC TESTING MARKET: COMPANY RESEARCH ANALYSIS
FIGURE 6 NORTH AMERICA GENETIC TESTING MARKET: INTERVIEW DEMOGRAPHICS
FIGURE 7 NORTH AMERICA GENETIC TESTING MARKET: DBMR MARKET POSITION GRID
FIGURE 8 NORTH AMERICA GENETIC TESTING MARKET: APPLICATION COVERAGE GRID
FIGURE 9 NORTH AMERICA GENETIC TESTING MARKET: VENDOR SHARE ANALYSIS
FIGURE 10 NORTH AMERICA GENETIC TESTING MARKET: SEGMENTATION
FIGURE 11 INCREASING PREVALENCE OF LYMPHEDEMA AND RISING HEALTHCARE EXPENDITURE ARE EXPECTED TO DRIVE THE NORTH AMERICA GENETIC TESTING MARKET IN THE FORECAST PERIOD OF 2022 TO 2029
FIGURE 12 DIAGNOSTIC TESTING SEGMENT IS EXPECTED TO ACCOUNT FOR THE LARGEST SHARE OF THE NORTH AMERICA GENETIC TESTING MARKET IN 2022 & 2029
FIGURE 13 NORTH AMERICA IS EXPECTED TO DOMINATE THE NORTH AMERICA GENETIC TESTING MARKET AND ASIA-PACIFIC EXPECTED TO GROW WITH THE HIGHEST CAGR IN THE FORECAST PERIOD OF 2022 TO 2029
FIGURE 14 DRIVERS, RESTRAINTS, OPPORTUNITIES, AND CHALLENGES OF NORTH AMERICA GENETIC TESTING MARKET
FIGURE 15 NORTH AMERICA GENETIC TESTING MARKET: BY TYPE, 2021
FIGURE 16 NORTH AMERICA GENETIC TESTING MARKET: BY TYPE, 2022-2029 (USD MILLION)
FIGURE 17 NORTH AMERICA GENETIC TESTING MARKET: BY TYPE, CAGR (2022-2029)
FIGURE 18 NORTH AMERICA GENETIC TESTING MARKET: BY TYPE, LIFELINE CURVE
FIGURE 19 NORTH AMERICA GENETIC TESTING MARKET: BY TECHNOLOGY, 2021
FIGURE 20 NORTH AMERICA GENETIC TESTING MARKET: BY TECHNOLOGY, 2022-2029 (USD MILLION)
FIGURE 21 NORTH AMERICA GENETIC TESTING MARKET: BY TECHNOLOGY, CAGR (2022-2029)
FIGURE 22 NORTH AMERICA GENETIC TESTING MARKET: BY TECHNOLOGY, LIFELINE CURVE
FIGURE 23 NORTH AMERICA GENETIC TESTING MARKET: BY DISEASES, 2021
FIGURE 24 NORTH AMERICA GENETIC TESTING MARKET: BY DISEASES, 2022-2029 (USD MILLION)
FIGURE 25 NORTH AMERICA GENETIC TESTING MARKET: BY DISEASES, CAGR (2022-2029)
FIGURE 26 NORTH AMERICA GENETIC TESTING MARKET: BY DISEASES, LIFELINE CURVE
FIGURE 27 NORTH AMERICA GENETIC TESTING MARKET: BY END USER, 2021
FIGURE 28 NORTH AMERICA GENETIC TESTING MARKET: BY END USER, 2022-2029 (USD MILLION)
FIGURE 29 NORTH AMERICA GENETIC TESTING MARKET: BY END USER, CAGR (2022-2029)
FIGURE 30 NORTH AMERICA GENETIC TESTING MARKET: BY END USER, LIFELINE CURVE
FIGURE 31 NORTH AMERICA GENETIC TESTING MARKET: SNAPSHOT (2021)
FIGURE 32 NORTH AMERICA GENETIC TESTING MARKET: BY COUNTRY (2021)
FIGURE 33 NORTH AMERICA GENETIC TESTING MARKET: BY COUNTRY (2022 & 2029)
FIGURE 34 NORTH AMERICA GENETIC TESTING MARKET: BY COUNTRY (2021 & 2029)
FIGURE 35 NORTH AMERICA GENETIC TESTING MARKET: BY TYPE (2022-2029)
FIGURE 36 NORTH AMERICA GENETIC TESTING MARKET: COMPANY SHARE 2021 (%)
Data collection and base year analysis are done using data collection modules with large sample sizes. The stage includes obtaining market information or related data through various sources and strategies. It includes examining and planning all the data acquired from the past in advance. It likewise envelops the examination of information inconsistencies seen across different information sources. The market data is analysed and estimated using market statistical and coherent models. Also, market share analysis and key trend analysis are the major success factors in the market report. To know more, please request an analyst call or drop down your inquiry.
The key research methodology used by DBMR research team is data triangulation which involves data mining, analysis of the impact of data variables on the market and primary (industry expert) validation. Data models include Vendor Positioning Grid, Market Time Line Analysis, Market Overview and Guide, Company Positioning Grid, Patent Analysis, Pricing Analysis, Company Market Share Analysis, Standards of Measurement, Global versus Regional and Vendor Share Analysis. To know more about the research methodology, drop in an inquiry to speak to our industry experts.
Data Bridge Market Research is a leader in advanced formative research. We take pride in servicing our existing and new customers with data and analysis that match and suits their goal. The report can be customized to include price trend analysis of target brands understanding the market for additional countries (ask for the list of countries), clinical trial results data, literature review, refurbished market and product base analysis. Market analysis of target competitors can be analyzed from technology-based analysis to market portfolio strategies. We can add as many competitors that you require data about in the format and data style you are looking for. Our team of analysts can also provide you data in crude raw excel files pivot tables (Fact book) or can assist you in creating presentations from the data sets available in the report.


