
North America Hop Water Market
Market Size in USD Million
 USD
53.10 Million
USD
127.20 Million
2025
2033
USD
53.10 Million
USD
127.20 Million
2025
2033
| 2026 - 2033 | |
| USD 53.10 Million | |
| USD 127.20 Million | |
| % | |
|
North America Hop Water Market Size
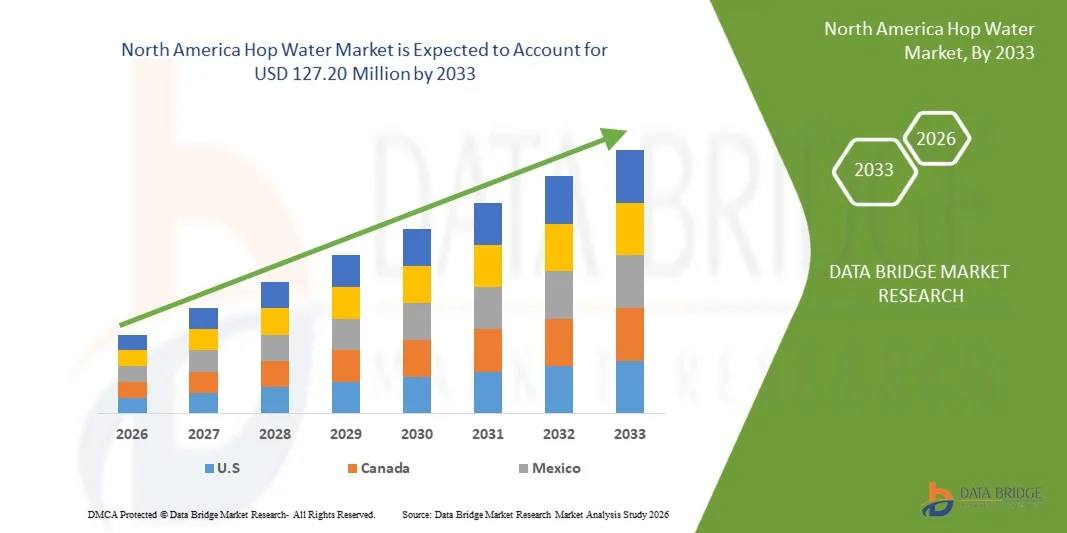
- The North America Hop Water Market was valued at USD 53.10 million in 2025 and is expected to reach USD 127.20 million by 2033
- During the forecast period of 2026 to 2033 the market is likely to grow at a CAGR of 12.0%, supported primarily driven by rising consumer preference for non-alcoholic and low-calorie beverages, increasing health and wellness awareness, and the growing adoption of alcohol alternatives.
- Moreover, ongoing product innovation in botanical and functional beverage formulations, coupled with the expansion of direct-to-consumer and e-commerce channels and broader availability across retail and foodservice formats, is supporting sustained market growth across major regions, particularly North America and Europe.
North America Hop Water Market Analysis
- The North America Hop Water Market is witnessing steady advancement as beverage manufacturers increasingly focus on non-alcoholic innovation, clean-label formulations, and functional beverage positioning to meet evolving consumer preferences. Hop water producers are leveraging botanical infusions, zero-calorie formulations, and advanced flavor extraction techniques to enhance taste consistency, shelf stability, and product differentiation across retail and on-premise channels. The use of refined hop varietals, natural carbonation processes, and sustainable packaging is further shaping product development strategies across the region.
- These innovations are strengthening the regional value chain by improving production efficiency, enabling scalable manufacturing, and ensuring consistent product quality. Direct-to-consumer models, subscription offerings, and e-commerce platforms are supporting faster market penetration and improved consumer engagement, while expanded distribution across grocery, convenience, specialty beverage stores, and foodservice outlets is increasing accessibility. Data-driven marketing, digital branding, and lifestyle positioning around sobriety, wellness, and active living are also contributing to brand traction.
- U.S. is expected to dominate the North America Hop Water Market with the largest revenue share of 62.86% in 2026, supported by strong consumer awareness of non-alcoholic and functional beverages, a well-developed craft beverage ecosystem, and continuous investments by beverage manufacturers in product innovation, branding, and scalable production capabilities.
- U.S. is projected to be the fastest-growing market, registering a CAGR of 12.1%, driven by the expanding sober-curious movement, increasing demand for zero-calorie and low-sugar refreshment options, and the growing availability of hop water across direct-to-consumer platforms, e-commerce channels, and mainstream retail and foodservice outlets.
- In 2026, the Classic segment is expected to dominate the market with a 56.78% share, reflecting strong consumer preference for traditional, unflavored or lightly flavored hop water variants that deliver a clean, crisp, and beer-like taste profile without alcohol, calories, or sugar, making them particularly appealing to health-conscious consumers and former beer drinkers seeking familiar sensory experiences.
Report Scope and North America Hop Water Market Segmentation
|
Attributes |
North America Hop Water Key Market Insights |
|
Segments Covered |
|
|
Countries Covered |
North America
|
|
Key Market Players |
|
|
Market Opportunities |
|
|
Value Added Data Infosets |
In addition to the insights on, and major players, the market reports curated by the Data market scenarios such as market value, growth rate, segmentation, geographical coverage Bridge Market Research also include porter’s five forces, company evaluation quadrant, pricing analysis, raw material coverage, climate change scenario, industry ecosystem analysis, brand outlook, consumer buying behaviour, innovation tracker and strategic analysis, profit margins scenario, raw material coverage, supply chain analysis, technological advancements, value chain analysis, vendor selection criteria, regulatory coverage. |
North America Hop Water Market Trends
“Product Innovation Using Botanical, Organic, And Functional Ingredient Blends To Enhance Differentiation ”
- Product innovation that leverages botanical, organic, and functional ingredient blends presents a compelling growth opportunity for the North America Hop Water Market. As consumer preferences shift toward beverages that deliver unique sensory profiles and wellness benefits, hop water brands can differentiate themselves by incorporating natural botanicals, organic hops, and functional additives such as adaptogens and nootropics. These ingredient strategies help brands stand out from generic flavored waters and appeal to health‑oriented consumers seeking non‑alcoholic alternatives with purposeful value.
- Structured regulatory frameworks also support transparent communication around organic and functional ingredients, enabling differentiation. In the United States, the USDA National Organic Program (NOP) defines clear standards for organic product labeling, including categories such as “organic” and “made with organic ingredients,” which allow products with certified organic components to signal quality and provenance to consumers. Certified products that meet USDA organic criteria may carry the USDA organic seal and must adhere to strict production and handling standards.
- Additionally, FDA food labeling guidance mandates accurate nutrition labeling and regulated claim language, helping ensure that functional ingredient claims (such as nutrient content or structure/function benefits) are truthful and not misleading under U.S. law.
- In December 2023, H2OPS Inc. announced that its hop water has achieved USDA Organic certification for cans brewed with whole organic hops ; a notable product innovation that enhances differentiation within the non‑alcoholic beverage category by certifying ingredient quality and organic sourcing.
- In 2025, Perfect Peaks Hop Water promotes hop‑infused sparkling beverages that combine pure hop botanicals with essential electrolytes to create “clean, calm hydration,” positioning the product as both refreshing and functionally beneficial without alcohol, sugar or calories.
- In conclusion, product innovation rooted in botanical, organic, and functional ingredient blends allows hop water brands to differentiate within competitive beverage markets. By aligning with regulatory frameworks that support clear organic labeling and responsibly communicating functional benefits, producers can attract wellness‑minded consumers, expand usage occasions, and build stronger brand loyalty, thus enhancing the category’s North America growth potential.
North America Hop Water Market Dynamics
Driver
“Increasing Adoption Of Alcohol Alternatives Supported By The Sober-Curious Movement And Lifestyle Shifts”
- The increasing adoption of alcohol alternatives supported by the sober-curious movement and lifestyle shifts has emerged as a key driver of growth in the North America Hop Water Market. Public health data show that alcohol consumption patterns are shifting, particularly among younger and health-conscious cohorts, as concern about long-term health effects gains prominence. In the United States, for example, in august 2025, according to Gallup, Inc. only 54% of adults currently report drinking alcohol, a historical low in alcohol use as tracked since 1939, and a record majority now view even moderate drinking as harmful to health, reflecting heightened public awareness of alcohol’s health risks.
- This changing societal perspective aligns with broader lifestyle shifts toward moderation, wellness, and mindful consumption, where non-alcoholic and zero-proof beverages are not only substitutes but preferred choices for social and everyday occasions. Public health initiatives such as “Dry January,” which encourages temporary abstinence from alcohol, have attracted millions of participants across countries and contributed to a cultural reevaluation of alcohol use, prompting consumers to explore alternatives that support well-being and social inclusion without the intoxication associated with traditional alcoholic drinks.
- In August 2025, Gallup polling highlighted that the share of U.S. adults who report consuming alcohol has dropped to the lowest level in decades, driven in part by growing health concerns and reduced frequency of drinking among adults under age 35.
- In January 2026, The “Dry January” challenge, adopted in several countries including the U.K. and France, attracted an estimated 4.5 million participants during its 2025 edition, reflecting significant engagement with alcohol-free lifestyle practices that extend beyond a temporary abstinence month to influence year-round beverage preferences.
- In conclusion, the sober-curious movement and associated lifestyle shifts toward moderation, wellness, and mindful consumption are structurally reshaping North America beverage demand, creating a favorable environment for alcohol-free alternatives such as hop water. Declining alcohol consumption, reinforced by public health guidance, government initiatives, and changing social norms, indicates that reduced drinking is no longer a temporary trend but a sustained behavioral transformation, particularly among younger demographics. As consumers increasingly seek beverages that support social participation without intoxication or health trade-offs, hop water is well positioned as a flavorful, non-alcoholic option that aligns with evolving lifestyle priorities. This sustained shift toward alcohol alternatives is expected to continue strengthening hop water’s role within the North America non-alcoholic and functional beverage ecosystem.
Restraint/Challenge
“Competition From Substitutes Such As Sparkling Water, Kombucha, And Non-Alcoholic Beers ”
- Competition from substitutes such as sparkling water, kombucha, and non‑alcoholic beers presents a significant challenge for the North America Hop Water Market, as these beverages target the same health‑ and wellness‑oriented consumers that hop water aims to attract. Sparkling waters benefit from widespread consumer familiarity, established retail presence, and trusted regulatory frameworks, while kombucha appeals to functional health seekers through probiotics and gut‑friendly benefits. Non‑alcoholic beers provide a beer‑like experience without alcohol, making them strong competitors in social, hospitality, and mindful‑drinking occasions. These substitutes can reduce consumer trial and adoption of hop water unless brands actively differentiate their offerings, invest in education, and create lifestyle‑aligned experiences.
- For instances,
- The U.S. Food and Drug Administration (FDA) regulates sparkling and flavored waters as standard non‑alcoholic beverages, ensuring consumer confidence and widespread availability in retail and on‑premise settings, which strengthens competition against emerging hop water brands.
- The Alcohol and Tobacco Tax and Trade Bureau (TTB) classifies kombucha with less than 0.5% ABV as non‑alcoholic, enabling broad retail distribution and consumer perception as a functional, probiotic beverage that competes directly for wellness‑oriented consumers.
- Major breweries such as Heineken 0.0 and Budweiser Zero produce non‑alcoholic beers with full beer‑flavor profiles, allowing consumers to substitute hop water in social and hospitality settings while still enjoying a “beer-like” experience.
- In conclusion, competition from well-established substitutes such as sparkling water, kombucha, and non-alcoholic beers constrains hop water adoption and limits trial in retail and on-premise environments. To succeed, hop water brands must leverage functional differentiation, lifestyle-aligned marketing, and strategic partnerships to educate consumers, reinforce brand relevance, and encourage trial among health- and wellness-oriented audiences.
North America Hop Water Market Scope
North America Hop Water Market is segmented into eight notable segments based on the product type, flavor, carbonation level, packaging, price, application, end user, distribution channel.
- By Product Type
On the basis of product type, the North America Hop Water Market is segmented into Classic and Blended. In 2026, the Classic segment is expected to dominate the market with a 56.78% market share, driven by strong consumer preference for simple, clean-label hop water that delivers a crisp, beer-like taste without alcohol, calories, or added ingredients. Classic hop water appeals particularly to former beer drinkers and health-conscious consumers seeking a straightforward, refreshing alternative, supporting its widespread adoption across mature non-alcoholic beverage markets.
The Blended segment is the fastest-growing in the North America Hop Water Market, with a CAGR of 12.2%, driven by increasing demand for innovative flavor combinations that blend hops with botanicals, fruits, and functional ingredients. Rising consumer interest in experiential beverages, expanding availability through direct-to-consumer and e-commerce channels, and continuous product experimentation by emerging and established brands are expected to further accelerate blended hop water adoption during the forecast period
- By Flavor
On the basis of flavor, the North America Hop Water Market is segmented into With Flavor and Without Flavor. In 2026, the With Flavor segment is expected to dominate with a 69.86% market share, driven by strong consumer preference for enhanced taste profiles and variety within the hop water category. Flavored variants incorporating citrus, botanical, and fruit-infused notes help balance hop bitterness, improve palatability, and attract a broader consumer base, including first-time users and non-beer drinkers.
The With Flavor segment is the fastest-growing segment in the North America Hop Water Market, with a CAGR of 12.1%, driven by continuous flavor innovation, seasonal and limited-edition launches, and rising demand for clean-label, naturally flavored beverages. Expanding availability across retail, e-commerce, and foodservice channels, along with increasing consumer interest in experiential and premium non-alcoholic beverages, is expected to further accelerate segment growth during the forecast period.
- By Carbonation Level
On the basis of carbonation level, the North America Hop Water Market is segmented into Low Carbonated, Medium Carbonated, and Highly Carbonated. In 2026, the Low Carbonated segment is expected to dominate the market with 44.23% market share, driven by the growing consumer preference for smoother, less fizzy beverages that are easy on digestion and suitable for regular consumption. Low-carbonation hop water appeals to health-conscious consumers seeking gentle hydration with subtle bitterness, making it well suited for fitness, wellness, and everyday refreshment use.
Medium Carbonated is the fastest-growing segment with a CAGR of 12.4% in the North America Hop Water Market driven by rising demand for balanced carbonation that delivers a crisp, refreshing mouthfeel without excessive fizz. Medium-carbonated hop water is increasingly preferred by consumers transitioning from carbonated soft drinks or beer, as it offers a familiar sensory experience while maintaining zero alcohol and low-calorie benefits, thereby accelerating adoption across key North American markets.
- By Packaging
On the basis of packaging, the North America Hop Water Market is segmented into Aluminium Cans, Bottles, Kegs/Barrels, Pouches, and Others. In 2026, the Aluminium Cans segment is expected to dominate the market with 63.35% market share, driven by their lightweight nature, superior recyclability, and ability to preserve carbonation and flavor integrity. Aluminium cans are widely preferred by manufacturers and consumers for hop water as they support convenient single-serve consumption, rapid chilling, and sustainable packaging initiatives, aligning well with the clean-label and eco-conscious positioning of the category.
Aluminium Cans is the fastest-growing segment with CAGR of 12.3% in the North America Hop Water Market driven by increasing on-the-go consumption, expanding distribution across convenience stores, gyms, and outdoor recreation venues, and rising adoption of recyclable packaging solutions. Strong emphasis on sustainability, coupled with cost-efficient large-scale canning and brand-friendly design flexibility, is further accelerating the use of aluminium cans across key North American markets.
- By Price
On the basis of Price, the North America Hop Water Market is segmented into 2–5 USD, Up to 2 USD, 5–10 USD, Above 10 USD. In 2026, the 2–5 USD segment is expected to dominate the market with 40.98% market share, driven by strong consumer preference for affordable premium beverages that balance quality, flavor variety, and value for money. Products in this range appeal to a broad consumer base seeking zero-calorie, alcohol-free alternatives positioned between mass-market sparkling water and premium functional beverages, making them widely accessible across retail and foodservice channels.
Up to 2 USD is the fastest-growing segment with CAGR of 12.4% in the North America Hop Water Market driven by increasing price sensitivity among consumers, rising demand for everyday hydration beverages, and expanding availability of hop water in multipacks and large-format retail outlets. Competitive pricing strategies, private-label offerings, and wider distribution through convenience stores and mass retailers are further accelerating adoption of lower-priced hop water products across key North American markets.
- By Application
On the basis of application, the North America Hop Water Market is segmented into Fitness & Wellness, Mixers for Alcoholic Beverages, Culinary Use, Medical & Therapeutic Use, and Others. In 2026, the Fitness & Wellness segment is expected to dominate the market with 37.05% market share, driven by increasing consumer focus on active lifestyles, hydration, and functional beverages. Hop water is gaining traction as a zero-calorie, alcohol-free alternative that aligns with fitness routines, post-workout recovery, and wellness-oriented consumption, particularly among health-conscious and younger demographics.
Fitness & Wellness is the fastest-growing segment with CAGR of 12.4% in the North America Hop Water Market driven by rising participation in fitness activities, expanding availability of hop water through gyms, wellness centers, and online channels, and increased adoption of clean-label and botanical beverages. Improved distribution logistics, targeted digital marketing, and lifestyle-driven branding are further accelerating demand for hop water within the fitness and wellness ecosystem across key North American markets.
- By End User
On the basis of end user, the North America Hop Water Market is segmented into Household/Residential, Commercial, and Institutional. In 2026, the Household/Residential segment is expected to dominate the market with 72.33% market share, driven by rising at-home consumption of non-alcoholic and low-calorie beverages. Growing health consciousness, increasing participation in the sober-curious movement, and a preference for convenient, everyday refreshment options are encouraging consumers to purchase hop water for regular household use. The expansion of direct-to-consumer and e-commerce platforms further supports this segment by improving product accessibility, pricing transparency, and repeat purchases across major regions.
Institutional is the fastest-growing segment with CAGR of 12.5% in the North America Hop Water Market driven by increasing adoption of hop water across foodservice outlets, corporate offices, gyms and wellness centers, hospitality venues, and educational institutions seeking healthier beverage alternatives. Enhanced distribution logistics, bulk packaging options, and rising demand for alcohol-free beverages in professional and public settings are accelerating institutional adoption across key North American markets
- By Distribution Channel
On the basis of distribution channel, the North America Hop Water Market is segmented into Store-Based and Non-Store Based. In 2026, the Store-Based segment is expected to dominate the market with 71.41% market share, driven by the strong presence of supermarkets, hypermarkets, convenience stores, and specialty beverage retailers. These outlets enable higher product visibility, immediate product availability, and impulse purchasing, while also allowing consumers to compare flavors and brands directly. Established retail networks across major regions continue to play a critical role in brand discovery and volume sales, particularly for emerging non-alcoholic beverage categories such as hop water.
Non-Store Based is the fastest-growing segment with CAGR of 12.2% in the North America Hop Water Market driven by rapid expansion of direct-to-consumer and e-commerce platforms, subscription-based beverage models, and brand-owned online stores. Increasing consumer preference for home delivery, access to wider product assortments, and personalized purchasing experiences, along with improved cold-chain logistics and digital marketing strategies, is accelerating the shift toward non-store-based distribution across key North American markets
North America Hop Water Market Regional Analysis
- U.S. is expected to dominate the North America Hop Water Market with the largest revenue share of 62.86% in 2026, supported by strong investments in non-alcoholic beverage innovation, expanding production capabilities, and a well-established functional and craft beverage ecosystem. High consumer awareness of health-focused, zero-calorie drinks, along with widespread availability across retail, foodservice, and direct-to-consumer channels, continues to strengthen the U.S. position within the regional market.
- U.S. is expected to be the fastest-growing region in the North America Hop Water Market during the forecast period with a CAGR of 12.1%, fueled by rising demand for alcohol alternatives, increasing adoption of wellness-oriented lifestyles, and rapid expansion of e-commerce and subscription-based beverage models. The growing influence of the sober-curious movement, combined with continuous product launches and flavor innovation, is further accelerating market penetration.
- Additionally, sustained focus on clean-label formulations, functional ingredients, and sustainable packaging solutions is expected to support long-term expansion of the North America Hop Water Market across North America. Strong brand positioning around health, refreshment, and mindful consumption continues to reinforce market growth across both urban and suburban consumer segments.
Canada North America Hop Water Market Insight
The Canada North America Hop Water Market holds a growing position within the North American landscape, driven by increasing consumer awareness of non-alcoholic and low-calorie beverages, rising health consciousness, and expanding interest in functional and botanical drinks. Growing availability of hop water across supermarkets, specialty beverage stores, and e-commerce platforms is improving consumer access and trial rates. Additionally, strong demand for clean-label products, sustainable packaging, and alcohol alternatives among urban and wellness-oriented consumers continues to reinforce Canada’s role in the regional North America Hop Water Market.
Mexico North America Hop Water Market Insight
The Mexico North America Hop Water Market is expected to grow steadily, supported by shifting consumer preferences toward healthier beverage options, rising interest in alcohol-free alternatives, and increasing exposure to global wellness and craft beverage trends. Expansion of modern retail formats, growing presence of international and regional beverage brands, and gradual penetration of e-commerce channels are supporting market development. Furthermore, increasing demand for refreshing, low-sugar drinks and improving distribution infrastructure are contributing to sustained North America Hop Water Market growth across the country.
The Major Market Leaders Operating in the Market Are:
- HOP WTR (U.S.)
- H2OPS Sparkling Hop Water (U.S.)
- Hoplark (U.S.)
- Athletic Brewing Company LLC (U.S.)
- Sierra Nevada Brewing Co. (U.S.)
- Lagunitas Brewing Company (U.S.)
- Deschutes Brewery (U.S.)
- Founders Brewing Co. (U.S.)
- Craftzero (Australia)
- Abita Brewing Company (U.S.)
- Surly Brewery (U.S.)
- Pelican Brewing Company (U.S.)
- Dr Hops (U.S.)
- Wooden Hill Brewing (U.S.)
- Burlington Beer Company (U.S.)
- Untitled Art (U.S.)
- Fieldwork Brewing Co (U.S.)
- Griffin Claw Brewing Company (U.S.)
- Cabin brewing company (Canada)
- Denver Beer Co. (U.S.)
- Partake Brewing (Canada)
- BrewDog (Scotland)
- The New Bar (U.S.)
- Perfect Peaks Brews (Portugal)
Latest Developments in North America Hop Water
- In 2025, Cabin Brewing Company introduced its Quench Hop Water line of non‑alcoholic hop‑infused sparkling waters—including Super Hop Blend, NZ Hop Blend, Noble Hop Blend, and PNW Blend—expanding beyond traditional beer offerings to include refreshing hop water alternatives with zero alcohol, calories, and sugars.
- On November 2025, BrewDog Distilling Co.—the spirits arm of BrewDog—was announced as the official gin and vodka partner of Aberdeen Football Club in a multi‑year agreement that will run for the next three seasons. As part of the partnership, BrewDog is releasing limited‑edition bottles of LoneWolf Gin and Abstrakt Vodka branded for the club, with each year’s release forming part of a three‑bottle collectible series. These premium spirits, produced in Aberdeen, will be available through BrewDog’s online shop, local BrewDog bars, and the AFC Shop at Pittodrie Stadium, deepening BrewDog’s engagement with local fans and strengthening its presence in sports‑linked lifestyle branding.
- In November 2025, Wooden Hill Brewing Company updated its tap offerings including the returning Cahill Cream Ale, seasonal food specials, and continued festive Jingle Bar experiences as part of evolving taproom engagements for the holiday season
- On October 2025, Pelican Brewing Company — the iconic Oregon Coast brewery known for its award-winning beers and scenic coastal taprooms — opened a new taproom in Rockaway Beach, positioned just steps from the sand. The site marks Pelican’s fifth coastal location and offers a cozy, laid-back setting where visitors can enjoy the brewery’s signature craft beers, light bites, and ocean views in a casual, community-centric atmosphere. This expansion continues Pelican’s investment in Oregon’s coastal towns, supports local tourism, and enhances access to its craft offerings along the Pacific shoreline.
- In October 2024, HOP WTR launched the “Up To No Good” brand campaign to celebrate the positive power of saying “No,” emphasizing its hop water’s no‑alcohol, no‑calories, no‑sugar, no‑gluten, and no‑GMOs positioning while engaging consumers in a bold lifestyle narrative.
SKU-

- Interactive Data Analysis Dashboard
- Company Analysis Dashboard for high growth potential opportunities
- Research Analyst Access for customization & queries
- Competitor Analysis with Interactive dashboard
- Latest News, Updates & Trend analysis
- Harness the Power of Benchmark Analysis for Comprehensive Competitor Tracking
Table of Content
1 INTRODUCTION
1.1 OBJECTIVES OF THE STUDY
1.2 MARKET DEFINITION
1.3 OVERVIEW OF NORTH AMERICA HOP WATER MARKET
1.4 LIMITATIONS
1.5 MARKETS COVERED
2 MARKET SEGMENTATION
2.1 MARKETS COVERED
2.2 GEOGRAPHICAL SCOPE
2.3 YEARS CONSIDERED FOR THE STUDY
2.4 CURRENCY AND PRICING
2.5 DBMR TRIPOD DATA VALIDATION MODEL
2.6 MULTIVARIATE MODELING
2.7 TIMLINE CURVE
2.8 PRIMARY INTERVIEWS WITH KEY OPINION LEADERS
2.9 DBMR MARKET POSITION GRID
2.1 MARKET END USER COVERAGE GRID
2.11 VENDOR SHARE ANALYSIS
2.12 SECONDARY SOURCES
2.13 ASSUMPTIONS
3 EXECUTIVE SUMMARY
4 PREMIUM INSIGHTS
4.1 PORTER’S FIVE FORCES
4.1.1 THREAT OF NEW ENTRANTS
4.1.1.1 Capital Requirement (Moderate):
4.1.1.2 Product Knowledge (Low):
4.1.1.3 Technical Knowledge (Low to Moderate):
4.1.1.4 Customer Relations (High):
4.1.1.5 Access to Raw Materials & Technology (Low):
4.1.2 THREAT OF SUBSTITUTES
4.1.2.1 Cost (High):
4.1.2.2 Performance (Moderate):
4.1.2.3 Availability (High):
4.1.2.4 Brand & Marketing (High):
4.1.2.5 Durability / Health Profile (Moderate):
4.1.3 BARGAINING POWER OF BUYERS
4.1.3.1 Number of Buyers Relative to Suppliers (High for Retailers):
4.1.3.2 Product Differentiation (Moderate):
4.1.3.3 Threat of Forward Integration (Low):
4.1.3.4 Buyers' Volume (High):
4.1.4 BARGAINING POWER OF SUPPLIERS
4.1.4.1 Suppliers Concentration (Low for Inputs, Moderate for Co-Packers):
4.1.4.2 Buyers' Switching Cost to Other Suppliers (Low for Materials, Moderate for Co-Packers):
4.1.4.3 Threat of Backward Integration (Very Low):
4.1.5 COMPETITIVE RIVALRY
4.1.5.1 Industry Concentration (Currently Low, Moving Towards Consolidation):
4.1.5.2 Industry Growth Rate (High):
4.1.5.3 Product Differentiation (Moderate and Critical):
4.2 COMPANY SHARE ANALYSIS: IMPORT IN GCC
4.3 GCC IMPORT OUTLOOK
4.3.1 IMPORT STATISTICS USD THOUSAND AND THOUSAND LITRES, BY COUNTRY, 2018-2024, (USD THOUSAND) (THOUSAND LITRES)
4.4 INDUSTRY ECOSYSTEM ANALYSIS
4.4.1 PROMINENT COMPANIES
4.4.2 SMALL & MEDIUM SIZE COMPANIES
4.4.3 END USERS
4.5 INNOVATION TRACKER AND STRATEGIC ANALYSIS
4.5.1 MAJOR DEALS AND STRATEGIC ALLIANCES ANALYSIS
4.5.2 PRODUCTS DEVELOPMENTS
4.5.3 STAGE OF DEVELOPMENT
4.5.3.1 Early Emergence and Category Formation
4.5.3.2 Growing Adoption but Uneven Sales Trajectory
4.5.3.3 Emerging but Still Nascent Within Non-Alcoholic Sector
4.5.3.4 Consumer Profile and Demand Signals
4.5.3.5 Market Structure & Competitive Dynamics
4.5.3.6 Structural Position in the Beverage Industry
4.5.3.7 Summary — Stage of Development
4.5.4 TIMELINES AND MILESTONES
4.5.5 INNOVATION STRATEGIES AND METHODOLOGIES
4.5.6 RISK ASSESSMENT AND MITIGATION
4.5.7 FUTURE OUTLOOK
4.6 PRICING ANALYSIS
4.7 CLIMATE CHANGE SCENARIO
4.7.1 ENVIRONMENTAL CONCERNS
4.7.2 INDUSTRY RESPONSE
4.7.3 GOVERNMENT’S ROLE
4.8 ANALYST RECOMMENDATIONS
4.9 RAW MATERIAL COVERAGE – NORTH AMERICA HOP WATER MARKET
4.9.1 INTRODUCTION
4.9.2 CORE RAW MATERIALS USED IN HOP WATER PRODUCTION
4.9.3 NATURAL FLAVOR ENHANCERS AND BOTANICALS
4.9.4 RAW MATERIAL SOURCING AND SUPPLY CHAIN CONSIDERATIONS
4.9.5 CONCLUSION
4.1 BRAND OUTLOOK
4.10.1 H2OPS ORIGINAL & GRAPEFRUIT HOP WATER
4.10.1.1 Brand Positioning and Identity
4.10.1.2 Brand Communication and Consumer Perception
4.10.1.3 Packaging and Brand Evolution
4.10.2 HOP WTR (CLASSIC AND FLAVORED VARIANTS)
4.10.2.1 Brand Positioning and Functional Identity
4.10.2.2 Narrative and Lifestyle Communication
4.10.2.3 Visual Branding and Innovation
4.10.3 LAGUNITAS HOPPY REFRESHER
4.10.3.1 Brand Positioning and Heritage Leverage
4.10.3.2 Consumer Messaging and Experience
4.10.3.3 Packaging and Market Role
4.10.4 SIERRA NEVADA HOP SPLASH
4.10.4.1 Brand Positioning and Flavor Expression
4.10.4.2 Sensory-Driven Communication
4.10.4.3 Design and Innovation Outlook
4.10.5 HOPLARK SPARKLING HOP WATER
4.10.5.1 Premium Brand Positioning and Craft Focus
4.10.5.2 Educational Storytelling and Consumer Engagement
4.10.5.3 Packaging and Innovation Strategy
4.10.6 CONCLUSION
4.11 CONSUMER BUYING BEHAVIOUR
4.11.1 INTRODUCTION
4.11.2 HEALTH AND WELLNESS ORIENTATION
4.11.3 INFLUENCE OF TASTE SOPHISTICATION AND SENSORY EXPERIENCE
4.11.4 ROLE OF LIFESTYLE ALIGNMENT AND IDENTITY EXPRESSION
4.11.5 PRICE SENSITIVITY AND VALUE PERCEPTION
4.11.6 PACKAGING, LABELING, AND VISUAL APPEAL
4.11.7 DISTRIBUTION CHANNEL PREFERENCES AND ACCESSIBILITY
4.11.8 REPEAT PURCHASE DRIVERS AND BRAND LOYALTY
4.11.9 BARRIERS TO ADOPTION AND CONSUMER HESITATION
4.11.10 CONCLUSION
4.12 TECHNOLOGICAL ADVANCEMENTS IN THE NORTH AMERICA HOP WATER MARKET
4.12.1 INTRODUCTION
4.12.2 PRECISION FERMENTATION AND FLAVOR EXTRACTION TECHNOLOGIES
4.12.3 AUTOMATED PRODUCTION SYSTEMS AND DIGITAL PROCESS CONTROLS
4.12.4 PACKAGING INNOVATIONS AND SHELF STABILITY ENHANCEMENTS
4.12.5 QUALITY ASSURANCE THROUGH ANALYTICAL TECHNOLOGIES
4.12.6 DIGITAL MARKETING TECHNOLOGIES AND CONSUMER CO‑CREATION PLATFORMS
4.12.7 CONCLUSION
4.13 SUPPLY CHAIN ANALYSIS
4.13.1 OVERVIEW
4.13.2 LOGISTIC COST SCENARIO
4.13.3 IMPORTANCE OF LOGISTICS SERVICE PROVIDERS
4.13.4 CHALLENGES IN SUPPLY CHAIN MANAGEMENT
4.13.5 CONCLUSION
4.14 VALUE CHAIN ANALYSIS
4.14.1 RAW MATERIAL SOURCING
4.14.2 PRODUCTION AND MANUFACTURING
4.14.3 PACKAGING AND BRANDING
4.14.4 DISTRIBUTION AND LOGISTICS
4.14.5 MARKETING, SALES, AND CUSTOMER ENGAGEMENT
4.14.6 AFTER-SALES SERVICE AND FEEDBACK INTEGRATION
4.14.7 CONCLUSION
4.15 VENDOR SELECTION CRITERIA FOR BUSINESS ESTABLISHMENT IN DUBAI
4.15.1 RAW MATERIAL SOURCING PATTERNS
4.15.2 CURRENT PRODUCTION OUTLOOK
4.15.3 INDICATORS REQUIRED FOR SELECTION OF PRODUCTION UNIT LOCATIONS
4.15.4 GOVERNMENT SUPPORT
4.15.5 LIST OF KEY TECHNOLOGY AND ENGINEERING COMPANIES
4.15.5.1 Turnkey beverage-line and process-technology providers
4.15.5.2 Local machinery OEMs and engineering firms serving Dubai
4.15.5.3 Packaging, closures and labelling technology partners
4.15.6 LIST OF KEY DISTRIBUTORS
4.15.6.1 Whizz.ae
4.15.6.2 Noon
4.15.6.3 Amazon
4.15.6.4 The Non-Alcoholic Club (UAE)
4.15.6.5 Desertcart
4.15.6.6 Ubuy
4.15.6.7 Noble Alliance
5 REGULATION COVERAGE
5.1 PRODUCT CODES
5.2 CERTIFIED STANDARDS
5.3 SAFETY STANDARDS
5.3.1 MATERIAL HANDLING & STORAGE
5.3.2 TRANSPORT & PRECAUTIONS
5.3.3 HAZARD IDENTIFICATION
6 MARKET OVERVIEW
6.1 DRIVERS
6.1.1 RISING CONSUMER DEMAND FOR LOW-CALORIE, SUGAR-FREE, AND NON-ALCOHOLIC BEVERAGES DRIVEN BY HEALTH AND WELLNESS TRENDS
6.1.2 GROWING POPULARITY OF CRAFT-INSPIRED AND FUNCTIONAL BEVERAGES, PARTICULARLY AMONG MILLENNIALS AND GEN Z CONSUMERS
6.1.3 INCREASING ADOPTION OF ALCOHOL ALTERNATIVES SUPPORTED BY THE SOBER-CURIOUS MOVEMENT AND LIFESTYLE SHIFTS
6.1.4 EXPANSION OF E-COMMERCE AND DIRECT-TO-CONSUMER CHANNELS, IMPROVING PRODUCT ACCESSIBILITY AND MARKET PENETRATION
6.2 RESTRAINTS
6.2.1 LIMITED CONSUMER AWARENESS OF HOP WATER COMPARED TO ESTABLISHED BEVERAGE CATEGORIES
6.2.2 SHELF-SPACE COMPETITION IN RETAIL ENVIRONMENTS DOMINATED BY ESTABLISHED BEVERAGE BRANDS
6.3 OPPORTUNITIES
6.3.1 PRODUCT INNOVATION USING BOTANICAL, ORGANIC, AND FUNCTIONAL INGREDIENT BLENDS TO ENHANCE DIFFERENTIATION.
6.3.2 EXPANSION INTO EMERGING MARKETS WITH RISING DEMAND FOR PREMIUM NON-ALCOHOLIC BEVERAGES
6.3.3 STRATEGIC PARTNERSHIPS WITH FITNESS, WELLNESS, AND HOSPITALITY SECTORS TO INCREASE CONSUMER AWARENESS AND TRIAL
6.4 CHALLENGES
6.4.1 COMPETITION FROM SUBSTITUTES SUCH AS SPARKLING WATER, KOMBUCHA, AND NON-ALCOHOLIC BEERS.
6.4.2 MANAGING LOGISTICS AND DISTRIBUTION COSTS, ESPECIALLY FOR DTC AND SUBSCRIPTION-BASED MODELS
7 NORTH AMERICA HOP WATER MARKET, BY PRODUCT TYPE
7.1 OVERVIEW
7.2 NORTH AMERICA HOP WATER MARKET, BY PRODUCT TYPE, 2018-2033 (USD THOUSAND)
7.2.1 CLASSIC
7.2.2 BLENDED
7.3 NORTH AMERICA HOP WATER MARKET, BY PRODUCT TYPE, 2018-2033 (THOUSAND LITRES)
7.3.1 CLASSIC
7.3.2 BLENDED
7.4 NORTH AMERICA CLASSIC IN HOP WATER MARKET, BY REGION, 2018-2033
7.4.1 NORTH AMERICA
7.4.2 EUROPE
7.4.3 ASIA-PACIFIC
7.4.4 SOUTH AMERICA
7.4.5 MIDDLE EAST AND AFRICA
7.5 NORTH AMERICA BLENDED IN HOP WATER MARKET, BY REGION, 2018-2033
7.5.1 NORTH AMERICA
7.5.2 EUROPE
7.5.3 ASIA-PACIFIC
7.5.4 SOUTH AMERICA
7.5.5 MIDDLE EAST AND AFRICA
8 NORTH AMERICA HOP WATER MARKET, BY FLAVOR
8.1 OVERVIEW
8.2 NORTH AMERICA HOP WATER MARKET, BY FLAVOR, 2018-2033 (USD THOUSAND)
8.2.1 WITH FLAVOR
8.2.2 WITHOUT FLAVOR
8.3 NORTH AMERICA HOP WATER MARKET, BY FLAVOR, 2018-2033 (THOUSAND LITRES)
8.3.1 WITH FLAVOR
8.3.2 WITHOUT FLAVOR
8.4 NORTH AMERICA WITH FLAVOR IN HOP WATER MARKET, BY TYPE, 2018-2033 (USD THOUSAND)
8.4.1 CITRUS
8.4.2 FRUITS
8.4.3 BERRIES
8.4.4 HERBAL
8.4.5 OTHERS
8.5 NORTH AMERICA CITRUS IN HOP WATER MARKET, BY TYPE, 2018-2033 (USD THOUSAND)
8.5.1 LIME
8.5.2 LEMON
8.5.3 ORANGE
8.5.4 OTHERS
8.6 NORTH AMERICA FRUITS IN HOP WATER MARKET, BY TYPE, 2018-2033 (USD THOUSAND)
8.6.1 MANGO
8.6.2 PEACH
8.6.3 PINEAPPLE
8.6.4 APPLE
8.6.5 GUAVA
8.6.6 GRAPES
8.6.7 COCONUT
8.6.8 OTHERS
8.7 NORTH AMERICA BERRIES IN HOP WATER MARKET, BY TYPE, 2018-2033 (USD THOUSAND)
8.7.1 RASPBERRY
8.7.2 STRAWBERRY
8.7.3 BLUEBERRY
8.7.4 OTHERS
8.8 NORTH AMERICA HERBAL IN HOP WATER MARKET, BY TYPE, 2018-2033 (USD THOUSAND)
8.8.1 MINT
8.8.2 GINGER
8.8.3 CUCUMBER
8.8.4 KOMBUCHA (TEA)
8.9 NORTH AMERICA WITH FLAVOR IN HOP WATER MARKET, BY REGION, 2018-2033
8.9.1 NORTH AMERICA
8.9.2 EUROPE
8.9.3 ASIA-PACIFIC
8.9.4 SOUTH AMERICA
8.9.5 MIDDLE EAST AND AFRICA
8.1 NORTH AMERICA WITHOUT FLAVOR IN HOP WATER MARKET, BY REGION, 2018-2033
8.10.1 NORTH AMERICA
8.10.2 EUROPE
8.10.3 ASIA-PACIFIC
8.10.4 SOUTH AMERICA
8.10.5 MIDDLE EAST AND AFRICA
9 NORTH AMERICA HOP WATER MARKET, BY CARBONATION LEVEL
9.1 OVERVIEW
9.2 NORTH AMERICA HOP WATER MARKET, BY CARBONATION LEVEL, 2018-2033 (USD THOUSAND)
9.2.1 LOW CARBONATED
9.2.2 MEDIUM CARBONATED
9.2.3 HIGHLY CARBONATED
9.3 NORTH AMERICA LOW CARBONATED IN HOP WATER MARKET, BY REGION, 2018-2033
9.3.1 NORTH AMERICA
9.3.2 EUROPE
9.3.3 ASIA-PACIFIC
9.3.4 SOUTH AMERICA
9.3.5 MIDDLE EAST AND AFRICA
9.4 NORTH AMERICA MEDIUM CARBONATED IN HOP WATER MARKET, BY REGION, 2018-2033
9.4.1 NORTH AMERICA
9.4.2 EUROPE
9.4.3 ASIA-PACIFIC
9.4.4 SOUTH AMERICA
9.4.5 MIDDLE EAST AND AFRICA
9.5 NORTH AMERICA HIGHLY CARBONATED IN HOP WATER MARKET, BY REGION, 2018-2033
9.5.1 NORTH AMERICA
9.5.2 EUROPE
9.5.3 ASIA-PACIFIC
9.5.4 SOUTH AMERICA
9.5.5 MIDDLE EAST AND AFRICA
10 NORTH AMERICA HOP WATER MARKET, BY PACKAGING
10.1 OVERVIEW
10.2 NORTH AMERICA HOP WATER MARKET, BY PACKAGING, 2018-2033 (USD THOUSAND)
10.2.1 ALUMINIUM CANS
10.2.2 BOTTLES
10.2.3 KEGS/BARREL
10.2.4 POUCHES
10.2.5 OTHERS
10.3 NORTH AMERICA ALUMINIUM CANS IN HOP WATER MARKET, BY PACKAGING QUANTITY, 2018-2033 (USD THOUSAND)
10.3.1 250–500 ML
10.3.2 MORE THAN 500 ML
10.3.3 LESS THAN 250 ML
10.4 NORTH AMERICA ALUMINIUM CANS IN HOP WATER MARKET, BY REGION, 2018-2033
10.4.1 NORTH AMERICA
10.4.2 EUROPE
10.4.3 ASIA-PACIFIC
10.4.4 SOUTH AMERICA
10.4.5 MIDDLE EAST AND AFRICA
10.5 NORTH AMERICA BOTTLES IN HOP WATER MARKET, BY MATERIAL, 2018-2033 (USD THOUSAND)
10.5.1 GLASS
10.5.2 PLASTIC
10.6 NORTH AMERICA PLASTIC IN HOP WATER MARKET, BY TYPE, 2018-2033 (USD THOUSAND)
10.6.1 PET /PETE
10.6.2 HDPE
10.6.3 PLA
10.6.4 OTHERS
10.7 NORTH AMERICA BOTTLES IN HOP WATER MARKET, BY PACKAGING QUANTITY, 2018-2033 (USD THOUSAND)
10.7.1 250–500 ML
10.7.2 LESS THAN 250 ML
10.7.3 500–1000 ML
10.7.4 1000–2000 ML
10.7.5 MORE THAN 2000 ML
10.8 NORTH AMERICA BOTTLES IN HOP WATER MARKET, BY REGION, 2018-2033
10.8.1 NORTH AMERICA
10.8.2 EUROPE
10.8.3 ASIA-PACIFIC
10.8.4 SOUTH AMERICA
10.8.5 MIDDLE EAST AND AFRICA
10.9 NORTH AMERICA KEGS/BARREL IN HOP WATER MARKET, BY PACKAGING QUANTITY, 2018-2033 (USD THOUSAND)
10.9.1 15–25 L
10.9.2 5–15 L
10.9.3 MORE THAN 25 L
10.9.4 UP TO 5 L
10.1 NORTH AMERICA KEGS/BARREL IN HOP WATER MARKET, BY REGION, 2018-2033
10.10.1 NORTH AMERICA
10.10.2 EUROPE
10.10.3 ASIA-PACIFIC
10.10.4 SOUTH AMERICA
10.10.5 MIDDLE EAST AND AFRICA
10.11 NORTH AMERICA POUCHES IN HOP WATER MARKET, BY MATERIAL, 2018-2033 (USD THOUSAND)
10.11.1 POLYETHYLENE (PE)
10.11.2 POLYPROPYLENE (PP)
10.11.3 POLYETHYLENE TEREPHTHALATE (PET)
10.11.4 OTHERS
10.12 NORTH AMERICA POUCHES IN HOP WATER MARKET, BY PACKAGING QUANTITY, 2018-2033 (USD THOUSAND)
10.12.1 250–500 ML
10.12.2 LESS THAN 250 ML
10.12.3 MORE THAN 500 ML
10.13 NORTH AMERICA POUCHES IN HOP WATER MARKET, BY REGION, 2018-2033
10.13.1 NORTH AMERICA
10.13.2 EUROPE
10.13.3 ASIA-PACIFIC
10.13.4 SOUTH AMERICA
10.13.5 MIDDLE EAST AND AFRICA
10.14 NORTH AMERICA OTHERS IN HOP WATER MARKET, BY REGION, 2018-2033
10.14.1 NORTH AMERICA
10.14.2 EUROPE
10.14.3 ASIA-PACIFIC
10.14.4 SOUTH AMERICA
10.14.5 MIDDLE EAST AND AFRICA
11 NORTH AMERICA HOP WATER MARKET, BY PRICE
11.1 OVERVIEW
11.2 NORTH AMERICA HOP WATER MARKET, BY PRICE, 2018-2033 (USD THOUSAND)
11.2.1 2–5 USD
11.2.2 UP TO 2 USD
11.2.3 5–10 USD
11.2.4 ABOVE 10 USD
11.3 NORTH AMERICA 2–5 USD IN HOP WATER MARKET, BY REGION, 2018-2033
11.3.1 NORTH AMERICA
11.3.2 EUROPE
11.3.3 ASIA-PACIFIC
11.3.4 SOUTH AMERICA
11.3.5 MIDDLE EAST AND AFRICA
11.4 NORTH AMERICA UP TO 2 USD IN HOP WATER MARKET, BY REGION, 2018-2033
11.4.1 NORTH AMERICA
11.4.2 EUROPE
11.4.3 ASIA-PACIFIC
11.4.4 SOUTH AMERICA
11.4.5 MIDDLE EAST AND AFRICA
11.5 NORTH AMERICA 5–10 USD IN HOP WATER MARKET, BY REGION, 2018-2033
11.5.1 NORTH AMERICA
11.5.2 EUROPE
11.5.3 ASIA-PACIFIC
11.5.4 SOUTH AMERICA
11.5.5 MIDDLE EAST AND AFRICA
11.6 NORTH AMERICA ABOVE 10 USD IN HOP WATER MARKET, BY REGION, 2018-2033
11.6.1 NORTH AMERICA
11.6.2 EUROPE
11.6.3 ASIA-PACIFIC
11.6.4 SOUTH AMERICA
11.6.5 MIDDLE EAST AND AFRICA
12 NORTH AMERICA HOP WATER MARKET, BY APPLICATION
12.1 OVERVIEW
12.2 NORTH AMERICA HOP WATER MARKET, BY APPLICATION, 2018-2033 (USD THOUSAND)
12.2.1 FITNESS & WELLNESS
12.2.2 MIXERS FOR ALCOHOLIC BEVERAGES
12.2.3 CULINARY USE
12.2.4 MEDICAL & THERAPEUTIC USE
12.2.5 OTHERS
12.3 NORTH AMERICA FITNESS & WELLNESS IN HOP WATER MARKET, BY TYPE, 2018-2033 (USD THOUSAND)
12.3.1 PRE-WORKOUT HYDRATION
12.3.2 POST-WORKOUT RECOVERY
12.3.3 DETOX
12.3.4 OTHERS
12.4 NORTH AMERICA FITNESS & WELLNESS IN HOP WATER MARKET, BY REGION, 2018-2033
12.4.1 NORTH AMERICA
12.4.2 EUROPE
12.4.3 ASIA-PACIFIC
12.4.4 SOUTH AMERICA
12.4.5 MIDDLE EAST AND AFRICA
12.5 NORTH AMERICA MIXERS FOR ALCOHOLIC BEVERAGES IN HOP WATER MARKET, BY TYPE, 2018-2033 (USD THOUSAND)
12.5.1 GIN & TONIC COMBINATIONS
12.5.2 VODKA MIXERS
12.5.3 WHISKEY HIGHBALLS
12.5.4 WINE SPRITZERS
12.5.5 OTHERS
12.6 NORTH AMERICA MIXERS FOR ALCOHOLIC BEVERAGES IN HOP WATER MARKET, BY REGION, 2018-2033
12.6.1 NORTH AMERICA
12.6.2 EUROPE
12.6.3 ASIA-PACIFIC
12.6.4 SOUTH AMERICA
12.6.5 MIDDLE EAST AND AFRICA
12.7 NORTH AMERICA CULINARY USE IN HOP WATER MARKET, BY TYPE, 2018-2033 (USD THOUSAND)
12.7.1 COOKING & RECIPE INGREDIENT
12.7.2 DEGLAZING & MARINATING
12.7.3 BAKING
12.7.4 OTHERS
12.8 NORTH AMERICA CULINARY USE IN HOP WATER MARKET, BY REGION, 2018-2033
12.8.1 NORTH AMERICA
12.8.2 EUROPE
12.8.3 ASIA-PACIFIC
12.8.4 SOUTH AMERICA
12.8.5 MIDDLE EAST AND AFRICA
12.9 NORTH AMERICA MEDICAL & THERAPEUTIC USE IN HOP WATER MARKET, BY TYPE, 2018-2033 (USD THOUSAND)
12.9.1 DIGESTIVE AID
12.9.2 IBS
12.9.3 GERD-FRIENDLY OPTIONS
12.9.4 OTHERS
12.1 NORTH AMERICA MEDICAL & THERAPEUTIC USE IN HOP WATER MARKET, BY REGION, 2018-2033
12.10.1 NORTH AMERICA
12.10.2 EUROPE
12.10.3 ASIA-PACIFIC
12.10.4 SOUTH AMERICA
12.10.5 MIDDLE EAST AND AFRICA
12.11 NORTH AMERICA OTHERS IN HOP WATER MARKET, BY REGION, 2018-2033
12.11.1 NORTH AMERICA
12.11.2 EUROPE
12.11.3 ASIA-PACIFIC
12.11.4 SOUTH AMERICA
12.11.5 MIDDLE EAST AND AFRICA
13 NORTH AMERICA HOP WATER MARKET, BY END USER
13.1 OVERVIEW
13.2 NORTH AMERICA HOP WATER MARKET, BY END USER, 2018-2033 (USD THOUSAND)
13.2.1 HOUSEHOLD/RESIDENTIAL
13.2.2 COMMERCIAL
13.2.3 INSTITUTIONAL
13.3 NORTH AMERICA HOUSEHOLD/RESIDENTIAL IN HOP WATER MARKET, BY REGION, 2018-2033
13.3.1 NORTH AMERICA
13.3.2 EUROPE
13.3.3 ASIA-PACIFIC
13.3.4 SOUTH AMERICA
13.3.5 MIDDLE EAST AND AFRICA
13.4 NORTH AMERICA COMMERCIAL IN HOP WATER MARKET, BY TYPE, 2018-2033 (USD THOUSAND)
13.4.1 RESTAURANTS
13.4.2 BARS
13.4.3 CAFÉ
13.4.4 HOTEL
13.4.5 AIRPORT
13.4.6 RAILWAY/METRO STATION
13.4.7 BUS STATION
13.4.8 OTHERS
13.5 NORTH AMERICA RESTAURANTS IN HOP WATER MARKET, BY TYPE, 2018-2033 (USD THOUSAND)
13.5.1 FSR
13.5.2 QSR
13.6 NORTH AMERICA COMMERCIAL IN HOP WATER MARKET, BY PRODUCT TYPE, 2018-2033 (USD THOUSAND)
13.6.1 CLASSIC
13.6.2 BLENDED
13.7 NORTH AMERICA COMMERCIAL IN HOP WATER MARKET, BY REGION, 2018-2033
13.7.1 NORTH AMERICA
13.7.2 EUROPE
13.7.3 ASIA-PACIFIC
13.7.4 SOUTH AMERICA
13.7.5 MIDDLE EAST AND AFRICA
13.8 NORTH AMERICA INSTITUTIONAL IN HOP WATER MARKET, BY TYPE, 2018-2033 (USD THOUSAND)
13.8.1 HEALTHCARE FACILITIES
13.8.2 EDUCATIONAL INSTITUTES
13.8.3 MILITARY FACILITES
13.8.4 OTHERS
13.9 NORTH AMERICA HEALTHCARE FACILITIES IN HOP WATER MARKET, BY TYPE, 2018-2033 (USD THOUSAND)
13.9.1 HOSPITALS
13.9.2 SPA CENTER
13.9.3 REHABILITATION CENTERS
13.9.4 OTHERS
13.1 NORTH AMERICA SPA CENTER IN HOP WATER MARKET, BY TYPE, 2018-2033 (USD THOUSAND)
13.10.1 HYDRATION STATIONS IN SPA LOBBIES
13.10.2 DETOX & CLEANSE PACKAGES
13.10.3 INCLUDED IN SKIN & BEAUTY TREATMENTS
13.10.4 CLOGS CLEANING
13.10.5 OTHERS
13.11 NORTH AMERICA EDUCATIONAL INSTITUTES USE IN HOP WATER MARKET, BY TYPE, 2018-2033 (USD THOUSAND)
13.11.1 UNIVERSITIES
13.11.2 COLLEGES
13.11.3 SCHOOLS
13.11.4 OTHERS
13.12 NORTH AMERICA INSTITUTIONAL IN HOP WATER MARKET, BY PRODUCT TYPE, 2018-2033 (USD THOUSAND)
13.12.1 BLENDED
13.12.2 CLASSIC
13.13 NORTH AMERICA INSTITUTIONAL IN HOP WATER MARKET, BY REGION, 2018-2033
13.13.1 NORTH AMERICA
13.13.2 EUROPE
13.13.3 ASIA-PACIFIC
13.13.4 SOUTH AMERICA
13.13.5 MIDDLE EAST AND AFRICA
14 NORTH AMERICA HOP WATER MARKET, BY DISTRIBUTION CHANNEL
14.1 OVERVIEW
14.2 NORTH AMERICA HOP WATER MARKET, BY DISTRIBUTION CHANNEL, 2018-2033 (USD THOUSAND)
14.2.1 STORE BASED
14.2.2 NON-STORE BASED
14.3 NORTH AMERICA STORE BASED IN HOP WATER MARKET, BY TYPE, 2018-2033 (USD THOUSAND)
14.3.1 SUPERMARKETS & HYPERMARKETS
14.3.2 GROCERY STORES
14.3.3 CONVENIENCE STORES
14.3.4 HEALTH & WELLNESS STORES
14.3.5 SPECIALTY BEVERAGE STORES
14.3.6 CLUB/WHOLESALE STORES
14.3.7 DISCOUNT STORES
14.3.8 COMPANY OUTLETS/STORES
14.3.9 OTHERS
14.4 NORTH AMERICA STORE BASED IN HOP WATER MARKET, BY REGION, 2018-2033
14.4.1 NORTH AMERICA
14.4.2 EUROPE
14.4.3 ASIA-PACIFIC
14.4.4 SOUTH AMERICA
14.4.5 MIDDLE EAST AND AFRICA
14.5 NORTH AMERICA NON-STORE BASED IN HOP WATER MARKET, BY TYPE, 2018-2033 (USD THOUSAND)
14.5.1 THIRD PARTY E-COMMERCE
14.5.2 COMPANY OWNED WEBSITE
14.6 NORTH AMERICA NON-STORE BASED IN HOP WATER MARKET, BY REGION, 2018-2033
14.6.1 NORTH AMERICA
14.6.2 EUROPE
14.6.3 ASIA-PACIFIC
14.6.4 SOUTH AMERICA
14.6.5 MIDDLE EAST AND AFRICA
15 NORTH AMERICA HOP WATER MARKET, BY REGION
15.1 NORTH AMERICA
15.1.1 U.S.
15.1.2 CANADA
15.1.3 MEXICO
16 NORTH AMERICA HOP WATER MARKET
16.1 COMPANY SHARE ANALYSIS: GLOBAL
17 SWOT ANALYSIS
18 COMPANY PROFILE
18.1 LAGUNITAS BREWING COMPANY
18.1.1 COMPANY SNAPSHOT
18.1.2 COMPANY SHARE ANALYSIS
18.1.3 PRODUCT PORTFOLIO
18.1.4 RECENT DEVELOPMENT
18.2 SIERRA NEVADA BREWING CO.
18.2.1 COMPANY SNAPSHOT
18.2.2 COMPANY SHARE ANALYSIS
18.2.3 PRODUCT PORTFOLIO
18.2.4 RECENT DEVELOPMENT
18.3 ATHLETIC BREWING COMPANY LLC.
18.3.1 COMPANY SNAPSHOT
18.3.2 COMPANY SHARE ANALYSIS
18.3.3 PRODUCT PORTFOLIO
18.3.4 RECENT DEVELOPMENT
18.4 DR HOPS.
18.4.1 COMPANY SNAPSHOT
18.4.2 COMPANY SHARE ANALYSIS
18.4.3 PRODUCT PORTFOLIO
18.4.4 RECENT DEVELOPMENT
18.5 CABIN BREWING COMPANY.
18.5.1 COMPANY SNAPSHOT
18.5.2 PRODUCT PORTFOLIO
18.5.3 RECENT DEVELOPMENT
18.6 HOPLARK
18.6.1 COMPANY SNAPSHOT
18.6.2 COMPANY SHARE ANALYSIS
18.6.3 PRODUCT PORTFOLIO
18.6.4 RECENT DEVELOPMENT
18.7 HOP WTR
18.7.1 COMPANY SNAPSHOT
18.7.2 COMPANY SHARE ANALYSIS
18.7.3 PRODUCT PORTFOLIO
18.7.4 RECENT DEVELOPMENT
18.8 ABITA BREWING COMPANY
18.8.1 COMPANY SNAPSHOT
18.8.2 PRODUCT PORTFOLIO
18.8.3 RECENT DEVELOPMENT
18.9 BURLINGTON BEER COMPANY
18.9.1 COMPANY SNAPSHOT
18.9.2 PRODUCT PORTFOLIO
18.9.3 RECENT DEVELOPMENT
18.1 DENVER BEER CO.
18.10.1 COMPANY SNAPSHOT
18.10.2 PRODUCT PORTFOLIO
18.10.3 RECENT DEVELOPMENT
18.11 DESCHUTES BREWERY.
18.11.1 COMPANY SNAPSHOT
18.11.2 PRODUCT PORTFOLIO
18.11.3 RECENT DEVELOPMENT
18.12 FIELDWORK BREWING CO
18.12.1 COMPANY SNAPSHOT
18.12.2 PRODUCT PORTFOLIO
18.12.3 RECENT DEVELOPMENT
18.13 FOUNDERS BREWING CO.
18.13.1 COMPANY SNAPSHOT
18.13.2 PRODUCT PORTFOLIO
18.13.3 RECENT DEVELOPMENT
18.14 GRIFFIN CLAW BREWING COMPANY
18.14.1 COMPANY SNAPSHOT
18.14.2 PRODUCT PORTFOLIO
18.14.3 RECENT DEVELOPMENT
18.15 H2OPS SPARKLING HOP WATER
18.15.1 COMPANY SNAPSHOT
18.15.2 PRODUCT PORTFOLIO
18.15.3 RECENT DEVEOPMENT
18.16 CRAFTZERO
18.16.1 COMPANY SNAPSHOT
18.16.2 PRODUCT PORTFOLIO
18.16.3 RECENT DEVELOPMENT
18.17 PELICAN BREWING COMPANY
18.17.1 COMPANY SNAPSHOT
18.17.2 PRODUCT PORTFOLIO
18.17.3 RECENT DEVEOPMENT
18.18 SURLY BREWING CO.
18.18.1 COMPANY SNAPSHOT
18.18.2 PRODUCT PORTFOLIO
18.18.3 RECENT DEVELOPMENT
18.19 UNTITLED ART
18.19.1 COMPANY SNAPSHOT
18.19.2 PRODUCT PORTFOLIO
18.19.3 RECENT DEVEOPMENT
18.2 WOODEN HILL BREWING
18.20.1 COMPANY SNAPSHOT
18.20.2 PRODUCT PORTFOLIO
18.20.3 RECENT DEVELOPMENT
18.21 PARTAKE BREWING
18.21.1 COMPANY SNAPSHOT
18.21.2 PRODUCT PORTFOLIO
18.21.3 RECENT DEVELOPMENT
18.22 BREWDOG
18.22.1 COMPANY SNAPSHOT
18.22.2 PRODUCT PORTFOLIO
18.22.3 RECENT DEVEOPMENT
18.23 THE NEW BAR
18.23.1 COMPANY SNAPSHOT
18.23.2 PRODUCT PORTFOLIO
18.23.3 RECENT DEVELOPMENT
18.24 PERFECT PEAKS BREWS
18.24.1 COMPANY SNAPSHOT
18.24.2 PRODUCT PORTFOLIO
18.24.3 RECENT DEVELOPMENT
19 QUESTIONNAIRE
20 RELATED REPORT
List of Table
TABLE 1 COMPANY SHARE ANALYSIS: IMPORT IN GCC
TABLE 2 UNITED ARAB EMIRATES, BY SOURCE OF COUNTRY (USD THOUSAND)
TABLE 3 UNITED ARAB EMIRATES, BY SOURCE OF COUNTRY (THOUSAND LITRES)
TABLE 4 SAUDI ARABIA, BY SOURCE OF COUNTRY (USD THOUSAND)
TABLE 5 SAUDI ARABIA, BY SOURCE OF COUNTRY (THOUSAND LITRES)
TABLE 6 QATAR, BY SOURCE OF COUNTRY (USD THOUSAND)
TABLE 7 QATAR, BY SOURCE OF COUNTRY (THOUSAND LITRES)
TABLE 8 BAHRAIN, BY SOURCE OF COUNTRY (USD THOUSAND)
TABLE 9 BAHRAIN, BY SOURCE OF COUNTRY (THOUSAND LITRES)
TABLE 10 KUWAIT, BY SOURCE OF COUNTRY (USD THOUSAND)
TABLE 11 KUWAIT, BY SOURCE OF COUNTRY (THOUSAND LITRES)
TABLE 12 OMAN, BY SOURCE OF COUNTRY (USD THOUSAND)
TABLE 13 OMAN, BY SOURCE OF COUNTRY (THOUSAND LITRES)
TABLE 14 SUMMARY OF MARKET STAGE OF DEVELOPMENT — NORTH AMERICA HOP WATER MARKET
TABLE 15 SUMMARY OF KEY TIMELINES AND MILESTONES OF THE HOP WATER MARKET
TABLE 16 INNOVATION STRATEGIES AND METHODOLOGIES IN THE HOP WATER MARKET
TABLE 17 RISK ASSESSMENT AND MITIGATION STRATEGIES — HOP WATER MARKET
TABLE 18 PROJECTED PRICE TREND OF THE NORTH AMERICA HOP WATER MARKET, 2025–2033 (USD PER LITRE)
TABLE 19 KEY STRATEGIC RECOMMENDATIONS AND EXPECTED IMPACT — HOP WATER MARKET
TABLE 20 STRATEGIC IMPACT OF KEY RAW MATERIALS ON PRICING, RISK, AND INNOVATION
TABLE 21 BRAND COMPARATIVE ANALYSIS
TABLE 22 COMPANY VS BRAND OVERVIEW
TABLE 23 CONSUMER BUYING BEHAVIOUR
TABLE 24 OVERVIEW OF TECHNOLOGICAL ADVANCEMENTS
TABLE 25 HARMONIZED SYSTEM (HS) CODES RELEVANT TO HOP WATER
TABLE 26 NORTH AMERICA HOP WATER MARKET, BY PRODUCT TYPE, 2018-2033 (USD THOUSAND)
TABLE 27 NORTH AMERICA HOP WATER MARKET, BY PRODUCT TYPE, 2018-2033 (THOUSAND LITRES)
TABLE 28 NORTH AMERICA CLASSIC IN HOP WATER MARKET, BY REGION, 2018-2033
TABLE 29 NORTH AMERICA BLENDED IN HOP WATER MARKET, BY REGION, 2018-2033
TABLE 30 NORTH AMERICA HOP WATER MARKET, BY FLAVOR, 2018-2033 (USD THOUSAND)
TABLE 31 NORTH AMERICA HOP WATER MARKET, BY FLAVOR, 2018-2033 (THOUSAND LITRES)
TABLE 32 NORTH AMERICA WITH FLAVOR IN HOP WATER MARKET, BY TYPE, 2018-2033 (USD THOUSAND)
TABLE 33 NORTH AMERICA CITRUS IN HOP WATER MARKET, BY TYPE, 2018-2033 (USD THOUSAND)
TABLE 34 NORTH AMERICA FRUITS IN HOP WATER MARKET, BY TYPE, 2018-2033 (USD THOUSAND)
TABLE 35 NORTH AMERICA BERRIES IN HOP WATER MARKET, BY TYPE, 2018-2033 (USD THOUSAND)
TABLE 36 NORTH AMERICA HERBAL IN HOP WATER MARKET, BY TYPE, 2018-2033 (USD THOUSAND)
TABLE 37 NORTH AMERICA WITH FLAVOR IN HOP WATER MARKET, BY REGION, 2018-2033
TABLE 38 NORTH AMERICA WITHOUT FLAVOR IN HOP WATER MARKET, BY REGION, 2018-2033
TABLE 39 NORTH AMERICA HOP WATER MARKET, BY CARBONATION LEVEL, 2018-2033 (USD THOUSAND)
TABLE 40 NORTH AMERICA LOW CARBONATED IN HOP WATER MARKET, BY REGION, 2018-2033
TABLE 41 NORTH AMERICA MEDIUM CARBONATED IN HOP WATER MARKET, BY REGION, 2018-2033
TABLE 42 NORTH AMERICA HIGHLY CARBONATED IN HOP WATER MARKET, BY REGION, 2018-2033
TABLE 43 NORTH AMERICA HOP WATER MARKET, BY PACKAGING, 2018-2033 (USD THOUSAND)
TABLE 44 NORTH AMERICA ALUMINIUM CANS IN HOP WATER MARKET, BY PACKAGING QUANTITY, 2018-2033 (USD THOUSAND)
TABLE 45 NORTH AMERICA ALUMINIUM CANS IN HOP WATER MARKET, BY REGION, 2018-2033
TABLE 46 NORTH AMERICA BOTTLES IN HOP WATER MARKET, BY MATERIAL, 2018-2033 (USD THOUSAND)
TABLE 47 NORTH AMERICA PLASTIC IN HOP WATER MARKET, BY TYPE, 2018-2033 (USD THOUSAND)
TABLE 48 NORTH AMERICA BOTTLES IN HOP WATER MARKET, BY PACKAGING QUANTITY, 2018-2033 (USD THOUSAND)
TABLE 49 NORTH AMERICA BOTTLES IN HOP WATER MARKET, BY REGION, 2018-2033
TABLE 50 NORTH AMERICA KEGS/BARREL IN HOP WATER MARKET, BY PACKAGING QUANTITY, 2018-2033 (USD THOUSAND)
TABLE 51 NORTH AMERICA KEGS/BARREL IN HOP WATER MARKET, BY REGION, 2018-2033
TABLE 52 NORTH AMERICA POUCHES IN HOP WATER MARKET, BY MATERIAL, 2018-2033 (USD THOUSAND)
TABLE 53 NORTH AMERICA POUCHES IN HOP WATER MARKET, BY PACKAGING QUANTITY, 2018-2033 (USD THOUSAND)
TABLE 54 NORTH AMERICA POUCHES IN HOP WATER MARKET, BY REGION, 2018-2033
TABLE 55 NORTH AMERICA OTHERS IN HOP WATER MARKET, BY REGION, 2018-2033
TABLE 56 NORTH AMERICA HOP WATER MARKET, BY PRICE, 2018-2033 (USD THOUSAND)
TABLE 57 NORTH AMERICA 2–5 USD IN HOP WATER MARKET, BY REGION, 2018-2033
TABLE 58 NORTH AMERICA UP TO 2 USD IN HOP WATER MARKET, BY REGION, 2018-2033
TABLE 59 NORTH AMERICA 5–10 USD IN HOP WATER MARKET, BY REGION, 2018-2033
TABLE 60 NORTH AMERICA ABOVE 10 USD IN HOP WATER MARKET, BY REGION, 2018-2033
TABLE 61 NORTH AMERICA HOP WATER MARKET, BY APPLICATION, 2018-2033 (USD THOUSAND)
TABLE 62 NORTH AMERICA FITNESS & WELLNESS IN HOP WATER MARKET, BY TYPE, 2018-2033 (USD THOUSAND)
TABLE 63 NORTH AMERICA FITNESS & WELLNESS IN HOP WATER MARKET, BY REGION, 2018-2033
TABLE 64 NORTH AMERICA MIXERS FOR ALCOHOLIC BEVERAGES IN HOP WATER MARKET, BY TYPE, 2018-2033 (USD THOUSAND)
TABLE 65 NORTH AMERICA MIXERS FOR ALCOHOLIC BEVERAGES IN HOP WATER MARKET, BY REGION, 2018-2033
TABLE 66 NORTH AMERICA CULINARY USE IN HOP WATER MARKET, BY TYPE, 2018-2033 (USD THOUSAND)
TABLE 67 NORTH AMERICA CULINARY USE IN HOP WATER MARKET, BY REGION, 2018-2033
TABLE 68 NORTH AMERICA MEDICAL & THERAPEUTIC USE IN HOP WATER MARKET, BY TYPE, 2018-2033 (USD THOUSAND)
TABLE 69 NORTH AMERICA MEDICAL & THERAPEUTIC USE IN HOP WATER MARKET, BY REGION, 2018-2033
TABLE 70 NORTH AMERICA OTHERS IN HOP WATER MARKET, BY REGION, 2018-2033
TABLE 71 NORTH AMERICA HOP WATER MARKET, BY END USER, 2018-2033 (USD THOUSAND)
TABLE 72 NORTH AMERICA HOUSEHOLD/RESIDENTIAL IN HOP WATER MARKET, BY REGION, 2018-2033
TABLE 73 NORTH AMERICA COMMERCIAL IN HOP WATER MARKET, BY TYPE, 2018-2033 (USD THOUSAND)
TABLE 74 NORTH AMERICA RESTAURANTS IN HOP WATER MARKET, BY TYPE, 2018-2033 (USD THOUSAND)
TABLE 75 NORTH AMERICA COMMERCIAL IN HOP WATER MARKET, BY PRODUCT TYPE, 2018-2033 (USD THOUSAND)
TABLE 76 NORTH AMERICA COMMERCIAL IN HOP WATER MARKET, BY REGION, 2018-2033
TABLE 77 NORTH AMERICA INSTITUTIONAL IN HOP WATER MARKET, BY TYPE, 2018-2033 (USD THOUSAND)
TABLE 78 NORTH AMERICA HEALTHCARE FACILITIES IN HOP WATER MARKET, BY TYPE, 2018-2033 (USD THOUSAND)
TABLE 79 NORTH AMERICA SPA CENTER IN HOP WATER MARKET, BY TYPE, 2018-2033 (USD THOUSAND)
TABLE 80 NORTH AMERICA EDUCATIONAL INSTITUTES USE IN HOP WATER MARKET, BY TYPE, 2018-2033 (USD THOUSAND)
TABLE 81 NORTH AMERICA INSTITUTIONAL IN HOP WATER MARKET, BY PRODUCT TYPE, 2018-2033 (USD THOUSAND)
TABLE 82 NORTH AMERICA INSTITUTIONAL IN HOP WATER MARKET, BY REGION, 2018-2033
TABLE 83 NORTH AMERICA HOP WATER MARKET, BY DISTRIBUTION CHANNEL, 2018-2033 (USD THOUSAND)
TABLE 84 NORTH AMERICA STORE BASED IN HOP WATER MARKET, BY TYPE, 2018-2033 (USD THOUSAND)
TABLE 85 NORTH AMERICA STORE BASED IN HOP WATER MARKET, BY REGION, 2018-2033
TABLE 86 NORTH AMERICA NON-STORE BASED IN HOP WATER MARKET, BY TYPE, 2018-2033 (USD THOUSAND)
TABLE 87 NORTH AMERICA NON-STORE BASED IN HOP WATER MARKET, BY REGION, 2018-2033
TABLE 88 NORTH AMERICA NORTH AMERICA HOP WATER MARKET, BY COUNTRY, 2018-2033 (USD THOUSAND)
TABLE 89 NORTH AMERICA NORTH AMERICA HOP WATER MARKET, BY COUNTRY, 2018-2033 (THOUSAND LITRES)
TABLE 90 NORTH AMERICA HOP WATER MARKET, BY PRODUCT TYPE, 2018-2033 (USD THOUSAND)
TABLE 91 NORTH AMERICA HOP WATER MARKET, BY PRODUCT TYPE, 2018-2033 (THOUSAND LITRES)
TABLE 92 NORTH AMERICA HOP WATER MARKET, BY FLAVOR, 2018-2033 (USD THOUSAND)
TABLE 93 NORTH AMERICA HOP WATER MARKET, BY FLAVOR, 2018-2033 (THOUSAND LITRES)
TABLE 94 NORTH AMERICA WITH FLAVOR IN HOP WATER MARKET, BY TYPE, 2018-2033 (USD THOUSAND)
TABLE 95 NORTH AMERICA CITRUS IN HOP WATER MARKET, BY TYPE, 2018-2033 (USD THOUSAND)
TABLE 96 NORTH AMERICA FRUITS IN HOP WATER MARKET, BY TYPE, 2018-2033 (USD THOUSAND)
TABLE 97 NORTH AMERICA BERRIES IN HOP WATER MARKET, BY TYPE, 2018-2033 (USD THOUSAND)
TABLE 98 NORTH AMERICA HERBAL IN HOP WATER MARKET, BY TYPE, 2018-2033 (USD THOUSAND)
TABLE 99 NORTH AMERICA HOP WATER MARKET, BY CARBONATION LEVEL, 2018-2033 (USD THOUSAND)
TABLE 100 NORTH AMERICA HOP WATER MARKET, BY PACKAGING, 2018-2033 (USD THOUSAND)
TABLE 101 NORTH AMERICA ALUMINIUM CANS IN HOP WATER MARKET, BY PACKAGING QUANTITY, 2018-2033 (USD THOUSAND)
TABLE 102 NORTH AMERICA BOTTLES IN HOP WATER MARKET, BY MATERIAL, 2018-2033 (USD THOUSAND)
TABLE 103 NORTH AMERICA PLASTIC IN HOP WATER MARKET, BY TYPE, 2018-2033 (USD THOUSAND)
TABLE 104 NORTH AMERICA BOTTLES IN HOP WATER MARKET, BY PACKAGING QUANTITY, 2018-2033 (USD THOUSAND)
TABLE 105 NORTH AMERICA KEGS/BARREL IN HOP WATER MARKET, BY PACKAGING QUANTITY, 2018-2033 (USD THOUSAND)
TABLE 106 NORTH AMERICA POUCHES IN HOP WATER MARKET, BY MATERIAL, 2018-2033 (USD THOUSAND)
TABLE 107 NORTH AMERICA POUCHES IN HOP WATER MARKET, BY PACKAGING QUANTITY, 2018-2033 (USD THOUSAND)
TABLE 108 NORTH AMERICA HOP WATER MARKET, BY PRICE, 2018-2033 (USD THOUSAND)
TABLE 109 NORTH AMERICA HOP WATER MARKET, BY APPLICATION, 2018-2033 (USD THOUSAND)
TABLE 110 NORTH AMERICA FITNESS & WELLNESS IN HOP WATER MARKET, BY TYPE, 2018-2033 (USD THOUSAND)
TABLE 111 NORTH AMERICA MIXERS FOR ALCOHOLIC BEVERAGES IN HOP WATER MARKET, BY TYPE, 2018-2033 (USD THOUSAND)
TABLE 112 NORTH AMERICA CULINARY USE IN HOP WATER MARKET, BY TYPE, 2018-2033 (USD THOUSAND)
TABLE 113 NORTH AMERICA MEDICAL & THERAPEUTIC USE IN HOP WATER MARKET, BY TYPE, 2018-2033 (USD THOUSAND)
TABLE 114 NORTH AMERICA HOP WATER MARKET, BY END USER, 2018-2033 (USD THOUSAND)
TABLE 115 . NORTH AMERICA HOUSEHOLD/RESIDENTIAL IN HOP WATER MARKET, BY PRODUCT TYPE, 2018-2033 (USD THOUSAND)
TABLE 116 NORTH AMERICA COMMERCIAL IN HOP WATER MARKET, BY TYPE, 2018-2033 (USD THOUSAND)
TABLE 117 NORTH AMERICA RESTAURANTS IN HOP WATER MARKET, BY TYPE, 2018-2033 (USD THOUSAND)
TABLE 118 NORTH AMERICA COMMERCIAL IN HOP WATER MARKET, BY PRODUCT TYPE, 2018-2033 (USD THOUSAND)
TABLE 119 NORTH AMERICA INSTITUTIONAL IN HOP WATER MARKET, BY TYPE, 2018-2033 (USD THOUSAND)
TABLE 120 NORTH AMERICA HEALTHCARE FACILITIES IN HOP WATER MARKET, BY TYPE, 2018-2033 (USD THOUSAND)
TABLE 121 NORTH AMERICA SPA CENTER IN HOP WATER MARKET, BY TYPE, 2018-2033 (USD THOUSAND)
TABLE 122 NORTH AMERICA EDUCATIONAL INSTITUTES USE IN HOP WATER MARKET, BY TYPE, 2018-2033 (USD THOUSAND)
TABLE 123 NORTH AMERICA INSTITUTIONAL IN HOP WATER MARKET, BY PRODUCT TYPE, 2018-2033 (USD THOUSAND)
TABLE 124 NORTH AMERICA HOP WATER MARKET, BY DISTRIBUTION CHANNEL, 2018-2033 (USD THOUSAND)
TABLE 125 NORTH AMERICA STORE BASED IN HOP WATER MARKET, BY TYPE, 2018-2033 (USD THOUSAND)
TABLE 126 NORTH AMERICA NON-STORE BASED IN HOP WATER MARKET, BY TYPE, 2018-2033 (USD THOUSAND)
TABLE 127 U.S. HOP WATER MARKET, BY PRODUCT TYPE, 2018-2033 (USD THOUSAND)
TABLE 128 U.S. HOP WATER MARKET, BY PRODUCT TYPE, 2018-2033 (THOUSAND LITRES)
TABLE 129 U.S. HOP WATER MARKET, BY FLAVOR, 2018-2033 (USD THOUSAND)
TABLE 130 U.S. HOP WATER MARKET, BY FLAVOR, 2018-2033 (THOUSAND LITRES)
TABLE 131 U.S. WITH FLAVOR IN HOP WATER MARKET, BY TYPE, 2018-2033 (USD THOUSAND)
TABLE 132 U.S. CITRUS IN HOP WATER MARKET, BY TYPE, 2018-2033 (USD THOUSAND)
TABLE 133 U.S. FRUITS IN HOP WATER MARKET, BY TYPE, 2018-2033 (USD THOUSAND)
TABLE 134 U.S. BERRIES IN HOP WATER MARKET, BY TYPE, 2018-2033 (USD THOUSAND)
TABLE 135 U.S. HERBAL IN HOP WATER MARKET, BY TYPE, 2018-2033 (USD THOUSAND)
TABLE 136 U.S. HOP WATER MARKET, BY CARBONATION LEVEL, 2018-2033 (USD THOUSAND)
TABLE 137 U.S. HOP WATER MARKET, BY PACKAGING, 2018-2033 (USD THOUSAND)
TABLE 138 U.S. ALUMINIUM CANS IN HOP WATER MARKET, BY PACKAGING QUANTITY, 2018-2033 (USD THOUSAND)
TABLE 139 U.S. BOTTLES IN HOP WATER MARKET, BY MATERIAL, 2018-2033 (USD THOUSAND)
TABLE 140 U.S. PLASTIC IN HOP WATER MARKET, BY TYPE, 2018-2033 (USD THOUSAND)
TABLE 141 U.S. BOTTLES IN HOP WATER MARKET, BY PACKAGING QUANTITY, 2018-2033 (USD THOUSAND)
TABLE 142 U.S. KEGS/BARREL IN HOP WATER MARKET, BY PACKAGING QUANTITY, 2018-2033 (USD THOUSAND)
TABLE 143 U.S. POUCHES IN HOP WATER MARKET, BY MATERIAL, 2018-2033 (USD THOUSAND)
TABLE 144 U.S. POUCHES IN HOP WATER MARKET, BY PACKAGING QUANTITY, 2018-2033 (USD THOUSAND)
TABLE 145 U.S. HOP WATER MARKET, BY PRICE, 2018-2033 (USD THOUSAND)
TABLE 146 U.S. HOP WATER MARKET, BY APPLICATION, 2018-2033 (USD THOUSAND)
TABLE 147 U.S. FITNESS & WELLNESS IN HOP WATER MARKET, BY TYPE, 2018-2033 (USD THOUSAND)
TABLE 148 U.S. MIXERS FOR ALCOHOLIC BEVERAGES IN HOP WATER MARKET, BY TYPE, 2018-2033 (USD THOUSAND)
TABLE 149 U.S. CULINARY USE IN HOP WATER MARKET, BY TYPE, 2018-2033 (USD THOUSAND)
TABLE 150 U.S. MEDICAL & THERAPEUTIC USE IN HOP WATER MARKET, BY TYPE, 2018-2033 (USD THOUSAND)
TABLE 151 U.S. HOP WATER MARKET, BY END USER, 2018-2033 (USD THOUSAND)
TABLE 152 . U.S. HOUSEHOLD/RESIDENTIAL IN HOP WATER MARKET, BY PRODUCT TYPE, 2018-2033 (USD THOUSAND)
TABLE 153 U.S. COMMERCIAL IN HOP WATER MARKET, BY TYPE, 2018-2033 (USD THOUSAND)
TABLE 154 U.S. RESTAURANTS IN HOP WATER MARKET, BY TYPE, 2018-2033 (USD THOUSAND)
TABLE 155 U.S. COMMERCIAL IN HOP WATER MARKET, BY PRODUCT TYPE, 2018-2033 (USD THOUSAND)
TABLE 156 U.S. INSTITUTIONAL IN HOP WATER MARKET, BY TYPE, 2018-2033 (USD THOUSAND)
TABLE 157 U.S. HEALTHCARE FACILITIES IN HOP WATER MARKET, BY TYPE, 2018-2033 (USD THOUSAND)
TABLE 158 U.S. SPA CENTER IN HOP WATER MARKET, BY TYPE, 2018-2033 (USD THOUSAND)
TABLE 159 U.S. EDUCATIONAL INSTITUTES USE IN HOP WATER MARKET, BY TYPE, 2018-2033 (USD THOUSAND)
TABLE 160 U.S. INSTITUTIONAL IN HOP WATER MARKET, BY PRODUCT TYPE, 2018-2033 (USD THOUSAND)
TABLE 161 U.S. HOP WATER MARKET, BY DISTRIBUTION CHANNEL, 2018-2033 (USD THOUSAND)
TABLE 162 U.S. STORE BASED IN HOP WATER MARKET, BY TYPE, 2018-2033 (USD THOUSAND)
TABLE 163 U.S. NON-STORE BASED IN HOP WATER MARKET, BY TYPE, 2018-2033 (USD THOUSAND)
TABLE 164 CANADA HOP WATER MARKET, BY PRODUCT TYPE, 2018-2033 (USD THOUSAND)
TABLE 165 CANADA HOP WATER MARKET, BY PRODUCT TYPE, 2018-2033 (THOUSAND LITRES)
TABLE 166 CANADA HOP WATER MARKET, BY FLAVOR, 2018-2033 (USD THOUSAND)
TABLE 167 CANADA HOP WATER MARKET, BY FLAVOR, 2018-2033 (THOUSAND LITRES)
TABLE 168 CANADA WITH FLAVOR IN HOP WATER MARKET, BY TYPE, 2018-2033 (USD THOUSAND)
TABLE 169 CANADA CITRUS IN HOP WATER MARKET, BY TYPE, 2018-2033 (USD THOUSAND)
TABLE 170 CANADA FRUITS IN HOP WATER MARKET, BY TYPE, 2018-2033 (USD THOUSAND)
TABLE 171 CANADA BERRIES IN HOP WATER MARKET, BY TYPE, 2018-2033 (USD THOUSAND)
TABLE 172 CANADA HERBAL IN HOP WATER MARKET, BY TYPE, 2018-2033 (USD THOUSAND)
TABLE 173 CANADA HOP WATER MARKET, BY CARBONATION LEVEL, 2018-2033 (USD THOUSAND)
TABLE 174 CANADA HOP WATER MARKET, BY PACKAGING, 2018-2033 (USD THOUSAND)
TABLE 175 CANADA ALUMINIUM CANS IN HOP WATER MARKET, BY PACKAGING QUANTITY, 2018-2033 (USD THOUSAND)
TABLE 176 CANADA BOTTLES IN HOP WATER MARKET, BY MATERIAL, 2018-2033 (USD THOUSAND)
TABLE 177 CANADA PLASTIC IN HOP WATER MARKET, BY TYPE, 2018-2033 (USD THOUSAND)
TABLE 178 CANADA BOTTLES IN HOP WATER MARKET, BY PACKAGING QUANTITY, 2018-2033 (USD THOUSAND)
TABLE 179 CANADA KEGS/BARREL IN HOP WATER MARKET, BY PACKAGING QUANTITY, 2018-2033 (USD THOUSAND)
TABLE 180 CANADA POUCHES IN HOP WATER MARKET, BY MATERIAL, 2018-2033 (USD THOUSAND)
TABLE 181 CANADA POUCHES IN HOP WATER MARKET, BY PACKAGING QUANTITY, 2018-2033 (USD THOUSAND)
TABLE 182 CANADA HOP WATER MARKET, BY PRICE, 2018-2033 (USD THOUSAND)
TABLE 183 CANADA HOP WATER MARKET, BY APPLICATION, 2018-2033 (USD THOUSAND)
TABLE 184 CANADA FITNESS & WELLNESS IN HOP WATER MARKET, BY TYPE, 2018-2033 (USD THOUSAND)
TABLE 185 CANADA MIXERS FOR ALCOHOLIC BEVERAGES IN HOP WATER MARKET, BY TYPE, 2018-2033 (USD THOUSAND)
TABLE 186 CANADA CULINARY USE IN HOP WATER MARKET, BY TYPE, 2018-2033 (USD THOUSAND)
TABLE 187 CANADA MEDICAL & THERAPEUTIC USE IN HOP WATER MARKET, BY TYPE, 2018-2033 (USD THOUSAND)
TABLE 188 CANADA HOP WATER MARKET, BY END USER, 2018-2033 (USD THOUSAND)
TABLE 189 . CANADA HOUSEHOLD/RESIDENTIAL IN HOP WATER MARKET, BY PRODUCT TYPE, 2018-2033 (USD THOUSAND)
TABLE 190 CANADA COMMERCIAL IN HOP WATER MARKET, BY TYPE, 2018-2033 (USD THOUSAND)
TABLE 191 CANADA RESTAURANTS IN HOP WATER MARKET, BY TYPE, 2018-2033 (USD THOUSAND)
TABLE 192 CANADA COMMERCIAL IN HOP WATER MARKET, BY PRODUCT TYPE, 2018-2033 (USD THOUSAND)
TABLE 193 CANADA INSTITUTIONAL IN HOP WATER MARKET, BY TYPE, 2018-2033 (USD THOUSAND)
TABLE 194 CANADA HEALTHCARE FACILITIES IN HOP WATER MARKET, BY TYPE, 2018-2033 (USD THOUSAND)
TABLE 195 CANADA SPA CENTER IN HOP WATER MARKET, BY TYPE, 2018-2033 (USD THOUSAND)
TABLE 196 CANADA EDUCATIONAL INSTITUTES USE IN HOP WATER MARKET, BY TYPE, 2018-2033 (USD THOUSAND)
TABLE 197 CANADA INSTITUTIONAL IN HOP WATER MARKET, BY PRODUCT TYPE, 2018-2033 (USD THOUSAND)
TABLE 198 CANADA HOP WATER MARKET, BY DISTRIBUTION CHANNEL, 2018-2033 (USD THOUSAND)
TABLE 199 CANADA STORE BASED IN HOP WATER MARKET, BY TYPE, 2018-2033 (USD THOUSAND)
TABLE 200 CANADA NON-STORE BASED IN HOP WATER MARKET, BY TYPE, 2018-2033 (USD THOUSAND)
TABLE 201 MEXICO HOP WATER MARKET, BY PRODUCT TYPE, 2018-2033 (USD THOUSAND)
TABLE 202 MEXICO HOP WATER MARKET, BY PRODUCT TYPE, 2018-2033 (THOUSAND LITRES)
TABLE 203 MEXICO HOP WATER MARKET, BY FLAVOR, 2018-2033 (USD THOUSAND)
TABLE 204 MEXICO HOP WATER MARKET, BY FLAVOR, 2018-2033 (THOUSAND LITRES)
TABLE 205 MEXICO WITH FLAVOR IN HOP WATER MARKET, BY TYPE, 2018-2033 (USD THOUSAND)
TABLE 206 MEXICO CITRUS IN HOP WATER MARKET, BY TYPE, 2018-2033 (USD THOUSAND)
TABLE 207 MEXICO FRUITS IN HOP WATER MARKET, BY TYPE, 2018-2033 (USD THOUSAND)
TABLE 208 MEXICO BERRIES IN HOP WATER MARKET, BY TYPE, 2018-2033 (USD THOUSAND)
TABLE 209 MEXICO HERBAL IN HOP WATER MARKET, BY TYPE, 2018-2033 (USD THOUSAND)
TABLE 210 MEXICO HOP WATER MARKET, BY CARBONATION LEVEL, 2018-2033 (USD THOUSAND)
TABLE 211 MEXICO HOP WATER MARKET, BY PACKAGING, 2018-2033 (USD THOUSAND)
TABLE 212 MEXICO ALUMINIUM CANS IN HOP WATER MARKET, BY PACKAGING QUANTITY, 2018-2033 (USD THOUSAND)
TABLE 213 MEXICO BOTTLES IN HOP WATER MARKET, BY MATERIAL, 2018-2033 (USD THOUSAND)
TABLE 214 MEXICO PLASTIC IN HOP WATER MARKET, BY TYPE, 2018-2033 (USD THOUSAND)
TABLE 215 MEXICO BOTTLES IN HOP WATER MARKET, BY PACKAGING QUANTITY, 2018-2033 (USD THOUSAND)
TABLE 216 MEXICO KEGS/BARREL IN HOP WATER MARKET, BY PACKAGING QUANTITY, 2018-2033 (USD THOUSAND)
TABLE 217 MEXICO POUCHES IN HOP WATER MARKET, BY MATERIAL, 2018-2033 (USD THOUSAND)
TABLE 218 MEXICO POUCHES IN HOP WATER MARKET, BY PACKAGING QUANTITY, 2018-2033 (USD THOUSAND)
TABLE 219 MEXICO HOP WATER MARKET, BY PRICE, 2018-2033 (USD THOUSAND)
TABLE 220 MEXICO HOP WATER MARKET, BY APPLICATION, 2018-2033 (USD THOUSAND)
TABLE 221 MEXICO FITNESS & WELLNESS IN HOP WATER MARKET, BY TYPE, 2018-2033 (USD THOUSAND)
TABLE 222 MEXICO MIXERS FOR ALCOHOLIC BEVERAGES IN HOP WATER MARKET, BY TYPE, 2018-2033 (USD THOUSAND)
TABLE 223 MEXICO CULINARY USE IN HOP WATER MARKET, BY TYPE, 2018-2033 (USD THOUSAND)
TABLE 224 MEXICO MEDICAL & THERAPEUTIC USE IN HOP WATER MARKET, BY TYPE, 2018-2033 (USD THOUSAND)
TABLE 225 MEXICO HOP WATER MARKET, BY END USER, 2018-2033 (USD THOUSAND)
TABLE 226 . MEXICO HOUSEHOLD/RESIDENTIAL IN HOP WATER MARKET, BY PRODUCT TYPE, 2018-2033 (USD THOUSAND)
TABLE 227 MEXICO COMMERCIAL IN HOP WATER MARKET, BY TYPE, 2018-2033 (USD THOUSAND)
TABLE 228 MEXICO RESTAURANTS IN HOP WATER MARKET, BY TYPE, 2018-2033 (USD THOUSAND)
TABLE 229 MEXICO COMMERCIAL IN HOP WATER MARKET, BY PRODUCT TYPE, 2018-2033 (USD THOUSAND)
TABLE 230 MEXICO INSTITUTIONAL IN HOP WATER MARKET, BY TYPE, 2018-2033 (USD THOUSAND)
TABLE 231 MEXICO HEALTHCARE FACILITIES IN HOP WATER MARKET, BY TYPE, 2018-2033 (USD THOUSAND)
TABLE 232 MEXICO SPA CENTER IN HOP WATER MARKET, BY TYPE, 2018-2033 (USD THOUSAND)
TABLE 233 MEXICO EDUCATIONAL INSTITUTES USE IN HOP WATER MARKET, BY TYPE, 2018-2033 (USD THOUSAND)
TABLE 234 MEXICO INSTITUTIONAL IN HOP WATER MARKET, BY PRODUCT TYPE, 2018-2033 (USD THOUSAND)
TABLE 235 MEXICO HOP WATER MARKET, BY DISTRIBUTION CHANNEL, 2018-2033 (USD THOUSAND)
TABLE 236 MEXICO STORE BASED IN HOP WATER MARKET, BY TYPE, 2018-2033 (USD THOUSAND)
TABLE 237 MEXICO NON-STORE BASED IN HOP WATER MARKET, BY TYPE, 2018-2033 (USD THOUSAND)
List of Figure
FIGURE 1 NORTH AMERICA HOP WATER MARKET: SEGMENTATION
FIGURE 2 NORTH AMERICA HOP WATER MARKET: DATA TRIANGULATION
FIGURE 3 NORTH AMERICA HOP WATER MARKET: DROC ANALYSIS
FIGURE 4 NORTH AMERICA HOP WATER MARKET: NORTH AMERICA VS REGIONAL MARKET ANALYSIS
FIGURE 5 NORTH AMERICA HOP WATER MARKET: COMPANY RESEARCH ANALYSIS
FIGURE 6 NORTH AMERICA HOP WATER MARKET: MULTIVARIATE MODELLING
FIGURE 7 NORTH AMERICA HOP WATER MARKET: INTERVIEW DEMOGRAPHICS
FIGURE 8 NORTH AMERICA HOP WATER MARKET: DBMR MARKET POSITION GRID
FIGURE 9 NORTH AMERICA HOP WATER MARKET: MARKET APPLICATION COVERAGE GRID
FIGURE 10 NORTH AMERICA HOP WATER MARKET: VENDOR SHARE ANALYSIS
FIGURE 11 NORTH AMERICA HOP WATER MARKET: SEGMENTATION
FIGURE 12 EXECUTIVE SUMMARY
FIGURE 13 TWO SEGMENTS COMPRISE THE NORTH AMERICA HOP WATER MARKET, BY PRODUCT TYPE (2025)
FIGURE 14 STRATEGIC DECISIONS
FIGURE 15 NORTH AMERICA IS EXPECTED TO DOMINATE THE NORTH AMERICA HOP WATER MARKET AND ASIA-PACIFIC TO GROW WITH THE HIGHEST CAGR IN THE FORECAST PERIOD OF 2026 TO 2033
FIGURE 16 RISING CONSUMER DEMAND FOR LOW-CALORIE, NON-ALCOHOLIC, AND HEALTH-FOCUSED BEVERAGES DRIVING THE NORTH AMERICA HOP WATER MARKET FROM 2026 TO 2033
FIGURE 17 CLASSIC SEGMENT IS EXPECTED TO ACCOUNT FOR THE LARGEST SHARE OF THE NORTH AMERICA HOP WATER MARKET IN 2026 & 2033
FIGURE 18 NORTH AMERICA IS THE FASTEST GROWING MARKET FOR HOP WATER MANUFACTURERS IN THE FORECAST PERIOD OF 2026 TO 2033
FIGURE 19 PORTER’S FIVE FORCES
FIGURE 20 DRIVER, RESTRAINTS, OPPORTUNITIES AND CHALLENGES OF NORTH AMERICA HOP WATER MARKET
FIGURE 21 NORTH AMERICA HOP WATER MARKET: BY PRODUCT TYPE, 2025
FIGURE 22 NORTH AMERICA HOP WATER MARKET: BY FLAVOR, 2025
FIGURE 23 NORTH AMERICA HOP WATER MARKET: BY CARBONATION LEVEL, 2025
FIGURE 24 NORTH AMERICA HOP WATER MARKET: BY PACKAGING, 2025
FIGURE 25 NORTH AMERICA HOP WATER MARKET: BY PRICE, 2025
FIGURE 26 NORTH AMERICA HOP WATER MARKET: BY APPLICATION, 2025
FIGURE 27 NORTH AMERICA HOP WATER MARKET: BY END USER, 2025
FIGURE 28 NORTH AMERICA HOP WATER MARKET: BY DISTRIBUTION CHANNEL, 2025
FIGURE 29 NORTH AMERICA HOP WATER MARKET: SNAPSHOT (2025)
FIGURE 30 NORTH AMERICA HOP WATER MARKET: COMPANY SHARE 2025 (%)
North America Hop Water Market, Supply Chain Analysis and Ecosystem Framework
To support market growth and help clients navigate the impact of geopolitical shifts, DBMR has integrated in-depth supply chain analysis into its North America Hop Water Market research reports. This addition empowers clients to respond effectively to global changes affecting their industries. The supply chain analysis section includes detailed insights such as North America Hop Water Market consumption and production by country, price trend analysis, the impact of tariffs and geopolitical developments, and import and export trends by country and HSN code. It also highlights major suppliers with data on production capacity and company profiles, as well as key importers and exporters. In addition to research, DBMR offers specialized supply chain consulting services backed by over a decade of experience, providing solutions like supplier discovery, supplier risk assessment, price trend analysis, impact evaluation of inflation and trade route changes, and comprehensive market trend analysis.
Data collection and base year analysis are done using data collection modules with large sample sizes. The stage includes obtaining market information or related data through various sources and strategies. It includes examining and planning all the data acquired from the past in advance. It likewise envelops the examination of information inconsistencies seen across different information sources. The market data is analysed and estimated using market statistical and coherent models. Also, market share analysis and key trend analysis are the major success factors in the market report. To know more, please request an analyst call or drop down your inquiry.
The key research methodology used by DBMR research team is data triangulation which involves data mining, analysis of the impact of data variables on the market and primary (industry expert) validation. Data models include Vendor Positioning Grid, Market Time Line Analysis, Market Overview and Guide, Company Positioning Grid, Patent Analysis, Pricing Analysis, Company Market Share Analysis, Standards of Measurement, Global versus Regional and Vendor Share Analysis. To know more about the research methodology, drop in an inquiry to speak to our industry experts.
Data Bridge Market Research is a leader in advanced formative research. We take pride in servicing our existing and new customers with data and analysis that match and suits their goal. The report can be customized to include price trend analysis of target brands understanding the market for additional countries (ask for the list of countries), clinical trial results data, literature review, refurbished market and product base analysis. Market analysis of target competitors can be analyzed from technology-based analysis to market portfolio strategies. We can add as many competitors that you require data about in the format and data style you are looking for. Our team of analysts can also provide you data in crude raw excel files pivot tables (Fact book) or can assist you in creating presentations from the data sets available in the report.


