
North America Hvdc Transmission Market
Market Size in USD Billion
 USD
3.38 Billion
USD
5.30 Billion
2024
2032
USD
3.38 Billion
USD
5.30 Billion
2024
2032
| 2025 - 2032 | |
| USD 3.38 Billion | |
| USD 5.30 Billion | |
| % | |
|
High Voltage Direct Current (HVDC) Transmission Market Size
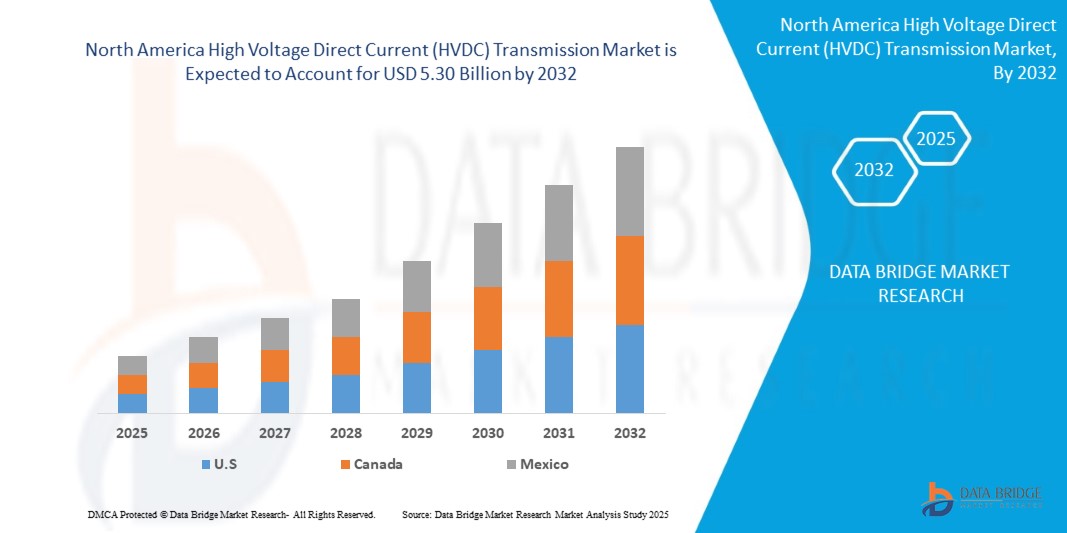
- The North America High Voltage Direct Current (HVDC) Transmission Market size was valued at USD 3.38 billion in 2024 and is expected to reach USD 5.30 billion by 2032, at a CAGR of 5.9% during the forecast period
- This growth is driven by the rapid adoption of efficient long-distance power transmission, increasing integration of renewable energy sources, and the north america need for enhanced grid stability and interconnectivity across national and regional power grids. The surge in grid modernization and expansion projects further accelerates market expansion.
- Advancements in HVDC technologies, including the shift to Voltage Source Converters (VSC) for superior control and flexibility, coupled with government initiatives promoting clean energy and investments in cross-border interconnections, are propelling market growth, particularly in regions with robust renewable energy development and large geographical areas requiring bulk power transfer.
High Voltage Direct Current (HVDC) Transmission Market Analysis
- HVDC components are critical systems enabling efficient and stable bulk power transmission over long distances, particularly for integrating renewable energy and interconnecting grids. These components, including converter stations (with converters, transformers, and filters), transmission cables (overhead, underground, submarine), and control & protection systems, are integral to applications like bulk power transfer, grid interconnections, and urban power infeed.
- The market is fueled by the north america rise in electricity demand, driving the need for more efficient transmission. The north america HVDC transmission market size was valued at USD 13.28 billion in 2022 and is projected to reach USD 21.17 billion by 2032, growing at a CAGR of 6.1% from 2023 to 2032. The increasing integration of renewable energy sources, especially from remote locations and offshore wind farms, further boosts demand for HVDC.
- The adoption of advanced technologies like Voltage Source Converters (VSC) enhances HVDC performance, offering superior control, flexibility, and compatibility with renewable energy sources. VSC technology held the largest revenue market share of over 32.26% in HVDC converter stations in 2024. The growing focus on grid modernization and cross-border interconnectivity is a significant growth driver.
- North America led the north america HVDC transmission market with a commanding revenue share of over 25.43% in 2024 (specifically for HVDC converter stations), driven by robust economic growth, rapid industrialization, increasing urbanization, and significant government investments in grid modernization and renewable energy integration in countries like U.S, Canada and Mexico. U.S. dominates due to its massive UHVDC (Ultra High Voltage Direct Current) infrastructure investments.
- U.S. is anticipated to witness significant growth during the forecast period (CAGR not specifically stated for 2025-2032, but overall HVDC market CAGR for 2025-2032 is projected around 6.1%), propelled by the need to upgrade aging power infrastructure, increasing integration of renewable energy (especially offshore wind), and R&D investments in grid resilience.
- Among components, the converter stations segment is typically the largest market share holder in HVDC projects, attributed to their critical role in converting AC to DC and vice versa, along with their complexity and high cost. Other key components include transmission cables and control & protection systems.
Report Scope and High Voltage Direct Current (HVDC) Transmission Market Segmentation
|
Attributes |
High Voltage Direct Current (HVDC) Transmission Key Market Insights |
|
Segments Covered |
|
|
Countries Covered |
North America
|
|
Key Market Players |
|
|
Market Opportunities |
|
|
Value Added Data Infosets |
In addition to the insights on market scenarios such as market value, growth rate, segmentation, geographical coverage, and major players, the market reports curated by the Data Bridge Market Research also include in-depth expert analysis, pricing analysis, brand share analysis, consumer survey, demography analysis, supply chain analysis, value chain analysis, raw material/consumables overview, vendor selection criteria, PESTLE Analysis, Porter Analysis, and regulatory framework. |
High Voltage Direct Current (HVDC) Transmission Market Trends
“Advancements in Renewable Energy Integration, Grid Modernization, and Digitalization”
- Widespread Adoption of Voltage Source Converter (VSC) Technology: Over 60% of new HVDC projects in 2023 and 2024 utilized VSC technology for its enhanced control, flexibility, and compatibility with renewable energy sources, supporting efficient grid integration.
- Integration of Digitalization and IoT: The adoption of IoT and digital technologies in HVDC systems grew by 25% in 2024, enabling real-time monitoring, predictive maintenance, and advanced fault detection for improved grid reliability.
- Miniaturization of HVDC Components: Advancements in converter technologies, such as Modular Multilevel Converters (MMCs), have led to a 20% increase in compact HVDC systems, ideal for space-constrained applications like offshore wind farms.
- Rise of Multi-Terminal HVDC Systems: The deployment of multi-terminal HVDC systems increased by 15% in 2024, enhancing system flexibility and supporting cross-border power trading and renewable energy integration.
- Focus on Energy-Efficient HVDC Designs: Over 30% of new HVDC systems in 2024 prioritized low-loss transmission, aligning with north america sustainability goals and reducing carbon footprints in power delivery.
- Growth of Online Procurement Channels: Online sales of HVDC components grew by 10% annually, driven by e-commerce platforms catering to utility companies and infrastructure developers.
High Voltage Direct Current (HVDC) Transmission Market Dynamics
Driver
“Renewable Energy Growth, Grid Interconnection, and Energy Efficiency Demands”
- North america Expansion of Renewable Energy: With renewable energy capacity exceeding 3,700 GW globally in 2023, HVDC systems are critical for integrating wind and solar power, driving demand for long-distance, low-loss transmission.
- Proliferation of Offshore Wind Projects: North america offshore wind capacity reached 64 GW in 2023, boosting demand for HVDC systems to connect remote wind farms to mainland grids, enhancing energy security.
- Increasing Cross-Border Grid Interconnections: Investments in cross-border HVDC projects, such as the Saudi Arabia-Egypt interconnection (3,000 MW), are driving demand for efficient power exchange and grid resilience.
- Rise of Smart Grids and Urbanization: North america smart grid investments reached USD 105 billion in 2023, with HVDC systems enabling efficient power distribution in rapidly urbanizing regions like Asia-Pacific.
- Growing Electricity Demand: North america electricity demand increased by 2.4% in 2022, fueling the need for HVDC systems to transmit large power volumes with minimal losses over long distances.
- Government Policies and Incentives: Initiatives like the EU’s 40% renewable energy target by 2030 and China’s USD 1 trillion investment in transmission lines by 2030 are accelerating HVDC adoption through funding and regulatory support.
Restraint/Challenge
“High Costs, Technical Complexity, and Standardization Issues”
- High Initial Investment Costs: The high cost of HVDC converter stations, with breakeven distances of 37 miles for submarine and 124 miles for overhead lines, limits adoption in cost-sensitive regions.
- Cybersecurity Risks in Digitalized Systems: The growing use of IoT in HVDC systems has increased cybersecurity concerns, with the cybersecurity market for energy infrastructure growing at a CAGR of 15.2% to address threats.
- Technical Complexities in System Integration: Integrating HVDC with existing AC grids requires specialized expertise, increasing development costs and project timelines for utilities.
- Stringent Regulatory Requirements: Compliance with standards like IEC and regional grid codes increases costs and complexity for HVDC manufacturers, particularly for cross-border projects.
- Interoperability Challenges: Lack of standardization between VSC and Line-Commutated Converter (LCC) technologies hinders seamless integration, requiring costly adaptations for mixed-grid environments.
- Rapid Technological Obsolescence: The need for continuous innovation to meet evolving grid and renewable energy standards pressures manufacturers to invest heavily in R&D, impacting profitability for smaller players.
High Voltage Direct Current (HVDC) Transmission Market Scope
The North America HVDC transmission market is segmented by component, project type, technology, application, power rating, and voltage rating.
- By Component
The market is segmented into converter stations, transmission cables, control and protection, reactive power supplies, and electrodes. Converter stations held the largest revenue share of 48.93% in 2024, driven by their essential role in AC-DC conversion. The Converter stations segment is expected to grow at the fastest CAGR of 6.3% from 2025 to 2032, fueled by demand for submarine and underground cables for offshore wind and cross-border projects.
- By Project Type
The market is segmented into point-to-point transmission, back-to-back stations, and multi-terminal systems. Point-to-point transmission dominated with a 44.73% share in 2024, driven by long-distance bulk power transfer needs. Point-To-Point Transmission systems are expected to grow at the fastest CAGR of 6.2% from 2025 to 2032, propelled by increasing grid interconnections.
- By Technology
The market is segmented into Line Commutated Converter (LCC), Voltage Source Converter (VSC), and Capacitor Commutated Converter (CCC). The Line Commutated Converter (LCC segment led with a 50.41% share in 2024, due to its superior control and renewable energy compatibility. The Line Commutated Converter (LCC) segment is expected to grow at the fastest CAGR of 6.2% from 2025 to 2032.
- By Application
The market is segmented into bulk power transmission, interconnecting grids, and in-feed urban areas. Bulk power transmission accounted for the largest share of 59.30% in 2024, driven by the need for efficient long-distance power delivery. Bulk power transmission segmentis expected to grow at the fastest CAGR of 6.2% from 2025 to 2032, fueled by cross-border energy trading and grid resilience initiatives.
- By Power Rating
The market is segmented into below 1001-1500 MW, 1501-2000 MW, Above 2001 MW
501-1000 MW, Below 500 MW. The above 1001-1500 MW segment held the largest share of 34.55% in 2024, driven by large-scale renewable energy and UHVDC projects. The Above 2001 MW segment is expected to grow at the fastest CAGR of 6.5% from 2025 to 2032, due to mid-sized grid modernization projects.
- By Voltage Rating
The market is segmented into less than 350-640 Kv, 640-800 kV, Less Than 350 kV and More Than 800 kV The more than 350-640 segment dominated with a 42.40 % share in 2024, driven by UHVDC projects in Asia-Pacific. The 350-640 Kv,, segment is expected to grow at the fastest CAGR of 6.4% from 2025 to 2032, supported by offshore wind and regional interconnections.
High Voltage Direct Current (HVDC) Transmission Market Regional Analysis
North America
North America is projected to grow at a CAGR of 5.9% from 2025 to 2032, driven by offshore wind projects and grid modernization efforts. The U.S. accounted for 75.87% of the regional market in 2024, supported by DOE’s USD 10 million funding for HVDC innovation and projects like Sunrise Wind.
U.S. High Voltage Direct Current (HVDC) Transmission Market Insight
The U.S. leads the North American market, fueled by its focus on offshore wind (e.g., Sunrise Wind) and grid upgrades to support renewable energy integration and enhance grid reliability.
Canada. High Voltage Direct Current (HVDC) Transmission Market Insight
The canada. is experiencing steady growth, propelled by its offshore wind capacity (12.7 GW in 2023) and HVDC interconnectors like the North Sea Link, enhancing energy trading and grid stability.
High Voltage Direct Current (HVDC) Transmission Market Share
- The High Voltage Direct Current (HVDC) Transmission industry is primarily led by well-established companies, including:
- Siemens [Germany]
- ABB [Switzerland]
- GE Vernova [US]
- Toshiba Energy Systems & Solutions C [Japan]
- Mitsubishi Electric Corporation [Japan]
- Emerson Electric Co. [US]
- Schneider Electric [France]
- Nexans [France]
- NKT A/S [Denmark]
- Hitachi, Ltd. [Japan]
- Sumitomo Electric Industries, Ltd. [Japan]
- Prysmian S.p.A [Italy]
- American Superconductor [US]
- LS ELECTRIC Co., Ltd. [South Korea]
- Stantec [Canada]
- Infineon Technologies AG [Germany]
- ATCO Ltd [Canada]
- ESCO Technologies inc. [US]
- Schweitzer Engineering Laboratories [US]
- Delta Electronics, Inc. [Taiwan]
Latest Developments in North America High Voltage Direct Current (HVDC) Transmission Market
- In June 2025, ABB deployed its VD4-AF1 medium-voltage circuit breaker at Duferco Travi e Profilati’s steel mill in Italy to ensure business continuity. This circuit breaker, specifically designed for arc furnace operations, supports over 150,000 maintenance-free operations and provides advanced diagnostics to reduce transformer stress, thereby enhancing operational reliability and minimizing downtime. ABB strengthens its position in heavy industrial applications, while its advanced grid technology contributes to improved efficiency and stability in the global HVDC transmission market.
- In June 2025, ABB emphasized the importance of strategic partnerships to accelerate the transition to SF₆-free switchgear, marking a major shift in medium-voltage infrastructure amid rising grid pressures and regulatory demands. By co-developing adaptable and reliable solutions with utilities, ABB fosters long-term collaboration and confidence in sustainable technology. ABB benefits by positioning itself as a trusted innovation partner, while the collaborative approach supports modernization in the global HVDC transmission market through scalable, low-emission grid solutions.
- In January 2025, ABB advanced substation automation by introducing its virtualized centralized protection and control (VPC) system, SSC600 SW, which integrates multiple relay functions into a single digital platform. This innovation enhances grid resilience, reduces lifecycle costs by up to 15%, and improves scalability for utilities adapting to renewable integration and increasing grid complexity. ABB benefits by leading the digital substation evolution, while the solution supports the global HVDC transmission market with improved grid control, flexibility, and real-time protection capabilities.
- In August 2024, GE Vernova’s Grid Solutions launched the GRiDEA portfolio at CIGRE in Paris, introducing SF₆-free high-voltage switchgear and sustainable grid technologies to support decarbonization. The portfolio aims to reduce emissions, minimize raw material usage, and extend equipment lifespan through advanced monitoring and design. GE Vernova benefits by reinforcing its leadership in sustainable electrification, while contributing significantly to the global HVDC transmission market with eco-friendly and future-ready transmission solutions
SKU-

- Interactive Data Analysis Dashboard
- Company Analysis Dashboard for high growth potential opportunities
- Research Analyst Access for customization & queries
- Competitor Analysis with Interactive dashboard
- Latest News, Updates & Trend analysis
- Harness the Power of Benchmark Analysis for Comprehensive Competitor Tracking
Table of Content
1 INTRODUCTION
1.1 OBJECTIVES OF THE STUDY
1.2 MARKET DEFINITION
1.3 OVERVIEW
1.4 LIMITATIONS
1.5 MARKETS COVERED
2 MARKET SEGMENTATION
2.1 MARKETS COVERED
2.2 GEOGRAPHICAL SCOPE
2.3 YEARS CONSIDERED FOR THE STUDY
2.4 CURRENCY AND PRICING
2.5 DBMR TRIPOD DATA VALIDATION MODEL
2.6 MULTIVARIATE MODELING
2.7 PRIMARY INTERVIEWS WITH KEY OPINION LEADERS
2.8 DBMR MARKET POSITION GRID
2.9 DBMR VENDOR SHARE ANALYSIS
2.1 MARKET END USE COVERAGE GRID
2.11 SECONDARY SOURCES
2.12 ASSUMPTIONS
3 EXECUTIVE SUMMARY
4 PREMIUM INSIGHTS
4.1 PESTLE ANALYSIS
4.1.1 POLITICAL
4.1.2 ECONOMIC
4.1.3 SOCIAL
4.1.4 TECHNOLOGICAL
4.1.5 ENVIRONMENTAL
4.1.6 LEGAL
4.2 PORTERS FIVE FORCES
4.2.1 INTENSITY OF COMPETITIVE RIVALRY – MODERATE TO HIGH
4.2.2 BARGAINING POWER OF BUYERS / CONSUMERS – HIGH
4.2.3 THREAT OF NEW ENTRANTS – LOW
4.2.4 THREAT OF SUBSTITUTE PRODUCTS – LOW TO MODERATE
4.2.5 BARGAINING POWER OF SUPPLIERS – MODERATE
4.3 PATENT ANALYSIS
4.3.1 PATENT QUALITY AND STRENGTH
4.3.2 PATENT FAMILIES
4.3.3 NUMBER OF INTERNATIONAL PATENT FAMILIES BY PUBLICATION YEAR
4.3.4 LICENSING AND COLLABORATIONS
4.3.5 COMPANY PATENT LANDSCAPE
4.3.6 REGION PATENT LANDSCAPE
4.3.7 IP STRATEGY AND MANAGEMENT
4.3.8 PATENT ANALYSIS
4.4 VALUE CHAIN
4.4.1 COMPONENT MANUFACTURING:
4.4.2 SYSTEM INTEGRATION:
4.4.3 TRANSMISSION INFRASTRUCTURE DEVELOPMENT:
4.4.4 END-USERS:
4.5 SUPPLY CHAIN ANALYSIS
4.6 PENETRATION & GROWTH PROSPECT MAPPING FOR HVDC MARKET
4.7 OVERVIEW OF TECHNOLOGICAL INNOVATIONS IN THE NORTH AMERICA HIGH VOLTAGE DIRECT CURRENT (HVDC) TRANSMISSION MARKET
4.8 TARIFFS & IMPACT ON THE MARKET
4.8.1 CURRENT TARIFF RATE (S) IN TOP-5 COUNTRY MARKETS
4.8.2 OUTLOOK: LOCAL PRODUCTION V/S IMPORT RELIANCE
4.8.3 VENDOR SELECTION CRITERIA DYNAMICS
4.8.4 IMPACT ON SUPPLY CHAIN
4.8.5 RAW MATERIAL PROCUREMENT
4.8.6 MANUFACTURING AND PRODUCTION
4.8.7 LOGISTICS AND DISTRIBUTION
4.8.8 PRICE PITCHING AND POSITION OF MARKET
4.8.9 INDUSTRY PARTICIPANTS: PROACTIVE MOVES
4.8.10 SUPPLY CHAIN OPTIMIZATION
4.8.11 JOINT VENTURE ESTABLISHMENTS
4.8.12 IMPACT ON PRICES
4.8.13 REGULATORY INCLINATION
4.8.14 GEOPOLITICAL SITUATION
4.8.15 TRADE PARTNERSHIPS BETWEEN THE COUNTRIES
4.8.16 FREE TRADE AGREEMENTS
4.8.17 ALLIANCES ESTABLISHEMENTS
4.8.18 STATUS ACCREDITION (INCLUDING MFTN)
4.8.19 DOMESTIC COURSE OF CORRECTION
4.8.20 INCENTIVE SCHEMES TO BOOST PRODUCTION OUTPUTS
4.8.21 ESTABLISHMENT OF SPECIAL ECONOMIC ZONES/INDUSTRIAL PARKS
4.9 IMPACT ON PRICES
5 REGULATION COVERAGE
6 MARKET OVERVIEW
6.1 DRIVERS
6.1.1 RISING NEED TO TRANSMIT RENEWABLE ENERGY OVER LONG DISTANCES
6.1.2 GROWING INVESTMENTS IN GRID MODERNIZATION AND CROSS-BORDER
6.1.3 IMPROVED TECHNOLOGICAL CAPABILITIES IN HVDC SYSTEMS
6.1.4 STRONG POLICY PUSH FOR DECARBONIZATION AND ENERGY EFFICIENCY
6.2 RESTRAINTS
6.2.1 HIGH INITIAL CAPITAL INVESTMENT
6.2.2 COMPLEX AND LENGTHY REGULATORY APPROVALS
6.3 OPPORTUNITIES
6.3.1 GOVERNMENTS WORLDWIDE ARE BOOSTING HVDC INVESTMENT TO ACHIEVE ENERGY TRANSITION AND ENHANCE GRID RELIABILITY
6.3.2 EMERGING APPLICATIONS IN HIGH-SPEED RAIL AND ELECTRIC VEHICLE CHARGING INFRASTRUCTURE.
6.3.3 ADVANCEMENTS IN CABLE TECHNOLOGY, CONVERTERS AND DIGITAL CONTROLS EXPAND USE CASES.
6.4 CHALLENGES
6.4.1 HVDC FACES TECHNICAL HURDLES IN AC GRID CONNECTIONS, MULTI-TERMINAL DC MANAGEMENT/FAULTS, AND ADVANCED MODELING.
6.4.2 HVDC FACES FINANCIAL HURDLES: HIGH UPFRONT COSTS AND SLOW RETURNS REQUIRE GOVERNMENT AND INVESTOR SUPPORT.
7 NORTH AMERICA HIGH VOLTAGE DIRECT CURRENT (HVDC) TRANSMISSION MARKET, BY COMPONENT
7.1 OVERVIEW
7.2 CONVERTER STATIONS
7.3 TRANSMISSION CABLES
7.4 CONTROL AND PROTECTION
7.5 REACTIVE POWER SUPPLIES
7.6 ELECTRODES
7.7 OTHERS
8 NORTH AMERICA HIGH VOLTAGE DIRECT CURRENT (HVDC) TRANSMISSION MARKET, BY PROJECT TYPE
8.1 OVERVIEW
8.2 POINT-TO-POINT TRANSMISSION
8.3 BACK-TO-BACK STATIONS
8.4 MULTI-TERMINAL SYSTEM
9 NORTH AMERICA HIGH VOLTAGE DIRECT CURRENT (HVDC) TRANSMISSION MARKET, BY TECHNOLOGY
9.1 OVERVIEW
9.2 LINE COMMUTATED CONVERTER
9.3 VOLTAGE SOURCE CONVERTER
9.4 CAPACITOR COMMUTATED CONVERTER
10 NORTH AMERICA HIGH VOLTAGE DIRECT CURRENT (HVDC) TRANSMISSION MARKET, BY APPLICATION
10.1 OVERVIEW
10.2 BULK POWER TRANSMISSION
10.2.1 CONVERTER STATIONS
10.2.2 TRANSMISSION CABLES
10.2.3 CONTROL AND PROTECTION
10.2.4 REACTIVE POWER SUPPLIES
10.2.5 ELECTRODES
10.2.6 OTHERS
10.3 INTERCONNECTING GRIDS
10.3.1 CONVERTER STATIONS
10.3.2 TRANSMISSION CABLES
10.3.3 CONTROL AND PROTECTION
10.3.4 REACTIVE POWER SUPPLIES
10.3.5 ELECTRODES
10.3.6 OTHERS
10.4 IN-FEED URBAN AREAS
10.4.1 CONVERTER STATIONS
10.4.2 TRANSMISSION CABLES
10.4.3 CONTROL AND PROTECTION
10.4.4 REACTIVE POWER SUPPLIES
10.4.5 ELECTRODES
10.4.6 OTHERS
11 NORTH AMERICA HIGH VOLTAGE DIRECT CURRENT (HVDC) TRANSMISSION MARKET, BY POWER RATING
11.1 OVERVIEW
11.2 1001-1500 MW
11.3 1501-2000 MW
11.4 ABOVE 2001 MW
11.5 501-1000 MW
11.6 BELOW 500 MW
12 NORTH AMERICA HIGH VOLTAGE DIRECT CURRENT (HVDC) TRANSMISSION MARKET, BY VOLTAGE RATING
12.1 OVERVIEW
12.2 350-640 KV
12.3 640-800 KV
12.4 LESS THAN 350 KV
12.5 MORE THAN 800 KV
13 NORTH AMERICA HIGH VOLTAGE DIRECT CURRENT (HVDC) TRANSMISSION MARKET, BY REGION
13.1 NORTH AMERICA
13.1.1 U.S.
13.1.2 CANADA
13.1.3 MEXICO
14 NORTH AMERICA HIGH VOLTAGE DIRECT CURRENT (HVDC) TRANSMISSION MARKET
14.1 COMPANY SHARE ANALYSIS: GLOBAL
15 SWOT ANALYSIS
16 COMPANY PROFILES
16.1 ABB
16.1.1 COMPANY SNAPSHOT
16.1.2 REVENUE ANALYSIS
16.1.3 COMPANY SHARE ANALYSIS
16.1.4 PRODUCT PORTFOLIO
16.1.5 RECENT DEVELOPMENTS/NEWS
16.2 SIEMENS
16.2.1 COMPANY SNAPSHOT
16.2.2 REVENUE ANALYSIS
16.2.3 COMPANY SHARE ANALYSIS
16.2.4 PRODUCT PORTFOLIO
16.2.5 RECENT DEVELOPMENTS/NEWS
16.3 GE VERNOVA
16.3.1 COMPANY SNAPSHOT
16.3.2 REVENUE ANALYSIS
16.3.3 COMPANY SHARE ANALYSIS
16.3.4 PRODUCT PORTFOLIO
16.3.5 RECENT DEVELOPMENTS/NEWS
16.4 PRYSMIAN GROUP
16.4.1 COMPANY SNAPSHOT
16.4.2 REVENUE ANALYSIS
16.4.3 COMPANY SHARE ANALYSIS
16.4.4 PRODUCT PORTFOLIO
16.4.5 RECENT DEVELOPMENT
16.5 HITACHI, LTD.
16.5.1 COMPANY SNAPSHOT
16.5.2 REVENUE ANALYSIS
16.5.3 COMPANY SHARE ANALYSIS
16.5.4 PRODUCT PORTFOLIO
16.5.5 RECENT DEVELOPMENTS/NEWS
16.6 AMERICAN SUPERCONDUCTOR
16.6.1 COMPANY SNAPSHOT
16.6.2 REVENUE ANALYSIS
16.6.3 PRODUCT PORTFOLIO
16.6.4 RECENT DEVELOPMENT
16.7 ATCO LTD.
16.7.1 COMPANY SNAPSHOT
16.7.2 REVENUE ANALYSIS
16.7.3 PRODUCT PORTFOLIO
16.7.4 RECENT DEVELOPMENT
16.8 DELTA ELECTRONICS, INC.
16.8.1 COMPANY SNAPSHOT
16.8.2 REVENUE ANALYSIS
16.8.3 PRODUCT PORTFOLIO
16.8.4 RECENT DEVELOPMENT/NEWS
16.9 EMERSON ELECTRIC CO.
16.9.1 COMPANY SNAPSHOT
16.9.2 REVENUE ANALYSIS
16.9.3 PRODUCT PORTFOLIO
16.9.4 RECENT DEVELOPMENTS/NEWS
16.1 ESCO TECHNOLOGIES INC. (DOBLE ENGINEERING COMPANY)
16.10.1 COMPANY SNAPSHOT
16.10.2 REVENUE ANALYSIS
16.10.3 PRODUCT PORTFOLIO
16.10.4 RECENT DEVELOPMENT
16.11 INFINEON TECHNOLOGIES AG
16.11.1 COMPANY SNAPSHOT
16.11.2 REVENUE ANALYSIS
16.11.3 PRODUCT PORTFOLIO
16.11.4 RECENT DEVELOPMENT/NEWS
16.12 LS ELECTRIC CO, LTD.
16.12.1 COMPANY SNAPSHOT
16.12.2 REVENUE ANALYSIS
16.12.3 PRODUCT PORTFOLIO
16.12.4 RECENT DEVELOPMENT
16.13 MITSUBISHI ELECTRIC CORPORATION
16.13.1 COMPANY SNAPSHOT
16.13.2 REVENUE ANALYSIS
16.13.3 PRODUCT PORTFOLIO
16.13.4 RECENT DEVELOPMENTS/NEWS
16.14 NEXANS
16.14.1 COMPANY SNAPSHOT
16.14.2 REVENUE ANALYSIS
16.14.3 PRODUCT PORTFOLIO
16.14.4 RECENT DEVELOPMENTS/NEWS
16.15 NKT A S
16.15.1 COMPANY SNAPSHOT
16.15.2 REVENUE ANALYSIS
16.15.3 PRODUCT PORTFOLIO
16.15.4 RECENT DEVELOPMENTS/NEWS
16.16 SCHNEIDER ELECTRIC
16.16.1 COMPANY SNAPSHOT
16.16.2 REVENUE ANALYSIS
16.16.3 PRODUCT PORTFOLIO
16.16.4 RECENT DEVELOPMENTS/NEWS
16.17 SCHWEITZER ENGINEERING LABORATORIES, INC.
16.17.1 COMPANY SNAPSHOT
16.17.2 PRODUCT PORTFOLIO
16.17.3 RECENT DEVELOPMENTS/NEWS
16.18 STANTEC
16.18.1 COMPANY SNAPSHOT
16.18.2 REVENUE ANALYSIS
16.18.3 SERVICES PORTFOLIO
16.18.4 RECENT DEVELOPMENT
16.19 SUMITOMO ELECTRIC INDUSTRIES, LTD
16.19.1 COMPANY SNAPSHOT
16.19.2 REVENUE ANALYSIS
16.19.3 PRODUCT PORTFOLIO
16.19.4 RECENT DEVELOPMENTS/NEWS
16.2 TOSHIBA ENERGY SYSTEMS & SOLUTIONS CORPORATION
16.20.1 COMPANY SNAPSHOT
16.20.2 PRODUCT PORTFOLIO
16.20.3 RECENT DEVELOPMENT
17 QUESTIONNAIRE
18 RELATED REPORTS
List of Table
TABLE 1 CONSUMER BUYING BEHAVIOUR
TABLE 2 HVDC TRANSMISSION IMPORT TARIFF RATES IN TOP 5 MARKETS (2024)
TABLE 3 LOCAL PRODUCTION V/S IMPORT RELIANCE
TABLE 4 REGULATORY INCLINATION
TABLE 5 TRADE PARTNERSHIPS BETWEEN THE COUNTRIES
TABLE 6 ALLIANCES ESTABLISHEMENTS
TABLE 7 ESTABLISHMENT OF SPECIAL ECONOMIC ZONES (SEZS) AND INDUSTRIAL PARKS
TABLE 8 REGULATORY COVERAGE
TABLE 9 NORTH AMERICA HIGH VOLTAGE DIRECT CURRENT (HVDC) TRANSMISSION MARKET, BY COMPONENT, 2018-2032 (USD THOUSAND)
TABLE 10 NORTH AMERICA CONVERTER STATIONS IN HIGH VOLTAGE DIRECT CURRENT (HVDC) TRANSMISSION MARKET, BY REGION, 2018-2032 (USD THOUSAND)
TABLE 11 NORTH AMERICA TRANSMISSION CABLES IN HIGH VOLTAGE DIRECT CURRENT (HVDC) TRANSMISSION MARKET, BY REGION, 2018-2032 (USD THOUSAND)
TABLE 12 NORTH AMERICA CONTROL AND PROTECTION IN HIGH VOLTAGE DIRECT CURRENT (HVDC) TRANSMISSION MARKET, BY REGION, 2018-2032 (USD THOUSAND)
TABLE 13 NORTH AMERICA REACTIVE POWER SUPPLIES IN HIGH VOLTAGE DIRECT CURRENT (HVDC) TRANSMISSION MARKET, BY REGION, 2018-2032 (USD THOUSAND)
TABLE 14 NORTH AMERICA ELECTRODES IN HIGH VOLTAGE DIRECT CURRENT (HVDC) TRANSMISSION MARKET, BY REGION, 2018-2032 (USD THOUSAND)
TABLE 15 NORTH AMERICA OTHERS IN HIGH VOLTAGE DIRECT CURRENT (HVDC) TRANSMISSION MARKET, BY REGION, 2018-2032 (USD THOUSAND)
TABLE 16 NORTH AMERICA HIGH VOLTAGE DIRECT CURRENT (HVDC) TRANSMISSION MARKET, BY PROJECT TYPE, 2018-2032 (USD THOUSAND)
TABLE 17 NORTH AMERICA POINT-TO-POINT TRANSMISSION IN HIGH VOLTAGE DIRECT CURRENT (HVDC) TRANSMISSION MARKET, BY REGION, 2018-2032 (USD THOUSAND)
TABLE 18 NORTH AMERICA BACK-TO-BACK STATIONS IN HIGH VOLTAGE DIRECT CURRENT (HVDC) TRANSMISSION MARKET, BY REGION, 2018-2032 (USD THOUSAND)
TABLE 19 NORTH AMERICA MULTI-TERMINAL SYSTEM IN HIGH VOLTAGE DIRECT CURRENT (HVDC) TRANSMISSION MARKET, BY REGION, 2018-2032 (USD THOUSAND)
TABLE 20 NORTH AMERICA HIGH VOLTAGE DIRECT CURRENT (HVDC) TRANSMISSION MARKET, BY TECHNOLOGY, 2018-2032 (USD THOUSAND)
TABLE 21 NORTH AMERICA LINE COMMUTATED CONVERTER IN HIGH VOLTAGE DIRECT CURRENT (HVDC) TRANSMISSION MARKET, BY REGION, 2018-2032 (USD THOUSAND)
TABLE 22 NORTH AMERICA VOLTAGE SOURCE CONVERTER IN HIGH VOLTAGE DIRECT CURRENT (HVDC) TRANSMISSION MARKET, BY REGION, 2018-2032 (USD THOUSAND)
TABLE 23 NORTH AMERICA CAPACITOR COMMUTATED CONVERTER IN HIGH VOLTAGE DIRECT CURRENT (HVDC) TRANSMISSION MARKET, BY REGION, 2018-2032 (USD THOUSAND)
TABLE 24 NORTH AMERICA HIGH VOLTAGE DIRECT CURRENT (HVDC) TRANSMISSION MARKET, BY APPLICATION, 2018-2032 (USD THOUSAND)
TABLE 25 NORTH AMERICA BULK POWER TRANSMISSION IN HIGH VOLTAGE DIRECT CURRENT (HVDC) TRANSMISSION MARKET, BY REGION, 2018-2032 (USD THOUSAND)
TABLE 26 NORTH AMERICA BULK POWER TRANSMISSION IN HIGH VOLTAGE DIRECT CURRENT (HVDC) TRANSMISSION MARKET, BY TYPE, 2018-2032 (USD THOUSAND)
TABLE 27 NORTH AMERICA INTERCONNECTING GRIDS IN HIGH VOLTAGE DIRECT CURRENT (HVDC) TRANSMISSION MARKET, BY REGION, 2018-2032 (USD THOUSAND)
TABLE 28 NORTH AMERICA INTERCONNECTING GRIDS IN HIGH VOLTAGE DIRECT CURRENT (HVDC) TRANSMISSION MARKET, BY TYPE, 2018-2032 (USD THOUSAND)
TABLE 29 NORTH AMERICA IN-FEED URBAN AREAS IN HIGH VOLTAGE DIRECT CURRENT (HVDC) TRANSMISSION MARKET, BY REGION, 2018-2032 (USD THOUSAND)
TABLE 30 NORTH AMERICA IN-FEED URBAN AREAS IN HIGH VOLTAGE DIRECT CURRENT (HVDC) TRANSMISSION MARKET, BY TYPE, 2018-2032 (USD THOUSAND)
TABLE 31 NORTH AMERICA HIGH VOLTAGE DIRECT CURRENT (HVDC) TRANSMISSION MARKET, BY POWER RATING, 2018-2032 (USD THOUSAND)
TABLE 32 NORTH AMERICA 1001-1500 MW IN HIGH VOLTAGE DIRECT CURRENT (HVDC) TRANSMISSION MARKET, BY REGION, 2018-2032 (USD THOUSAND)
TABLE 33 NORTH AMERICA 1501-2000 MW IN HIGH VOLTAGE DIRECT CURRENT (HVDC) TRANSMISSION MARKET, BY REGION, 2018-2032 (USD THOUSAND)
TABLE 34 NORTH AMERICA ABOVE 2001 MW IN HIGH VOLTAGE DIRECT CURRENT (HVDC) TRANSMISSION MARKET, BY REGION, 2018-2032 (USD THOUSAND)
TABLE 35 NORTH AMERICA 501-1000 MW IN HIGH VOLTAGE DIRECT CURRENT (HVDC) TRANSMISSION MARKET, BY REGION, 2018-2032 (USD THOUSAND)
TABLE 36 NORTH AMERICA BELOW 500 MW IN HIGH VOLTAGE DIRECT CURRENT (HVDC) TRANSMISSION MARKET, BY REGION, 2018-2032 (USD THOUSAND)
TABLE 37 NORTH AMERICA HIGH VOLTAGE DIRECT CURRENT (HVDC) TRANSMISSION MARKET, BY VOLTAGE RATING, 2018-2032 (USD THOUSAND)
TABLE 38 NORTH AMERICA 350-640 KV IN HIGH VOLTAGE DIRECT CURRENT (HVDC) TRANSMISSION MARKET, BY REGION, 2018-2032 (USD THOUSAND)
TABLE 39 NORTH AMERICA 640-800 KV IN HIGH VOLTAGE DIRECT CURRENT (HVDC) TRANSMISSION MARKET, BY REGION, 2018-2032 (USD THOUSAND)
TABLE 40 NORTH AMERICA LESS THAN 350 KV IN HIGH VOLTAGE DIRECT CURRENT (HVDC) TRANSMISSION MARKET, BY REGION, 2018-2032 (USD THOUSAND)
TABLE 41 NORTH AMERICA MORE THAN 800 KV IN HIGH VOLTAGE DIRECT CURRENT (HVDC) TRANSMISSION MARKET, BY REGION, 2018-2032 (USD THOUSAND)
TABLE 42 NORTH AMERICA HIGH VOLTAGE DIRECT CURRENT (HVDC) TRANSMISSION MARKET, BY COUNTRY, 2018-2032 (USD THOUSAND)
TABLE 43 NORTH AMERICA HIGH VOLTAGE DIRECT CURRENT (HVDC) TRANSMISSION MARKET, BY COMPONENT, 2018-2032 (USD THOUSAND)
TABLE 44 NORTH AMERICA HIGH VOLTAGE DIRECT CURRENT (HVDC) TRANSMISSION MARKET, BY PROJECT TYPE, 2018-2032 (USD THOUSAND)
TABLE 45 NORTH AMERICA HIGH VOLTAGE DIRECT CURRENT (HVDC) TRANSMISSION MARKET, BY TECHNOLOGY, 2018-2032 (USD THOUSAND)
TABLE 46 NORTH AMERICA HIGH VOLTAGE DIRECT CURRENT (HVDC) TRANSMISSION MARKET, BY APPLICATION, 2018-2032 (USD THOUSAND)
TABLE 47 NORTH AMERICA BULK POWER TRANSMISSION IN HIGH VOLTAGE DIRECT CURRENT (HVDC) TRANSMISSION MARKET, BY TYPE, 2018-2032 (USD THOUSAND)
TABLE 48 NORTH AMERICA INTERCONNECTING GRIDS IN HIGH VOLTAGE DIRECT CURRENT (HVDC) TRANSMISSION MARKET, BY TYPE, 2018-2032 (USD THOUSAND)
TABLE 49 NORTH AMERICA IN-FEED URBAN AREAS IN HIGH VOLTAGE DIRECT CURRENT (HVDC) TRANSMISSION MARKET, BY TYPE, 2018-2032 (USD THOUSAND)
TABLE 50 NORTH AMERICA HIGH VOLTAGE DIRECT CURRENT (HVDC) TRANSMISSION MARKET, BY POWER RATING, 2018-2032 (USD THOUSAND)
TABLE 51 NORTH AMERICA HIGH VOLTAGE DIRECT CURRENT (HVDC) TRANSMISSION MARKET, BY VOLTAGE RATING, 2018-2032 (USD THOUSAND)
TABLE 52 U.S. HIGH VOLTAGE DIRECT CURRENT (HVDC) TRANSMISSION MARKET, BY COMPONENT, 2018-2032 (USD THOUSAND)
TABLE 53 U.S. HIGH VOLTAGE DIRECT CURRENT (HVDC) TRANSMISSION MARKET, BY PROJECT TYPE, 2018-2032 (USD THOUSAND)
TABLE 54 U.S. HIGH VOLTAGE DIRECT CURRENT (HVDC) TRANSMISSION MARKET, BY TECHNOLOGY, 2018-2032 (USD THOUSAND)
TABLE 55 U.S. HIGH VOLTAGE DIRECT CURRENT (HVDC) TRANSMISSION MARKET, BY APPLICATION, 2018-2032 (USD THOUSAND)
TABLE 56 U.S. BULK POWER TRANSMISSION IN HIGH VOLTAGE DIRECT CURRENT (HVDC) TRANSMISSION MARKET, BY TYPE, 2018-2032 (USD THOUSAND)
TABLE 57 U.S. INTERCONNECTING GRIDS IN HIGH VOLTAGE DIRECT CURRENT (HVDC) TRANSMISSION MARKET, BY TYPE, 2018-2032 (USD THOUSAND)
TABLE 58 U.S. IN-FEED URBAN AREAS IN HIGH VOLTAGE DIRECT CURRENT (HVDC) TRANSMISSION MARKET, BY TYPE, 2018-2032 (USD THOUSAND)
TABLE 59 U.S. HIGH VOLTAGE DIRECT CURRENT (HVDC) TRANSMISSION MARKET, BY POWER RATING, 2018-2032 (USD THOUSAND)
TABLE 60 U.S. HIGH VOLTAGE DIRECT CURRENT (HVDC) TRANSMISSION MARKET, BY VOLTAGE RATING, 2018-2032 (USD THOUSAND)
TABLE 61 CANADA HIGH VOLTAGE DIRECT CURRENT (HVDC) TRANSMISSION MARKET, BY COMPONENT, 2018-2032 (USD THOUSAND)
TABLE 62 CANADA HIGH VOLTAGE DIRECT CURRENT (HVDC) TRANSMISSION MARKET, BY PROJECT TYPE, 2018-2032 (USD THOUSAND)
TABLE 63 CANADA HIGH VOLTAGE DIRECT CURRENT (HVDC) TRANSMISSION MARKET, BY TECHNOLOGY, 2018-2032 (USD THOUSAND)
TABLE 64 CANADA HIGH VOLTAGE DIRECT CURRENT (HVDC) TRANSMISSION MARKET, BY APPLICATION, 2018-2032 (USD THOUSAND)
TABLE 65 CANADA BULK POWER TRANSMISSION IN HIGH VOLTAGE DIRECT CURRENT (HVDC) TRANSMISSION MARKET, BY TYPE, 2018-2032 (USD THOUSAND)
TABLE 66 CANADA INTERCONNECTING GRIDS IN HIGH VOLTAGE DIRECT CURRENT (HVDC) TRANSMISSION MARKET, BY TYPE, 2018-2032 (USD THOUSAND)
TABLE 67 CANADA IN-FEED URBAN AREAS IN HIGH VOLTAGE DIRECT CURRENT (HVDC) TRANSMISSION MARKET, BY TYPE, 2018-2032 (USD THOUSAND)
TABLE 68 CANADA HIGH VOLTAGE DIRECT CURRENT (HVDC) TRANSMISSION MARKET, BY POWER RATING, 2018-2032 (USD THOUSAND)
TABLE 69 CANADA HIGH VOLTAGE DIRECT CURRENT (HVDC) TRANSMISSION MARKET, BY VOLTAGE RATING, 2018-2032 (USD THOUSAND)
TABLE 70 MEXICO HIGH VOLTAGE DIRECT CURRENT (HVDC) TRANSMISSION MARKET, BY COMPONENT, 2018-2032 (USD THOUSAND)
TABLE 71 MEXICO HIGH VOLTAGE DIRECT CURRENT (HVDC) TRANSMISSION MARKET, BY PROJECT TYPE, 2018-2032 (USD THOUSAND)
TABLE 72 MEXICO HIGH VOLTAGE DIRECT CURRENT (HVDC) TRANSMISSION MARKET, BY TECHNOLOGY, 2018-2032 (USD THOUSAND)
TABLE 73 MEXICO HIGH VOLTAGE DIRECT CURRENT (HVDC) TRANSMISSION MARKET, BY APPLICATION, 2018-2032 (USD THOUSAND)
TABLE 74 MEXICO BULK POWER TRANSMISSION IN HIGH VOLTAGE DIRECT CURRENT (HVDC) TRANSMISSION MARKET, BY TYPE, 2018-2032 (USD THOUSAND)
TABLE 75 MEXICO INTERCONNECTING GRIDS IN HIGH VOLTAGE DIRECT CURRENT (HVDC) TRANSMISSION MARKET, BY TYPE, 2018-2032 (USD THOUSAND)
TABLE 76 MEXICO IN-FEED URBAN AREAS IN HIGH VOLTAGE DIRECT CURRENT (HVDC) TRANSMISSION MARKET, BY TYPE, 2018-2032 (USD THOUSAND)
TABLE 77 MEXICO HIGH VOLTAGE DIRECT CURRENT (HVDC) TRANSMISSION MARKET, BY POWER RATING, 2018-2032 (USD THOUSAND)
TABLE 78 MEXICO HIGH VOLTAGE DIRECT CURRENT (HVDC) TRANSMISSION MARKET, BY VOLTAGE RATING, 2018-2032 (USD THOUSAND)
List of Figure
FIGURE 1 NORTH AMERICA HIGH VOLTAGE DIRECT CURRENT (HVDC) TRANSMISSION MARKET
FIGURE 2 NORTH AMERICA HIGH VOLTAGE DIRECT CURRENT (HVDC) TRANSMISSION MARKET: DATA TRIANGULATION
FIGURE 3 NORTH AMERICA HIGH VOLTAGE DIRECT CURRENT (HVDC) TRANSMISSION MARKET: DROC ANALYSIS
FIGURE 4 NORTH AMERICA HIGH VOLTAGE DIRECT CURRENT (HVDC) TRANSMISSION MARKET: NORTH AMERICA VS REGIONAL MARKET ANALYSIS
FIGURE 5 NORTH AMERICA HIGH VOLTAGE DIRECT CURRENT (HVDC) TRANSMISSION MARKET: COMPANY RESEARCH ANALYSIS
FIGURE 6 NORTH AMERICA HIGH VOLTAGE DIRECT CURRENT (HVDC) TRANSMISSION MARKET: MULTIVARIATE MODELLING
FIGURE 7 NORTH AMERICA HIGH VOLTAGE DIRECT CURRENT (HVDC) TRANSMISSION MARKET: INTERVIEW DEMOGRAPHICS
FIGURE 8 NORTH AMERICA HIGH VOLTAGE DIRECT CURRENT (HVDC) TRANSMISSION MARKET: DBMR MARKET POSITION GRID
FIGURE 9 NORTH AMERICA HIGH VOLTAGE DIRECT CURRENT (HVDC) TRANSMISSION MARKET: VENDOR SHARE ANALYSIS
FIGURE 10 NORTH AMERICA HIGH VOLTAGE DIRECT CURRENT (HVDC) TRANSMISSION MARKET: SEGMENTATION
FIGURE 11 EXECUTIVE SUMMARY
FIGURE 12 THREE SEGMENTS COMPRISE THE NORTH AMERICA HIGH VOLTAGE DIRECT CURRENT (HVDC) TRANSMISSION, BY PROJECT TYPE (2024)
FIGURE 13 STRATEGIC DECISIONS
FIGURE 14 RISING NEED TO TRANSMIT RENEWABLE ENERGY OVER LONG DISTANCES IS EXPECTED TO DRIVE THE NORTH AMERICA HIGH VOLTAGE DIRECT CURRENT (HVDC) TRANSMISSION MARKET IN THE FORECAST PERIOD OF 2025 TO 2032
FIGURE 15 THE CONVERTER STATIONS SEGMENT IS EXPECTED TO ACCOUNT FOR THE LARGEST MARKET SHARE OF THE NORTH AMERICA HIGH VOLTAGE DIRECT CURRENT (HVDC) TRANSMISSION MARKET IN 2025 AND 2032
FIGURE 16 PATENT FAMILIES
FIGURE 17 PATENT FAMILIES
FIGURE 18 NORTH AMERICA HIGH VOLTAGE DIRECT CURRENT (HVDC) TRANSMISSION MARKET VALUE CHAIN ANALYSIS
FIGURE 19 NORTH AMERICA HIGH VOLTAGE DIRECT CURRENT (HVDC) TRANSMISSION MARKETSUPPLY CHAIN ANALAYSIS
FIGURE 20 DRIVERS, RESTRINTS, OPPORTUNITIES AND CHALLENGES OF NORTH AMERICA HVDC TRANSMISSION MARKET
FIGURE 21 NORTH AMERICA HIGH VOLTAGE DIRECT CURRENT (HVDC) TRANSMISSION MARKET: BY COMPONENT, 2024
FIGURE 22 NORTH AMERICA HIGH VOLTAGE DIRECT CURRENT (HVDC) TRANSMISSION MARKET: BY PROJECT TYPE, 2024
FIGURE 23 NORTH AMERICA HIGH VOLTAGE DIRECT CURRENT (HVDC) TRANSMISSION MARKET: BY TECHNOLOGY, 2024
FIGURE 24 NORTH AMERICA HIGH VOLTAGE DIRECT CURRENT (HVDC) TRANSMISSION MARKET: BY APPLICATION, 2024
FIGURE 25 NORTH AMERICA HIGH VOLTAGE DIRECT CURRENT (HVDC) TRANSMISSION MARKET: BY POWER RATING, 2024
FIGURE 26 NORTH AMERICA HIGH VOLTAGE DIRECT CURRENT (HVDC) TRANSMISSION MARKET: BY VOLTAGE RATING, 2024
FIGURE 27 NORTH AMERICA HIGH VOLTAGE DIRECT CURRENT (HVDC) TRANSMISSION MARKET: SNAPSHOT (2025)
FIGURE 28 NORTH AMERICA HIGH VOLTAGE DIRECT CURRENT (HVDC) TRANSMISSION MARKET: COMPANY SHARE 2024 (%)
North America Hvdc Transmission Market, Supply Chain Analysis and Ecosystem Framework
To support market growth and help clients navigate the impact of geopolitical shifts, DBMR has integrated in-depth supply chain analysis into its North America Hvdc Transmission Market research reports. This addition empowers clients to respond effectively to global changes affecting their industries. The supply chain analysis section includes detailed insights such as North America Hvdc Transmission Market consumption and production by country, price trend analysis, the impact of tariffs and geopolitical developments, and import and export trends by country and HSN code. It also highlights major suppliers with data on production capacity and company profiles, as well as key importers and exporters. In addition to research, DBMR offers specialized supply chain consulting services backed by over a decade of experience, providing solutions like supplier discovery, supplier risk assessment, price trend analysis, impact evaluation of inflation and trade route changes, and comprehensive market trend analysis.
Data collection and base year analysis are done using data collection modules with large sample sizes. The stage includes obtaining market information or related data through various sources and strategies. It includes examining and planning all the data acquired from the past in advance. It likewise envelops the examination of information inconsistencies seen across different information sources. The market data is analysed and estimated using market statistical and coherent models. Also, market share analysis and key trend analysis are the major success factors in the market report. To know more, please request an analyst call or drop down your inquiry.
The key research methodology used by DBMR research team is data triangulation which involves data mining, analysis of the impact of data variables on the market and primary (industry expert) validation. Data models include Vendor Positioning Grid, Market Time Line Analysis, Market Overview and Guide, Company Positioning Grid, Patent Analysis, Pricing Analysis, Company Market Share Analysis, Standards of Measurement, Global versus Regional and Vendor Share Analysis. To know more about the research methodology, drop in an inquiry to speak to our industry experts.
Data Bridge Market Research is a leader in advanced formative research. We take pride in servicing our existing and new customers with data and analysis that match and suits their goal. The report can be customized to include price trend analysis of target brands understanding the market for additional countries (ask for the list of countries), clinical trial results data, literature review, refurbished market and product base analysis. Market analysis of target competitors can be analyzed from technology-based analysis to market portfolio strategies. We can add as many competitors that you require data about in the format and data style you are looking for. Our team of analysts can also provide you data in crude raw excel files pivot tables (Fact book) or can assist you in creating presentations from the data sets available in the report.


