
North America Hyaluronic Acid Market For Knee Osteoarthritis Treatment Market
Market Size in USD Million
 USD
870.49 Million
USD
1,531.72 Million
2024
2032
USD
870.49 Million
USD
1,531.72 Million
2024
2032
| 2025 - 2032 | |
| USD 870.49 Million | |
| USD 1,531.72 Million | |
| % | |
|
Hyaluronic Acid Market for Knee Osteoarthritis Treatment Market Size
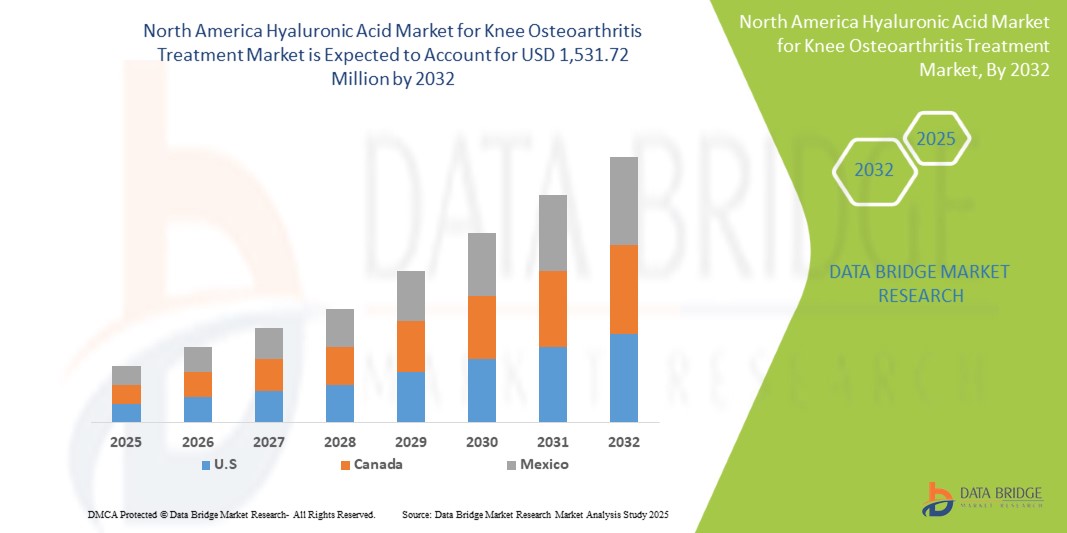
- The North America Hyaluronic Acid Market for Knee Osteoarthritis Treatmentmarket was valued at USD 870.49 million in 2024 and is expected to reach USD 1,531.72 million by 2032
- During the forecast period of 2025 to 2032 the market is likely to grow at a CAGR of 7.4% primarily driven by the anticipated launch of therapies
- The rising prevalence of knee osteoarthritis and the growing preference for minimally invasive treatments are driving demand for hyaluronic acid-based therapies. Additionally, increasing awareness about the benefits of viscosupplementation is further propelling market growth.
Hyaluronic Acid Market for Knee Osteoarthritis Treatment Market Analysis
- Hyaluronic acid is a naturally occurring substance in the body, particularly in connective tissues, skin, and synovial fluid that lubricates joints. In the context of knee osteoarthritis treatment, hyaluronic acid is utilized as a viscosupplement to improve joint function and alleviate pain. By injecting hyaluronic acid directly into the knee joint, it can enhance the cushioning effect, reduce friction during movement, and promote the regeneration of cartilage, providing relief for individuals suffering from osteoarthritis symptoms. This treatment aims to restore mobility, improve quality of life, and delay the progression of the disease.
- North America emerges as a leading region in the Hyaluronic Acid Market for Knee Osteoarthritis Treatment, driven by its well-established healthcare system and high adoption of advanced, non-surgical joint care options.
- For instance, the U.S. shows strong uptake of intra-articular hyaluronic acid injections, supported by growing patient awareness and favorable reimbursement policies
- The region's focus on improving mobility and quality of life for osteoarthritis patients continues to drive innovation and market expansion in hyaluronic acid-based therapies.
Report Scope and Hyaluronic Acid Market for Knee Osteoarthritis Treatment Segmentation
|
Attributes |
Hyaluronic Acid Market for Knee Osteoarthritis Treatment Key Market Insights |
|
Segments Covered |
|
|
Countries Covered |
|
|
Key Market Players |
|
|
Market Opportunities |
|
|
Value Added Data Infosets |
In addition to the insights on market scenarios such as market value, growth rate, segmentation, geographical coverage, and major players, the market reports curated by the Data Bridge Market Research also include import export analysis, production capacity overview, production consumption analysis, price trend analysis, climate change scenario, supply chain analysis, value chain analysis, raw material/consumables overview, vendor selection criteria, PESTLE Analysis, Porter Analysis, and regulatory framework. |
Hyaluronic Acid Market for Knee Osteoarthritis Treatment Market Trends
“Growing Preference for Minimally Invasive and Targeted Therapies”
- A key trend in the North America Hyaluronic Acid Market for Knee Osteoarthritis Treatment is the increasing preference for minimally invasive, targeted treatment options.
- Hyaluronic acid injections, also known as viscosupplementation, offer localized pain relief and improved joint mobility without the need for surgical intervention, making them highly attractive to both patients and clinicians
- For instance, single and multi-injection formulations tailored to patient needs are gaining traction, offering flexibility and convenience in treatment regimens
- The trend is further supported by advancements in injection techniques, improved formulation stability, and extended duration of therapeutic effects.
- Additionally, the integration of imaging technologies such as ultrasound-guided injections enhances precision and patient comfort.
- This shift towards non-surgical, effective, and patient-centric treatment options is shaping the future of knee osteoarthritis care and fueling growth in the hyaluronic acid market.
Hyaluronic Acid Market for Knee Osteoarthritis Treatment Market Dynamics
Driver
“Increasing Prevalence of Knee Osteoarthritis”
- As the North America population increasingly comprises older adults, the prevalence of osteoarthritis, a degenerative joint condition characterized by the breakdown of cartilage, is expected to grow significantly. This growing demographic trend is particularly alarming since osteoarthritis leads to symptoms such as chronic pain, stiffness, and decreased mobility, which can severely impact the quality of life for individuals affected. The rising incidence of osteoarthritis is prompting a surge in the demand for effective treatment solutions, as many patients are seeking alternatives to invasive surgical options. Hyaluronic acid (HA) injections have emerged as a highly favored minimally invasive treatment option that effectively alleviates symptoms by providing lubrication to the affected joint, thus enhancing joint function and mobility.
- These injections work by supplementing the naturally occurring hyaluronic acid in the synovial fluid, reducing friction between joints and promoting better shock absorption. This dual action not only helps to relieve pain but also improves overall joint health, making HA an appealing choice for both patients and healthcare providers.
For instance,
- In December 2023, NCBI stated that studies continue to illustrate the high prevalence of OA worldwide, with a greater burden among older individuals, women, some racial and ethnic groups, and individuals with lower socioeconomic status. Modifiable risk factors for OA with the strongest evidence are obesity and joint injury
- In November 2024, according an article published by Frontiers, an Indian study reported increasing KOA prevalence rates across different age groups: 19.2% for those under 50, 30.7% for those aged 50–60, 39.7% for those aged 60–70, and 54.1% for those over 70 (23). Another study revealed that both the prevalence and incidence of knee osteoarthritis significantly rise after age 55. Among individuals over 55, the average prevalence rate is 13.2%, with 9.4% for men and 18.0% for women
- The growing awareness of hyaluronic acid's benefits has contributed to its adoption among healthcare professionals and patients alike. As clinical studies and research continue to demonstrate the efficacy of hyaluronic acid in reducing pain and enhancing quality of life for those suffering from knee osteoarthritis, more healthcare providers are incorporating these treatments into their practice. This increasing acceptance, coupled with the rise in osteoarthritis cases, creates a favorable environment for market growth, driving innovation and competition among manufacturers to develop advanced formulations and delivery methods for hyaluronic acid therapies.
Opportunity
“Advancements In Hyaluronic Acid Formulations and Delivery Systems”
- Improved high-molecular-weight and cross-linked hyaluronic acid products provide longer-lasting pain relief and require fewer injections. This appeals to patients seeking effective and convenient solutions for managing their condition. Innovative delivery methods, such as hydrogels and nanoparticle systems, enhance the durability and performance of hyaluronic acid in the joint. These developments meet the rising demand from an aging population. Companies can leverage these technologies to stand out in a competitive market and attract more customers. The focus on reducing treatment frequency while improving patient outcomes strengthens the market’s growth potential. This makes the hyaluronic acid sector for knee osteoarthritis treatment a highly attractive area for investment and expansion
For instance,
- As per IBSA Institut Biochimique SA, Sanofi, Seikagaku Corporation, each company has developed unique formulations to enhance joint lubrication, pain relief, and treatment durability. These innovations focus on improved retention, cross-linking technology, and patient convenience, offering long-lasting symptom relief
- In April 2024 article by sciencedirect highlighted that hyaluronic acid-based liposomes for osteoarthritis drug delivery include surface functionalization after liposome preparation using coupling chemistry or pre-synthesized hyaluronic acid-lipid conjugates through reductive amination. These methods improve biocompatibility, enable simultaneous delivery of various drugs, and enhance control over conjugation, optimizing liposomal systems for effective arthritis treatment
- Advancements in hyaluronic acid formulations and delivery systems significantly enhance the effectiveness and convenience of knee osteoarthritis treatment. By improving product longevity and reducing the frequency of injections, these innovations cater to the growing demand for minimally invasive solutions among an aging population. Companies that embrace these technologies can strengthen their market presence, attract more patients, and capitalize on industry growth. This makes investment in hyaluronic acid-based treatments a strategic opportunity for long-term success in the evolving healthcare landscape.
Restraint/Challenge
“Cost-Related Challenges and Accessibility Concerns For Hyaluronic Acid Therapy In Knee Osteoarthritis”
- Hyaluronic acid (HA) injections for knee osteoarthritis can be prohibitively expensive, particularly when insurance plans either do not cover them fully or exclude them entirely from their benefits. This financial burden often forces patients to pay out-of-pocket, which can be a significant challenge, especially for those with limited financial resources.
- Moreover, multiple injections may be required over time, increasing the cost of treatment. As a result, patients may delay or forgo HA therapy altogether, despite its potential to alleviate pain and improve joint function. The high cost of treatment and lack of insurance coverage often limit accessibility, creating disparities in care. Addressing these financial challenges is vital for making HA therapy more accessible to a wider range of patients, ensuring that more people can benefit from this effective treatment for knee osteoarthritis.
For instance,
- In February 2024, Findings from Pain Physician indicate that Patients receiving HA injections faced significantly higher median costs, especially with multiple injections, compared to those receiving corticosteroid (CS) injections or no injections. Additionally, those requiring total knee arthroplasty (TKA) had higher costs with HA treatment, highlighting the financial barriers associated with this therapy
- As per Sanofi, Enovis and biovico , the high cost of hyaluronic acid (HA) therapy for knee osteoarthritis, such as Synvisc One (USD 232.81) and Biolevox Ha (USD 323.53), limits accessibility. Many patients struggle with affordability, especially without insurance. Lower-cost options, better coverage, and pricing reforms are essential for improving access to these treatments
- The high expense of hyaluronic acid (HA) injections and limited insurance coverage create substantial barriers for many knee osteoarthritis patients. These financial challenges, including the need for multiple injections, often lead patients to delay or abandon HA therapy despite its proven benefits in pain relief and joint function improvement. To improve accessibility and ensure that more individuals can benefit from this treatment, it is essential to address these cost-related issues. Expanding insurance coverage and reducing out-of-pocket expenses will help make HA therapy more accessible, ultimately leading to better care for those suffering from knee osteoarthritis.
Hyaluronic Acid Market for Knee Osteoarthritis Treatment Market Scope
The market is segmented on the basis type, product type, absorption site, age group, source, delivery method, gender, and distribution channel.
|
Segmentation |
Sub-Segmentation |
|
By Product Type |
|
|
By Formulation |
|
|
By Molecular Weight |
|
|
By Treatment Goals
|
|
|
By End User |
|
|
By Distribution Channel |
|
Hyaluronic Acid Market for Knee Osteoarthritis Treatment Market Regional Analysis
“U.S. is the Dominant and Fast-growing Country in the Hyaluronic Acid Market for Knee Osteoarthritis Treatment”
- U.S. leads the Hyaluronic Acid Market for Knee Osteoarthritis Treatment, supported by its advanced healthcare infrastructure, early adoption of non-surgical joint therapies, and the strong presence of key market players.
- The U.S. holds a major market share due to the rising incidence of knee osteoarthritis, growing elderly population, and increasing preference for minimally invasive treatments like intra-articular hyaluronic acid injections.
- Favorable reimbursement policies, well-established regulatory frameworks, and increased healthcare spending further contributes to the market's growth in the region.
- Additionally, the focus on improving patient mobility and quality of life, combined with innovations in HA formulations and delivery techniques, continues to drive market expansion across U.S
Hyaluronic Acid Market for Knee Osteoarthritis Treatment Market Share
The market competitive landscape provides details by competitor. Details included are company overview, company financials, revenue generated, market potential, investment in research and development, new market initiatives, North America presence, production sites and facilities, production capacities, company strengths and weaknesses, product launch, product width and breadth, application dominance. The above data points provided are only related to the companies' focus related to market.
The Major Market Leaders Operating in the Market Are:
- LG Chem (South Korea)
- Bioventus LLC (U.S.)
- Seikagaku Corporation (Japan)
- Sanofi (France)
- Anika Therapeutics, Inc. (U.S.)
- IBSA Institut Biochimique SA (Switzerland)
- Viatris (U.S.)
- Zimmer Biomet (U.S.)
- Fidia Farmaceutici S.p.A. (Italy)
- Ferring Pharmaceuticals (Switzerland
- TRB CHEMEDICA SA (Switzerland)
- Hangzhou Singclean Medical Products Co., Ltd. (China)
- Hanmi Pharm. Co., Ltd. (South Korea)
- Virchow Biotech (India)
- Eupraxia Pharmaceuticals (Canada)
Latest Developments in North America Hyaluronic Acid Market for Knee Osteoarthritis Treatment
- In July 2024, LG Chem entered chinese osteoarthritis treatment market. It Partnered with Yifan Pharmaceutical to launch Synovian injection for osteoarthritis in China. This allowed the company to enter and expand its portfolio.
- In May 2023, Eupraxia Pharmaceuticals announced the completion of the last patient visit in its Phase 2 clinical trial for EP-104IAR, aimed at treating osteoarthritis (OA). The company is on track for top-line data in Q2, with expectations of demonstrating significant pain relief and improved patient function, alongside a promising safety profile.
- In March 2025, IBSA has partnered with distributor Lunatus to expand its osteoarticular treatments in Saudi Arabia and the UAE. This strategic collaboration aims to enhance pain management solutions and may extend to other regional countries, addressing the rising demand for advanced care among populations affected by osteoarticular disorders.
- In June 2023, Eupraxia Pharmaceuticals announced that the U.S. FDA granted Fast Track designation for EP-104IAR in treating osteoarthritis (OA) of the knee. This designation aims to expedite development and regulatory review, facilitating more frequent interactions with the FDA. The company is advancing its Phase 2 trial with top-line data expected in Q2 2023.
SKU-

- Interactive Data Analysis Dashboard
- Company Analysis Dashboard for high growth potential opportunities
- Research Analyst Access for customization & queries
- Competitor Analysis with Interactive dashboard
- Latest News, Updates & Trend analysis
- Harness the Power of Benchmark Analysis for Comprehensive Competitor Tracking
Table of Content
1 INTRODUCTION
1.1 OBJECTIVES OF THE STUDY
1.2 MARKET DEFINITION
1.3 OVERVIEW OF THE NORTH AMERICA HYALURONIC ACID MARKET FOR KNEE OSTEOARTHRITIS TREATMENT
1.4 CURRENCY AND PRICING
1.5 LIMITATIONS
1.6 MARKETS COVERED
2 MARKET SEGMENTATION
2.1 MARKETS COVERED
2.2 GEOGRAPHICAL SCOPE
2.3 YEARS CONSIDERED FOR THE STUDY
2.4 DBMR TRIPOD DATA VALIDATION MODEL
2.5 MULTIVARIATE MODELLING
2.6 TREATMENT TYPE LIFELINE CURVE
2.7 PRIMARY INTERVIEWS WITH KEY OPINION LEADERS
2.8 DBMR MARKET POSITION GRID
2.9 MARKET END USER COVERAGE GRID
2.1 VENDOR SHARE ANALYSIS
2.11 SECONDARY SOURCES
2.12 ASSUMPTIONS
3 EXECUTIVE SUMMARY
4 PREMIUM INSIGHTS
4.1 PESTAL ANALYSIS
4.2 PORTERS FIVE FORCES ANALYSIS
4.3 AVERAGE SELLING PRICE (ASP) ANALYSIS
4.4 MICRO AND MACRO ECONOMIC FACTORS
4.5 KEY PRICING STRATEGIES
4.6 HEALTHCARE ECONOMY
4.7 PENETRATION AND GROWTH PROSPECT MAPPING
4.8 TECHNOLOGY ROADMAP
4.9 VALUE CHAIN ANALYSIS
5 COMPANY-WISE OVERVIEW OF INTRA-ARTICULAR HYALURONIC ACID (HA) INJECTION PRODUCTS BASED ON MOLECULAR WEIGHT -
6 NORTH AMERICA HYALURONIC ACID MARKET FOR KNEE OSTEOARTHRITIS TREATMENT, REGULATORY FRAMEWORK
6.1 NORTH AMERICA
6.2 EUROPE
6.3 ASIA-PACIFIC
6.4 MIDDLE EAST AND AFRICA
7 MARKET OVERVIEW
7.1 DRIVERS
7.1.1 INCREASING PREVALENCE OF KNEE OSTEOARTHRITIS
7.1.2 GROWING PREFERENCE FOR MINIMALLY INVASIVE AND NON-SURGICAL TREATMENT OPTIONS
7.1.3 CLINICAL VALIDATION OF HYALURONIC ACID IN OSTEOARTHRITIS TREATMENT
7.1.4 RECENT LAUNCHES OF HYALURONIC ACID FOR OSTEOARTHRITIS TREATMENT
7.2 RESTRAINTS
7.2.1 COMPETITION OF ALTERNATIVE THERAPIES FOR KNEE OSTEOARTHRITIS
7.2.2 REGULATORY CHALLENGES FACED BY THE MANUFACTURERS IN THE HYALURONIC ACID MARKET
7.3 OPPORTUNITIES
7.3.1 ADVANCEMENTS IN HYALURONIC ACID FORMULATIONS AND DELIVERY SYSTEMS
7.3.2 RAISING AWARENESS AND ACCEPTANCE OF HYALURONIC ACID FOR KNEE OSTEOARTHRITIS TREATMENT AMONG PHYSICIANS AND PATIENTS
7.3.3 THE IMPACT OF COMBINING HYALURONIC ACID WITH OTHER THERAPEUTIC OPTIONS FOR KNEE OSTEOARTHRITIS
7.4 CHALLENGES
7.4.1 COST-RELATED CHALLENGES AND ACCESSIBILITY CONCERNS FOR HYALURONIC ACID THERAPY IN KNEE OSTEOARTHRITIS
7.4.2 SHORT-TERM BENEFITS WITH LIMITED LASTING EFFICACY OF HYALURONIC ACID FOR KNEE OA
8 NORTH AMERICA HYALURONIC ACID MARKET FOR KNEE OSTEOARTHRITIS TREATMENT, BY PRODUCT TYPE
8.1 OVERVIEW
8.2 SINGLE INJECTION (MONOPHASIC)
8.3 THREE-INJECTION REGIMEN (TRIPHASIC)
8.4 FIVE-INJECTION REGIMEN (PENTAPHASIC)
9 NORTH AMERICA HYALURONIC ACID MARKET FOR KNEE OSTEOARTHRITIS TREATMENT, BY FORMULATION
9.1 OVERVIEW
9.2 CROSS-LINKED HYALURONIC ACID
9.3 NON-CROSS-LINKED HYALURONIC ACID
10 NORTH AMERICA HYALURONIC ACID MARKET FOR KNEE OSTEOARTHRITIS TREATMENT, BY MOLECULAR WEIGHT
10.1 OVERVIEW
10.2 HIGH MOLECULAR WEIGHT (HMW) HA
10.3 LOW MOLECULAR WEIGHT (LMW) HA
10.4 INTERMEDIATE MOLECULAR WEIGHT HA
11 NORTH AMERICA HYALURONIC ACID MARKET FOR KNEE OSTEOARTHRITIS TREATMENT, BY TREATMENT GOALS
11.1 OVERVIEW
11.2 VISCOSUPPLEMENTATION
11.3 ANTI-INFLAMMATORY & PAIN REDUCTION
11.4 CARTILAGE PROTECTION & REGENERATION
12 NORTH AMERICA HYALURONIC ACID MARKET FOR KNEE OSTEOARTHRITIS TREATMENT, BY END USER
12.1 OVERVIEW
12.2 HOSPITALS
12.3 ORTHOPEDIC CLINICS
12.4 AMBULATORY SURGICAL CENTERS
12.5 SPECIALTY PAIN MANAGEMENT CENTERS
13 NORTH AMERICA HYALURONIC ACID MARKET FOR KNEE OSTEOARTHRITIS TREATMENT, BY DISTRIBUTION CHANNEL
13.1 OVERVIEW
13.2 DIRECT TENDER
13.3 RETAIL & ONLINE PHARMACIES
13.4 OTHERS
14 NORTH AMERICA HYALURONIC ACID MARKET FOR KNEE OSTEOARTHRITIS TREATMENT, BY REGION
14.1 NORTH AMERICA
14.1.1 U.S.
14.1.2 CANADA
14.1.3 MEXICO
15 NORTH AMERICA HYALURONIC ACID MARKET FOR KNEE OSTEOARTHRITIS TREATMENT: COMPANY LANDSCAPE
15.1 COMPANY SHARE ANALYSIS: GLOBAL
16 SWOT ANALYSIS
17 COMPANY PROFILE
17.1 LG CHEM
17.1.1 COMPANY SNAPSHOT
17.1.2 REVENUE ANALYSIS
17.1.3 COMPANY SHARE ANALYSIS
17.1.4 PRODUCT PORTFOLIO
17.1.5 RECENT DEVELOPMENTS
17.2 BIOVENTUS
17.2.1 COMPANY SNAPSHOT
17.2.2 REVENUE ANALYSIS
17.2.3 COMPANY SHARE ANALYSIS
17.2.4 PRODUCT PORTFOLIO
17.2.5 RECENT DEVELOPMENT
17.3 SEIKAGAKU CORPORATION
17.3.1 COMPANY SNAPSHOT
17.3.2 REVENUE ANALYSIS
17.3.3 COMPANY SHARE ANALYSIS
17.3.4 PRODUCT PORTFOLIO
17.3.5 RECENT DEVELOPMENT
17.4 SANOFI
17.4.1 COMPANY SNAPSHOT
17.4.2 REVENUE ANALYSIS
17.4.3 COMPANY SHARE ANALYSIS
17.4.4 PRODUCT PORTFOLIO
17.4.5 RECENT DEVELOPMENT
17.5 ANIKA THERAPEUTICS, INC.
17.5.1 COMPANY SNAPSHOT
17.5.2 REVENUE ANALYSIS
17.5.3 COMPANY SHARE ANALYSIS
17.5.4 PRODUCT PORTFOLIO
17.5.5 RECENT DEVELOPMENT
17.6 EUPRAXIA PHARMACEUTICALS
17.6.1 COMPANY SNAPSHOT
17.6.2 REVENUE ANALYSIS
17.6.3 PRODUCT PORTFOLIO
17.6.4 RECENT DEVELOPMENT
17.7 FIDIA FARMACEUTICI S.P.A.
17.7.1 COMPANY SNAPSHOT
17.7.2 REVENUE ANALYSIS
17.7.3 PRODUCT PORTFOLIO
17.7.4 RECENT DEVELOPMENT
17.8 FERRING
17.8.1 COMPANY SNAPSHOT
17.8.2 PRODUCT PORTFOLIO
17.8.3 RECENT DEVELOPMENT
17.9 HANGZHOU SINGCLEAN MEDICAL PRODUCTS CO.,LTD.
17.9.1 COMPANY SNAPSHOT
17.9.2 PRODUCT PORTFOLIO
17.9.3 RECENT DEVELOPMENTS
17.1 HANMI PHARM.CO., LTD
17.10.1 COMPANY SNAPSHOT
17.10.2 REVENUE ANALYSIS
17.10.3 PRODUCT PORTFOLIO
17.10.4 RECENT DEVELOPMENT
17.11 IBSA INSTITUT BIOCHIMIQUE SA.
17.11.1 COMPANY SNAPSHOT
17.11.2 PRODUCT PORTFOLIO
17.11.3 RECENT DEVELOPMENT
17.12 TRB CHEMEDICA INTERNATIONAL SA
17.12.1 COMPANY SNAPSHOT
17.12.2 PRODUCT PORTFOLIO
17.12.3 RECENT DEVELOPMENTS
17.13 VIATRIS INC.
17.13.1 COMPANY SNAPSHOT
17.13.2 REVENUE ANALYSIS
17.13.3 PRODUCT PORTFOLIO
17.13.4 RECENT DEVELOPMENT
17.14 VIRCHOW BIOTECH
17.14.1 COMPANY SNAPSHOT
17.14.2 PRODUCT PORTFOLIO
17.14.3 RECENT DEVELOPMENTS
17.15 ZIMMER BIOMET
17.15.1 COMPANY SNAPSHOT
17.15.2 REVENUE ANALYSIS
17.15.3 PRODUCT PORTFOLIO
17.15.4 RECENT DEVELOPMENT
18 QUESTIONNAIRE
19 RELATED REPORTS
List of Table
TABLE 1 COMPANY PRODUCT AND ADVANCEMENT IN FORMULATION
TABLE 2 COMPANY PRODUCT AND COMBINATION THERAPY
TABLE 3 PRICE OF THE HYALURONIC ACID INJECTION
TABLE 4 COMPANY PRODUCT AND LASTING EFFICACY
TABLE 5 NORTH AMERICA HYALURONIC ACID MARKET FOR KNEE OSTEOARTHRITIS TREATMENT, BY PRODUCT TYPE, 2018-2032 (USD THOUSAND)
TABLE 6 NORTH AMERICA SINGLE INJECTION (MONOPHASIC) IN HYALURONIC ACID MARKET FOR KNEE OSTEOARTHRITIS TREATMENT, BY REGION, 2018-2032 (USD THOUSAND)..
TABLE 7 NORTH AMERICA THREE-INJECTION REGIMEN (TRIPHASIC) IN HYALURONIC ACID MARKET FOR KNEE OSTEOARTHRITIS TREATMENT, BY REGION, 2018-2032 (USD THOUSAND)
TABLE 8 NORTH AMERICA FIVE-INJECTION REGIMEN (PENTAPHASIC IN HYALURONIC ACID MARKET FOR KNEE OSTEOARTHRITIS TREATMENT, BY REGION, 2018-2032 (USD THOUSAND)
TABLE 9 NORTH AMERICA HYALURONIC ACID MARKET FOR KNEE OSTEOARTHRITIS TREATMENT, BY FORMULATION, 2018-2032 (USD THOUSAND)
TABLE 10 NORTH AMERICA CROSS-LINKED HYALURONIC ACID IN HYALURONIC ACID MARKET FOR KNEE OSTEOARTHRITIS TREATMENT, BY REGION, 2018-2032 (USD THOUSAND)
TABLE 11 NORTH AMERICA NON-CROSS-LINKED HYALURONIC ACID IN HYALURONIC ACID MARKET FOR KNEE OSTEOARTHRITIS TREATMENT, BY REGION, 2018-2032 (USD THOUSAND)
TABLE 12 NORTH AMERICA HYALURONIC ACID MARKET FOR KNEE OSTEOARTHRITIS TREATMENT, BY MOLECULAR WEIGHT, 2018-2032 (USD THOUSAND)
TABLE 13 NORTH AMERICA HIGH MOLECULAR WEIGHT (HMW) HA IN HYALURONIC ACID MARKET FOR KNEE OSTEOARTHRITIS TREATMENT, BY REGION, 2018-2032 (USD THOUSAND)
TABLE 14 NORTH AMERICA LOW MOLECULAR WEIGHT (LMW) HA IN HYALURONIC ACID MARKET FOR KNEE OSTEOARTHRITIS TREATMENT, BY REGION, 2018-2032 (USD THOUSAND)
TABLE 15 NORTH AMERICA INTERMEDIATE MOLECULAR WEIGHT HA IN HYALURONIC ACID MARKET FOR KNEE OSTEOARTHRITIS TREATMENT, BY REGION, 2018-2032 (USD THOUSAND)
TABLE 16 NORTH AMERICA HYALURONIC ACID MARKET FOR KNEE OSTEOARTHRITIS TREATMENT, BY TREATMENT GOALS, 2018-2032 (USD THOUSAND)
TABLE 17 NORTH AMERICA VISCOSUPPLEMENTATION IN HYALURONIC ACID MARKET FOR KNEE OSTEOARTHRITIS TREATMENT, BY REGION, 2018-2032 (USD THOUSAND)
TABLE 18 NORTH AMERICA ANTI-INFLAMMATORY & PAIN REDUCTION IN HYALURONIC ACID MARKET FOR KNEE OSTEOARTHRITIS TREATMENT, BY REGION, 2018-2032 (USD THOUSAND)
TABLE 19 NORTH AMERICA CARTILAGE PROTECTION & REGENERATION IN HYALURONIC ACID MARKET FOR KNEE OSTEOARTHRITIS TREATMENT, BY REGION, 2018-2032 (USD THOUSAND)
TABLE 20 NORTH AMERICA HYALURONIC ACID MARKET FOR KNEE OSTEOARTHRITIS TREATMENT, BY TREATMENT GOALS, 2018-2032 (USD THOUSAND)
TABLE 21 NORTH AMERICA HOSPITALS IN HYALURONIC ACID MARKET FOR KNEE OSTEOARTHRITIS TREATMENT, BY REGION, 2018-2032 (USD THOUSAND)
TABLE 22 NORTH AMERICA ORTHOPEDIC CLINICS IN HYALURONIC ACID MARKET FOR KNEE OSTEOARTHRITIS TREATMENT, BY REGION, 2018-2032 (USD THOUSAND)
TABLE 23 NORTH AMERICA AMBULATORY SURGICAL CENTERS IN HYALURONIC ACID MARKET FOR KNEE OSTEOARTHRITIS TREATMENT, BY REGION, 2018-2032 (USD THOUSAND)
TABLE 24 NORTH AMERICA SPECIALTY PAIN MANAGEMENT CENTERS IN HYALURONIC ACID MARKET FOR KNEE OSTEOARTHRITIS TREATMENT, BY REGION, 2018-2032 (USD THOUSAND)
TABLE 25 NORTH AMERICA HYALURONIC ACID MARKET FOR KNEE OSTEOARTHRITIS TREATMENT, BY DISTRIBUTION CHANNEL, 2018-2032 (USD THOUSAND)
TABLE 26 NORTH AMERICA DIRECT TENDER IN HYALURONIC ACID MARKET FOR KNEE OSTEOARTHRITIS TREATMENT, BY REGION, 2018-2032 (USD THOUSAND)
TABLE 27 NORTH AMERICA RETAIL & ONLINE PHARMACIES IN HYALURONIC ACID MARKET FOR KNEE OSTEOARTHRITIS TREATMENT, BY REGION, 2018-2032 (USD THOUSAND)
TABLE 28 NORTH AMERICA OTHERS IN HYALURONIC ACID MARKET FOR KNEE OSTEOARTHRITIS TREATMENT, BY REGION, 2018-2032 (USD THOUSAND)
TABLE 29 NORTH AMERICA HYALURONIC ACID MARKET FOR KNEE OSTEOARTHRITIS TREATMENT, BY COUNTRY, 2018-2032 (USD THOUSAND)
TABLE 30 NORTH AMERICA HYALURONIC ACID MARKET FOR KNEE OSTEOARTHRITIS TREATMENT, BY PRODUCT TYPE, 2018-2032 (USD THOUSAND)
TABLE 31 NORTH AMERICA HYALURONIC ACID MARKET FOR KNEE OSTEOARTHRITIS TREATMENT, BY FORMULATION, 2018-2032 (USD THOUSAND)
TABLE 32 NORTH AMERICA HYALURONIC ACID MARKET FOR KNEE OSTEOARTHRITIS TREATMENT, BY MOLECULAR WEIGHT, 2018-2032 (USD THOUSAND)
TABLE 33 NORTH AMERICA HYALURONIC ACID MARKET FOR KNEE OSTEOARTHRITIS TREATMENT, BY TREATMENT GOALS, 2018-2032 (USD THOUSAND)
TABLE 34 NORTH AMERICA HYALURONIC ACID MARKET FOR KNEE OSTEOARTHRITIS TREATMENT, BY END USER, 2018-2032 (USD THOUSAND)
TABLE 35 NORTH AMERICA HYALURONIC ACID MARKET FOR KNEE OSTEOARTHRITIS TREATMENT, BY DISTRIBUTION CHANNEL, 2018-2032 (USD THOUSAND)
TABLE 36 U.S. HYALURONIC ACID MARKET FOR KNEE OSTEOARTHRITIS TREATMENT, BY PRODUCT TYPE, 2018-2032 (USD THOUSAND)
TABLE 37 U.S. HYALURONIC ACID MARKET FOR KNEE OSTEOARTHRITIS TREATMENT, BY FORMULATION, 2018-2032 (USD THOUSAND)
TABLE 38 U.S. HYALURONIC ACID MARKET FOR KNEE OSTEOARTHRITIS TREATMENT, BY MOLECULAR WEIGHT, 2018-2032 (USD THOUSAND)
TABLE 39 U.S. HYALURONIC ACID MARKET FOR KNEE OSTEOARTHRITIS TREATMENT, BY TREATMENT GOALS, 2018-2032 (USD THOUSAND)
TABLE 40 U.S. HYALURONIC ACID MARKET FOR KNEE OSTEOARTHRITIS TREATMENT, BY END USER, 2018-2032 (USD THOUSAND)
TABLE 41 U.S. HYALURONIC ACID MARKET FOR KNEE OSTEOARTHRITIS TREATMENT, BY DISTRIBUTION CHANNEL, 2018-2032 (USD THOUSAND)
TABLE 42 CANADA HYALURONIC ACID MARKET FOR KNEE OSTEOARTHRITIS TREATMENT, BY PRODUCT TYPE, 2018-2032 (USD THOUSAND)
TABLE 43 CANADA HYALURONIC ACID MARKET FOR KNEE OSTEOARTHRITIS TREATMENT, BY FORMULATION, 2018-2032 (USD THOUSAND)
TABLE 44 CANADA HYALURONIC ACID MARKET FOR KNEE OSTEOARTHRITIS TREATMENT, BY MOLECULAR WEIGHT, 2018-2032 (USD THOUSAND)
TABLE 45 CANADA HYALURONIC ACID MARKET FOR KNEE OSTEOARTHRITIS TREATMENT, BY TREATMENT GOALS, 2018-2032 (USD THOUSAND)
TABLE 46 CANADA HYALURONIC ACID MARKET FOR KNEE OSTEOARTHRITIS TREATMENT, BY END USER, 2018-2032 (USD THOUSAND)
TABLE 47 CANADA HYALURONIC ACID MARKET FOR KNEE OSTEOARTHRITIS TREATMENT, BY DISTRIBUTION CHANNEL, 2018-2032 (USD THOUSAND)
TABLE 48 MEXICO HYALURONIC ACID MARKET FOR KNEE OSTEOARTHRITIS TREATMENT, BY PRODUCT TYPE, 2018-2032 (USD THOUSAND)
TABLE 49 MEXICO HYALURONIC ACID MARKET FOR KNEE OSTEOARTHRITIS TREATMENT, BY FORMULATION, 2018-2032 (USD THOUSAND)
TABLE 50 MEXICO HYALURONIC ACID MARKET FOR KNEE OSTEOARTHRITIS TREATMENT, BY MOLECULAR WEIGHT, 2018-2032 (USD THOUSAND)
TABLE 51 MEXICO HYALURONIC ACID MARKET FOR KNEE OSTEOARTHRITIS TREATMENT, BY TREATMENT GOALS, 2018-2032 (USD THOUSAND)
TABLE 52 MEXICO HYALURONIC ACID MARKET FOR KNEE OSTEOARTHRITIS TREATMENT, BY END USER, 2018-2032 (USD THOUSAND)
TABLE 53 MEXICO HYALURONIC ACID MARKET FOR KNEE OSTEOARTHRITIS TREATMENT, BY DISTRIBUTION CHANNEL, 2018-2032 (USD THOUSAND)
List of Figure
FIGURE 1 NORTH AMERICA HYALURONIC ACID MARKET FOR KNEE OSTEOARTHRITIS TREATMENT: SEGMENTATION
FIGURE 2 NORTH AMERICA HYALURONIC ACID MARKET FOR KNEE OSTEOARTHRITIS TREATMENT: DATA TRIANGULATION
FIGURE 3 NORTH AMERICA HYALURONIC ACID MARKET FOR KNEE OSTEOARTHRITIS TREATMENT: DROC ANALYSIS
FIGURE 4 NORTH AMERICA HYALURONIC ACID MARKET FOR KNEE OSTEOARTHRITIS TREATMENT: REGIONAL MARKET ANALYSIS
FIGURE 5 NORTH AMERICA HYALURONIC ACID MARKET FOR KNEE OSTEOARTHRITIS TREATMENT: COMPANY RESEARCH ANALYSIS
FIGURE 6 NORTH AMERICA HYALURONIC ACID MARKET FOR KNEE OSTEOARTHRITIS TREATMENT: LIFELINE CURVE
FIGURE 7 NORTH AMERICA HYALURONIC ACID MARKET FOR KNEE OSTEOARTHRITIS TREATMENT: INTERVIEW DEMOGRAPHICS
FIGURE 8 NORTH AMERICA HYALURONIC ACID MARKET FOR KNEE OSTEOARTHRITIS TREATMENT: DBMR MARKET POSITION GRID
FIGURE 9 NORTH AMERICA HYALURONIC ACID MARKET FOR KNEE OSTEOARTHRITIS TREATMENT: MARKET END USER COVERAGE GRID
FIGURE 10 NORTH AMERICA HYALURONIC ACID MARKET FOR KNEE OSTEOARTHRITIS TREATMENT: VENDOR SHARE ANALYSIS
FIGURE 11 NORTH AMERICA HYALURONIC ACID MARKET FOR KNEE OSTEOARTHRITIS TREATMENT: SEGMENTATION
FIGURE 12 THREE SEGMENTS COMPRISE THE NORTH AMERICA HYALURONIC ACID MARKET FOR KNEE OSTEOARTHRITIS TREATMENT, BY PRODUCT TYPE
FIGURE 13 NORTH AMERICA HYALURONIC ACID MARKET FOR KNEE OSTEOARTHRITIS TREATMENT EXECUTIVE SUMMARY
FIGURE 14 STRATEGIC DECISIONS
FIGURE 15 RISING PREVALENCE OF KNEE OSTEOARTHRITIS IS EXPECTED TO DRIVE THE GROWTH OF NORTH AMERICA HYALURONIC ACID MARKET FOR KNEE OSTEOARTHRITIS TREATMENT FROM 2025 TO 2032
FIGURE 16 THE SINGLE INJECTION (MONOPHASIC) SEGMENT IS EXPECTED TO ACCOUNT FOR THE LARGEST SHARE OF THE NORTH AMERICA HYALURONIC ACID MARKET FOR KNEE OSTEOARTHRITIS TREATMENT IN 2025 - 2032
FIGURE 17 DROC ANALYSIS
FIGURE 18 NORTH AMERICA HYALURONIC ACID MARKET FOR KNEE OSTEOARTHRITIS TREATMENT: BY PRODUCT TYPE, 2024
FIGURE 19 NORTH AMERICA HYALURONIC ACID MARKET FOR KNEE OSTEOARTHRITIS TREATMENT: BY PRODUCT TYPE, 2025-2032 (USD THOUSAND)
FIGURE 20 NORTH AMERICA HYALURONIC ACID MARKET FOR KNEE OSTEOARTHRITIS TREATMENT: BY PRODUCT TYPE, CAGR (2025-2032)
FIGURE 21 NORTH AMERICA HYALURONIC ACID MARKET FOR KNEE OSTEOARTHRITIS TREATMENT: BY PRODUCT TYPE, LIFELINE CURVE
FIGURE 22 NORTH AMERICA HYALURONIC ACID MARKET FOR KNEE OSTEOARTHRITIS TREATMENT: BY FORMULATION, 2024
FIGURE 23 NORTH AMERICA HYALURONIC ACID MARKET FOR KNEE OSTEOARTHRITIS TREATMENT: BY FORMULATION, 2025-2032 (USD THOUSAND)
FIGURE 24 NORTH AMERICA HYALURONIC ACID MARKET FOR KNEE OSTEOARTHRITIS TREATMENT: BY FORMULATION, CAGR (2025-2032)
FIGURE 25 NORTH AMERICA HYALURONIC ACID MARKET FOR KNEE OSTEOARTHRITIS TREATMENT: BY FORMULATION, LIFELINE CURVE
FIGURE 26 NORTH AMERICA HYALURONIC ACID MARKET FOR KNEE OSTEOARTHRITIS TREATMENT: BY MOLECULAR WEIGHT, 2024
FIGURE 27 NORTH AMERICA HYALURONIC ACID MARKET FOR KNEE OSTEOARTHRITIS TREATMENT: BY MOLECULAR WEIGHT, 2025-2032 (USD THOUSAND)
FIGURE 28 NORTH AMERICA HYALURONIC ACID MARKET FOR KNEE OSTEOARTHRITIS TREATMENT: BY MOLECULAR WEIGHT, CAGR (2025-2032)
FIGURE 29 NORTH AMERICA HYALURONIC ACID MARKET FOR KNEE OSTEOARTHRITIS TREATMENT: BY MOLECULAR WEIGHT, LIFELINE CURVE
FIGURE 30 NORTH AMERICA HYALURONIC ACID MARKET FOR KNEE OSTEOARTHRITIS TREATMENT: BY TREATMENT GOALS, 2024
FIGURE 31 NORTH AMERICA HYALURONIC ACID MARKET FOR KNEE OSTEOARTHRITIS TREATMENT: BY TREATMENT GOALS, 2025-2032 (USD THOUSAND)
FIGURE 32 NORTH AMERICA HYALURONIC ACID MARKET FOR KNEE OSTEOARTHRITIS TREATMENT: BY TREATMENT GOALS, CAGR (2025-2032)
FIGURE 33 NORTH AMERICA HYALURONIC ACID MARKET FOR KNEE OSTEOARTHRITIS TREATMENT: BY TREATMENT GOALS, LIFELINE CURVE
FIGURE 34 NORTH AMERICA HYALURONIC ACID MARKET FOR KNEE OSTEOARTHRITIS TREATMENT: BY END USER, 2024
FIGURE 35 NORTH AMERICA HYALURONIC ACID MARKET FOR KNEE OSTEOARTHRITIS TREATMENT: BY END USER, 2025-2032 (USD THOUSAND)
FIGURE 36 NORTH AMERICA HYALURONIC ACID MARKET FOR KNEE OSTEOARTHRITIS TREATMENT: BY END USER, CAGR (2025-2032)
FIGURE 37 NORTH AMERICA HYALURONIC ACID MARKET FOR KNEE OSTEOARTHRITIS TREATMENT: BY END USER, LIFELINE CURVE
FIGURE 38 NORTH AMERICA HYALURONIC ACID MARKET FOR KNEE OSTEOARTHRITIS TREATMENT: BY DISTRIBUTION CHANNEL, 2024
FIGURE 39 NORTH AMERICA HYALURONIC ACID MARKET FOR KNEE OSTEOARTHRITIS TREATMENT: BY DISTRIBUTION CHANNEL, 2025-2032 (USD THOUSAND)
FIGURE 40 NORTH AMERICA HYALURONIC ACID MARKET FOR KNEE OSTEOARTHRITIS TREATMENT: BY DISTRIBUTION CHANNEL, CAGR (2025-2032)
FIGURE 41 NORTH AMERICA HYALURONIC ACID MARKET FOR KNEE OSTEOARTHRITIS TREATMENT: BY DISTRIBUTION CHANNEL, LIFELINE CURVE
FIGURE 42 NORTH AMERICA HYALURONIC ACID MARKET FOR KNEE OSTEOARTHRITIS TREATMENT: SNAPSHOT (2024)
FIGURE 43 NORTH AMERICA HYALURONIC ACID MARKET FOR KNEE OSTEOARTHRITIS TREATMENT: COMPANY SHARE 2024 (%)
Data collection and base year analysis are done using data collection modules with large sample sizes. The stage includes obtaining market information or related data through various sources and strategies. It includes examining and planning all the data acquired from the past in advance. It likewise envelops the examination of information inconsistencies seen across different information sources. The market data is analysed and estimated using market statistical and coherent models. Also, market share analysis and key trend analysis are the major success factors in the market report. To know more, please request an analyst call or drop down your inquiry.
The key research methodology used by DBMR research team is data triangulation which involves data mining, analysis of the impact of data variables on the market and primary (industry expert) validation. Data models include Vendor Positioning Grid, Market Time Line Analysis, Market Overview and Guide, Company Positioning Grid, Patent Analysis, Pricing Analysis, Company Market Share Analysis, Standards of Measurement, Global versus Regional and Vendor Share Analysis. To know more about the research methodology, drop in an inquiry to speak to our industry experts.
Data Bridge Market Research is a leader in advanced formative research. We take pride in servicing our existing and new customers with data and analysis that match and suits their goal. The report can be customized to include price trend analysis of target brands understanding the market for additional countries (ask for the list of countries), clinical trial results data, literature review, refurbished market and product base analysis. Market analysis of target competitors can be analyzed from technology-based analysis to market portfolio strategies. We can add as many competitors that you require data about in the format and data style you are looking for. Our team of analysts can also provide you data in crude raw excel files pivot tables (Fact book) or can assist you in creating presentations from the data sets available in the report.


